Grundläggande statistik
| Institutionella ägare | 160 total, 160 long only, 0 short only, 0 long/short - change of −1,83% MRQ |
| Genomsnittlig portföljallokering | 0.4504 % - change of 8,25% MRQ |
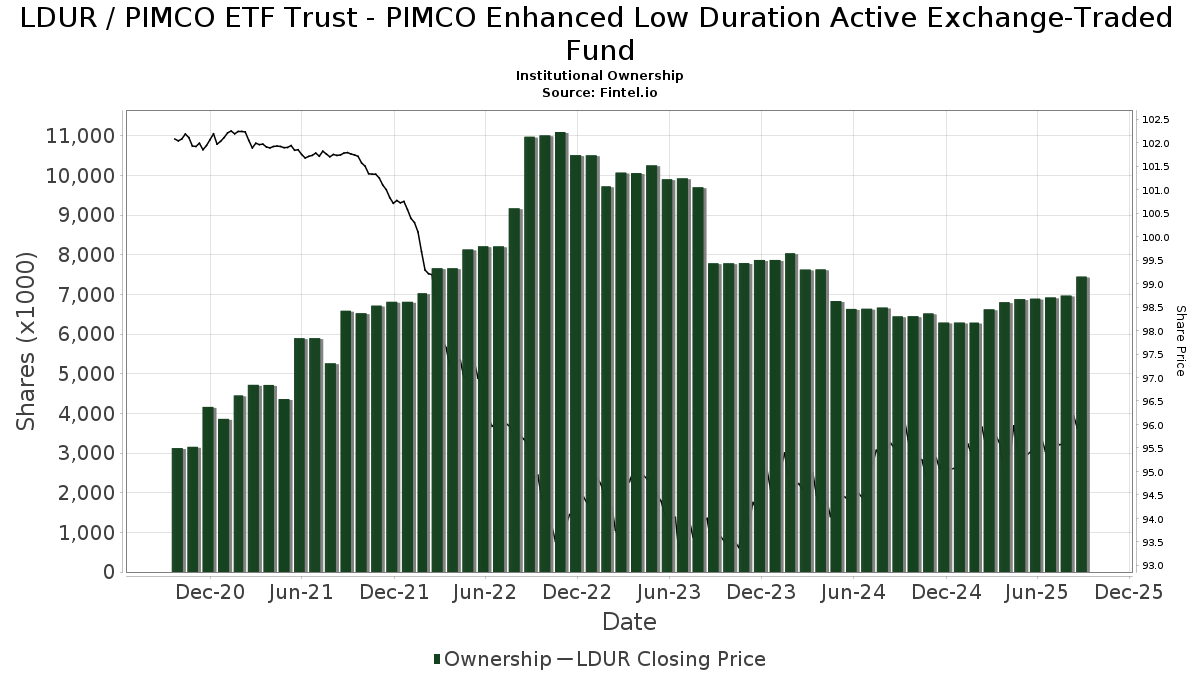
| Institutionella aktier (lång) | 7 449 299 (ex 13D/G) - change of 0,56MM shares 8,08% MRQ |
| Institutionellt värde (lång) | $ 611 839 USD ($1000) |
Institutionellt ägande och aktieägare
PIMCO ETF Trust - PIMCO Enhanced Low Duration Active Exchange-Traded Fund (US:LDUR) har 160 Institutionella ägare och aktieägare som har lämnat in 13D/G- eller 13F-formulär till Securities Exchange Commission (SEC). Dessa institut innehar totalt 7,449,299 aktier. Största aktieägare inkluderar Cwm, Llc, Wells Fargo & Company/mn, Advocacy Wealth Management Services, LLC, TD Capital Management LLC, LPL Financial LLC, Bank Of America Corp /de/, Morgan Stanley, Jpmorgan Chase & Co, Kelly Financial Group Llc, and O'Connor Financial Group LLC .
PIMCO ETF Trust - PIMCO Enhanced Low Duration Active Exchange-Traded Fund (ARCA:LDUR) Institutionell ägarstruktur visar institutioners och fonders nuvarande positioner i företaget, samt de senaste förändringarna i positionernas storlek. Större aktieägare kan vara enskilda investerare, fonder, hedgefonder eller institutioner. Bilaga 13D visar att investeraren äger (eller ägde) mer än 5% av företaget och avser (eller avsåg) att aktivt eftersträva en förändring av affärsstrategin. Schedule 13G indikerar en passiv investering på över 5%.
The share price as of September 17, 2025 is 96,15 / share. Previously, on September 18, 2024, the share price was 95,84 / share. This represents an increase of 0,32% over that period.
Fondsentimentets poäng
Fondsentimentet poängen(fka Ägarackumulation-poäng) visar vilka aktier som är mest köpta av fonder. Det är resultatet av en sofistikerad kvantitativ flerfaktormodell som identifierar företag med de högsta nivåerna av institutionell ackumulering. Poängsättningsmodellen använder en kombination av den totala ökningen av redovisade ägare, förändringarna i portföljallokeringarna för dessa ägare och andra mått. Siffran sträcker sig från 0 till 100, där högre siffror indikerar en högre nivå av ackumulering i förhållande till sina konkurrenter, och 50 är genomsnittet.
Uppdateringsfrekvens: Dagligen
Se Ownership Explorer, som innehåller en lista över de högst rankade företagen.
Institutionell sälj/köp-kvot
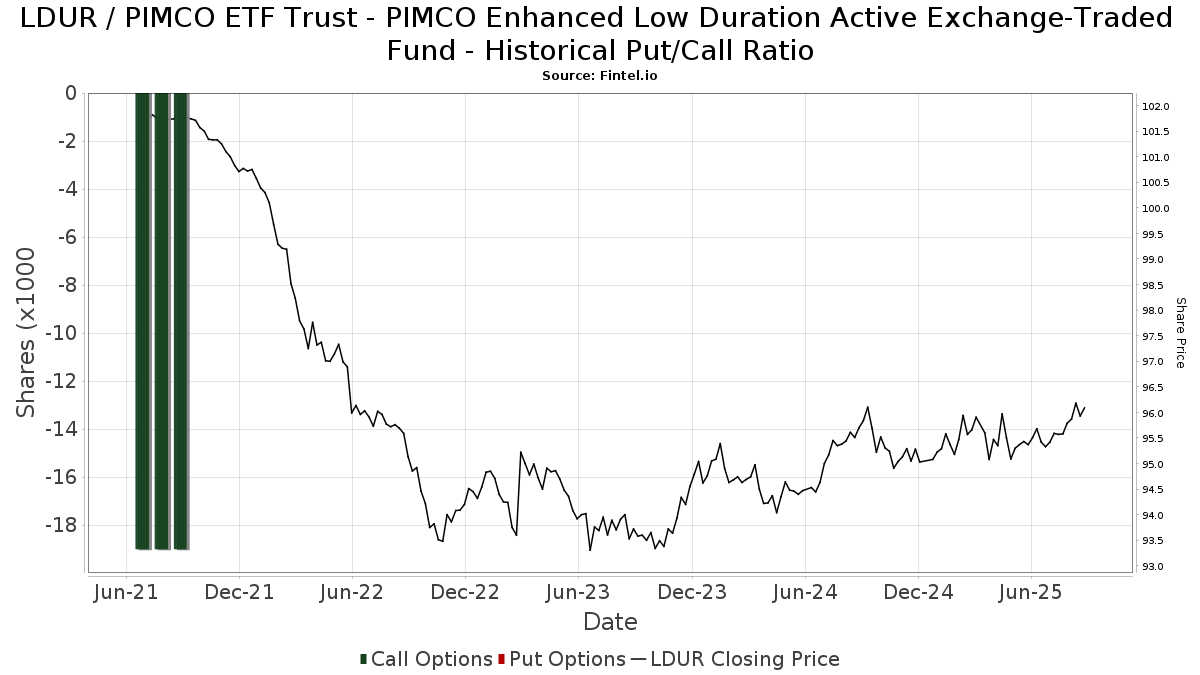
Förutom att rapportera vanliga eget kapital- och skuldemissioner måste institutioner med mer än 100MM tillgångar under förvaltning också avslöja sina innehav av sälj- och köpoptioner. Eftersom säljoptioner i allmänhet indikerar ett negativt sentiment och köpoptioner indikerar ett positivt sentiment, kan vi få en uppfattning om det övergripande institutionella sentimentet genom att plotta förhållandet mellan säljoptioner och köpoptioner. Diagrammet till höger visar det historiska förhållandet mellan sälj- och köpoptioner för detta instrument.
Genom att använda sälj/köp-kvoten som en indikator på aktieägarnas sentiment undviker man en av de största bristerna med att använda det totala institutionella ägandet, nämligen att en betydande del av de förvaltade tillgångarna investeras passivt för att följa index. Passivt förvaltade fonder köper vanligtvis inte optioner, så indikatorn för sälj/köp-kvoten ger en bättre bild av stämningen i aktivt förvaltade fonder.
13F- och NPORT-arkiveringar
Detaljer om 13F-arkiveringar är gratis. Detaljer om NP-arkiveringar kräver ett premiummedlemskap. Gröna rader indikerar nya positioner. Röda rader indikerar stängda positioner. Klicka på länk symbolen för att se hela transaktionshistoriken.
Uppgradera
för att låsa upp premiumdata och exportera till Excel ![]() .
.
| Fil Datum | Källa | Investerare | Typ | Genomsnittligt pris (beräknat) |
Aktier | Δ Aktier (%) |
Rapporterat värde (1000 USD) |
Δ Värde (%) |
Portföljallokering (%) |
|
|---|---|---|---|---|---|---|---|---|---|---|
| 2025-08-07 | 13F | Resources Investment Advisors, LLC. | 170 588 | 16,00 | 16 347 | 15,82 | ||||
| 2025-07-25 | 13F | Cwm, Llc | 867 095 | −10,32 | 83 | −9,78 | ||||
| 2025-07-28 | 13F | Allianz Asset Management GmbH | 57 | −5,00 | 5 | 0,00 | ||||
| 2025-08-14 | 13F | Treasure Coast Financial Planning | 41 486 | 1,96 | 3 976 | 1,79 | ||||
| 2025-08-08 | 13F | TD Capital Management LLC | 437 042 | 2,11 | 41 882 | 1,95 | ||||
| 2025-08-13 | 13F | Brown Advisory Inc | 37 229 | −5,57 | 3 568 | −5,73 | ||||
| 2025-07-09 | 13F | Krilogy Financial LLC | 11 431 | 0,03 | 1 095 | −0,09 | ||||
| 2025-08-04 | 13F | Assetmark, Inc | 1 027 | 10,79 | 98 | 11,36 | ||||
| 2025-07-25 | 13F | Concurrent Investment Advisors, LLC | 5 423 | 34,80 | 520 | 34,46 | ||||
| 2025-07-18 | 13F | Access Financial Services, Inc. | 0 | −100,00 | 0 | |||||
| 2025-08-14 | 13F | UBS Group AG | 195 891 | 0,70 | 18 772 | 0,55 | ||||
| 2025-07-11 | 13F | Caldwell Securities, Inc | 7 364 | −5,86 | 706 | −6,00 | ||||
| 2025-08-08 | 13F | Cetera Investment Advisers | 17 903 | 26,93 | 1 716 | 26,76 | ||||
| 2025-08-01 | 13F | SYM FINANCIAL Corp | 82 | 0,00 | 8 | 0,00 | ||||
| 2025-08-05 | 13F | Huntington National Bank | 270 | 31,22 | ||||||
| 2025-08-14 | 13F | Great Valley Advisor Group, Inc. | 19 504 | 1 869 | ||||||
| 2025-07-15 | 13F | World Equity Group, Inc. | 2 591 | 248 | ||||||
| 2025-08-14 | 13F | Raymond James Financial Inc | 57 353 | 138,36 | 5 496 | 138,03 | ||||
| 2025-07-31 | 13F | Moloney Securities Asset Management, LLC | 2 584 | 0,00 | 248 | −0,40 | ||||
| 2025-08-14 | 13F | Mml Investors Services, Llc | 3 842 | 14,11 | 0 | |||||
| 2025-08-14 | 13F | Wiley Bros.-aintree Capital, Llc | 9 894 | 948 | ||||||
| 2025-07-17 | 13F | Hanson & Doremus Investment Management | 190 | 0,00 | 0 | |||||
| 2025-08-08 | 13F | Cedar Wealth Management, LLC | 2 270 | −4,22 | 218 | −4,41 | ||||
| 2025-08-12 | 13F | Global Retirement Partners, LLC | 1 529 | 366,16 | 147 | 370,97 | ||||
| 2025-08-07 | 13F | Compass Financial Group, Inc. | 13 216 | −1,67 | 1 266 | −1,86 | ||||
| 2025-05-06 | 13F | Rsm Us Wealth Management Llc | 0 | −100,00 | 0 | |||||
| 2025-07-16 | 13F | BankPlus Wealth Management LLC | 9 011 | 5,68 | 863 | 5,50 | ||||
| 2025-08-14 | 13F | Warren Averett Asset Management, LLC | 12 704 | −5,73 | 1 217 | −5,88 | ||||
| 2025-08-14 | 13F | RMB Capital Management, LLC | 4 915 | 44,81 | 471 | 44,92 | ||||
| 2025-08-07 | 13F | Proficio Capital Partners LLC | 0 | −100,00 | 0 | |||||
| 2025-07-15 | 13F | Charter Capital Management, LLC\DE | 8 192 | 785 | ||||||
| 2025-07-30 | 13F | Capstone Triton Financial Group, LLC | 4 128 | −16,40 | 396 | −15,78 | ||||
| 2025-08-14 | 13F | Bank Of America Corp /de/ | 360 068 | 3,29 | 34 505 | 3,13 | ||||
| 2025-08-13 | 13F | Legacy Capital Wealth Partners, LLC | 18 077 | 29,09 | 1 732 | 28,97 | ||||
| 2025-07-21 | 13F | AIFG Consultants Ltd. | 41 805 | 2,14 | 4 006 | 1,99 | ||||
| 2025-08-12 | 13F | Heritage Trust Co | 0 | −100,00 | 0 | |||||
| 2025-08-14 | 13F | Jane Street Group, Llc | 14 709 | −70,38 | 1 410 | −70,43 | ||||
| 2025-07-16 | 13F | Essex Financial Services, Inc. | 44 380 | 1,43 | 4 253 | 1,26 | ||||
| 2025-08-11 | 13F | Anfield Capital Management, LLC | 3 693 | 0,00 | 354 | −0,28 | ||||
| 2025-08-14 | 13F | Wells Fargo & Company/mn | 648 644 | 121,37 | 62 160 | 121,03 | ||||
| 2025-05-15 | 13F | Williams & Novak, LLC | 0 | −100,00 | 0 | |||||
| 2025-08-07 | 13F | Howard Bailey Securities, Llc | 3 875 | 371 | ||||||
| 2025-04-23 | 13F | Mascagni Wealth Management, Inc. | 0 | −100,00 | 0 | −100,00 | ||||
| 2025-07-31 | 13F | Brinker Capital Investments, LLC | 0 | −100,00 | 0 | −100,00 | ||||
| 2025-07-21 | 13F | Future Financial Wealth Managment LLC | 300 | 0,00 | 29 | 0,00 | ||||
| 2025-08-14 | 13F | Royal Bank Of Canada | 94 473 | −12,17 | 9 053 | −12,29 | ||||
| 2025-05-02 | 13F | Mayflower Financial Advisors, LLC | 0 | −100,00 | 0 | |||||
| 2025-04-21 | 13F | Community Bank, N.A. | 0 | −100,00 | 0 | |||||
| 2025-08-27 | 13F | Barnes Wealth Management Group, Inc | 27 111 | 1,54 | 2 598 | 1,41 | ||||
| 2025-08-13 | 13F | GeoWealth Management, LLC | 18 567 | 62,63 | 1 779 | 62,47 | ||||
| 2025-04-23 | 13F | Chapin Davis, Inc. | 0 | −100,00 | 0 | |||||
| 2025-07-25 | 13F | We Are One Seven, LLC | 33 667 | 39,64 | 3 226 | 39,47 | ||||
| 2025-08-13 | 13F | Continuum Advisory, LLC | 0 | −100,00 | 0 | |||||
| 2025-07-22 | 13F | Valley National Advisers Inc | 47 877 | 2,90 | 5 | 0,00 | ||||
| 2025-07-15 | 13F | Family Investment Center, Inc. | 14 373 | 0,31 | 1 377 | 0,15 | ||||
| 2025-07-30 | 13F | Crewe Advisors LLC | 1 047 | 100 | ||||||
| 2025-08-14 | 13F | Kovitz Investment Group Partners, LLC | 18 954 | −6,58 | 1 816 | −6,73 | ||||
| 2025-08-05 | 13F | Beckerman Institutional, LLC | 65 433 | 2,49 | 6 | 0,00 | ||||
| 2025-08-06 | 13F | AE Wealth Management LLC | 21 030 | 145,16 | 2 015 | 144,84 | ||||
| 2025-07-28 | 13F | Patten & Patten Inc/tn | 20 248 | −6,48 | 1 940 | −6,64 | ||||
| 2025-05-30 | NP | ERNZ - TrueShares Active Yield ETF | 1 329 | 128 | ||||||
| 2025-07-18 | 13F | Astor Investment Management LLC | 185 159 | 150,56 | 17 744 | 150,18 | ||||
| 2025-07-11 | 13F | Farther Finance Advisors, LLC | 16 850 | 41,37 | 1 615 | 41,70 | ||||
| 2025-07-07 | 13F | O'Connor Financial Group LLC | 215 648 | 4,17 | 20 551 | 3,43 | ||||
| 2025-08-15 | 13F | CI Private Wealth, LLC | 10 777 | −29,57 | 1 033 | −29,70 | ||||
| 2025-07-30 | 13F | Nottingham Advisors, Inc. | 2 484 | −2,85 | 238 | −2,86 | ||||
| 2025-08-15 | 13F | Howland Capital Management Llc | 77 974 | 1,21 | 7 472 | 1,05 | ||||
| 2025-09-09 | 13F | NWF Advisory Services Inc. | 7 403 | −1,99 | 709 | −2,07 | ||||
| 2025-08-12 | 13F | Proequities, Inc. | 0 | 0 | ||||||
| 2025-07-30 | 13F | SkyOak Wealth, LLC | 42 926 | 0,98 | 4 114 | 0,83 | ||||
| 2025-04-22 | 13F | Hubbell Strickland Wealth Management, LLC | 0 | −100,00 | 0 | |||||
| 2025-08-05 | 13F | American Institute for Advanced Investment Management, LLP | 4 423 | 0,00 | 424 | −0,24 | ||||
| 2025-08-08 | 13F | Pnc Financial Services Group, Inc. | 51 | 5 | ||||||
| 2025-08-14 | 13F | Win Advisors, Inc | 8 220 | −9,60 | 788 | −9,75 | ||||
| 2025-08-12 | 13F | Bedel Financial Consulting, Inc. | 2 841 | 0,00 | 272 | 0,37 | ||||
| 2025-07-14 | 13F | Opal Wealth Advisors, LLC | 318 | −1,85 | 30 | −3,23 | ||||
| 2025-07-15 | 13F | Signet Financial Management, Llc | 43 130 | 0,16 | 4 133 | 0,02 | ||||
| 2025-08-15 | 13F | Captrust Financial Advisors | 30 245 | −2,56 | 2 898 | −2,72 | ||||
| 2025-08-13 | 13F | Advocacy Wealth Management Services, LLC | 439 985 | 7,40 | 42 164 | 7,23 | ||||
| 2025-07-17 | 13F | Halbert Hargrove Global Advisors, Llc | 5 788 | −6,99 | 555 | −7,20 | ||||
| 2025-07-24 | 13F | IFP Advisors, Inc | 34 168 | 9,56 | 3 274 | 9,39 | ||||
| 2025-05-12 | 13F | Independent Advisor Alliance | 0 | −100,00 | 0 | |||||
| 2025-08-05 | 13F | Sigma Planning Corp | 2 636 | 253 | ||||||
| 2025-08-14 | 13F | Comerica Bank | 6 066 | −24,04 | 581 | −24,15 | ||||
| 2025-04-30 | 13F | Sofos Investments, Inc. | 965 | −38,38 | 93 | −37,84 | ||||
| 2025-08-15 | 13F | Kestra Advisory Services, LLC | 17 969 | 13,35 | 1 722 | 13,15 | ||||
| 2025-08-12 | 13F | OneAscent Financial Services LLC | 9 642 | 113,41 | 1 | |||||
| 2025-07-28 | 13F | Axxcess Wealth Management, Llc | 9 915 | 67,29 | 950 | 67,25 | ||||
| 2025-08-11 | 13F | PAX Financial Group, LLC | 21 635 | −11,69 | 2 073 | −11,82 | ||||
| 2025-07-10 | 13F | Wealth Enhancement Advisory Services, Llc | 209 141 | −1,68 | 19 931 | −2,38 | ||||
| 2025-07-14 | 13F | Legacy Capital Group California, Inc. | 47 302 | 174,34 | 4 533 | 174,00 | ||||
| 2025-08-07 | 13F | PFG Advisors | 26 190 | 2,20 | 2 510 | 2,03 | ||||
| 2025-08-11 | 13F | Outlook Wealth Advisors, LLC | 3 270 | 313 | ||||||
| 2025-07-08 | 13F | Parallel Advisors, LLC | 604 | 0,00 | 58 | 0,00 | ||||
| 2025-08-07 | 13F | Allworth Financial LP | 0 | −100,00 | 0 | |||||
| 2025-08-12 | 13F | Steward Partners Investment Advisory, Llc | 80 | 0,00 | 8 | 0,00 | ||||
| 2025-08-14 | 13F | Mariner, LLC | 0 | −100,00 | 0 | |||||
| 2025-08-08 | 13F | Keyvantage Wealth, Llc | 7 088 | −13,83 | 679 | −13,94 | ||||
| 2025-08-13 | 13F | Mayfair Advisory Group, LLC | 6 202 | −16,76 | 593 | −17,20 | ||||
| 2025-07-15 | 13F | Kelly Financial Group Llc | 249 893 | 0,60 | 23 947 | 0,45 | ||||
| 2025-08-01 | 13F | Envestnet Asset Management Inc | 213 441 | 92,49 | 20 454 | 92,20 | ||||
| 2025-07-22 | 13F | DAVENPORT & Co LLC | 8 164 | 119,76 | 782 | 119,66 | ||||
| 2025-08-12 | 13F | Accredited Wealth Management, LLC | 5 518 | 16,96 | 529 | 16,81 | ||||
| 2025-08-12 | 13F | SRS Capital Advisors, Inc. | 793 | 435,81 | 76 | 435,71 | ||||
| 2025-08-13 | 13F | Congress Wealth Management LLC / DE / | 10 558 | 0,00 | 1 012 | −0,10 | ||||
| 2025-08-05 | 13F | Key FInancial Inc | 170 | −42,76 | 16 | −42,86 | ||||
| 2025-08-14 | 13F | Susquehanna International Group, Llp | 4 237 | −76,50 | 406 | −76,53 | ||||
| 2025-08-11 | 13F | Synergy Investment Management, LLC | 0 | −100,00 | 0 | |||||
| 2025-08-13 | 13F | EverSource Wealth Advisors, LLC | 1 079 | −38,45 | 103 | −38,69 | ||||
| 2025-07-31 | 13F | Cambridge Investment Research Advisors, Inc. | 8 056 | 55,67 | 1 | |||||
| 2025-08-05 | 13F | Aviance Capital Partners, LLC | 7 973 | −12,12 | 764 | −12,18 | ||||
| 2025-08-13 | 13F | Tobias Financial Advisors, Inc. | 2 594 | 1,09 | 249 | 0,81 | ||||
| 2025-07-28 | 13F | Smart Portfolios, LLC | 8 116 | −1,72 | 778 | −1,89 | ||||
| 2025-08-13 | 13F | Capital Analysts, Inc. | 9 | 0 | ||||||
| 2025-08-14 | 13F | Citadel Advisors Llc | 26 289 | −68,84 | 2 519 | −68,89 | ||||
| 2025-07-21 | 13F | Ameritas Advisory Services, LLC | 29 | 3 | ||||||
| 2025-08-13 | 13F | Flow Traders U.s. Llc | 12 670 | 6,69 | 1 | 0,00 | ||||
| 2025-08-06 | 13F | Commonwealth Equity Services, Llc | 42 809 | 85,79 | 4 | 100,00 | ||||
| 2025-08-05 | 13F | Bank of New York Mellon Corp | 5 733 | 137,79 | 549 | 137,66 | ||||
| 2025-07-25 | 13F | NorthRock Partners, LLC | 0 | −100,00 | 0 | |||||
| 2025-08-14 | 13F | GWM Advisors LLC | 23 239 | −2,55 | 2 227 | −2,71 | ||||
| 2025-07-24 | 13F | CarsonAllaria Wealth Management, Ltd. | 50 293 | 3,01 | 4 820 | 2,86 | ||||
| 2025-08-14 | 13F | Aqr Capital Management Llc | 0 | −100,00 | 0 | |||||
| 2025-08-12 | 13F | LPL Financial LLC | 402 662 | 6,36 | 38 587 | 6,20 | ||||
| 2025-08-14 | 13F | Ausdal Financial Partners, Inc. | 4 866 | −0,45 | 466 | −0,64 | ||||
| 2025-08-18 | 13F/A | Kestra Investment Management, LLC | 2 230 | 214 | ||||||
| 2025-07-09 | 13F | Dynamic Advisor Solutions LLC | 98 192 | 1,02 | 9 410 | 0,87 | ||||
| 2025-07-29 | 13F | Signature Estate & Investment Advisors Llc | 4 805 | 0,19 | 460 | 0,00 | ||||
| 2025-07-28 | 13F | Harbour Investments, Inc. | 898 | −45,11 | 86 | −44,87 | ||||
| 2025-07-30 | 13F | Greatmark Investment Partners, Inc. | 13 727 | −28,94 | 1 315 | −29,03 | ||||
| 2025-08-13 | 13F | Russell Investments Group, Ltd. | 0 | −100,00 | 0 | |||||
| 2025-07-24 | 13F | Capital Advisors, Ltd. LLC | 5 057 | 0,30 | 0 | |||||
| 2025-08-08 | 13F | Avantax Advisory Services, Inc. | 20 312 | −0,06 | 1 946 | −0,21 | ||||
| 2025-08-14 | 13F | Sand Hill Global Advisors, LLC | 12 966 | 1 243 | ||||||
| 2025-07-25 | 13F | Sequoia Financial Advisors, LLC | 2 838 | −56,79 | 272 | −56,98 | ||||
| 2025-08-12 | 13F | Change Path, LLC | 23 923 | 37,85 | 2 293 | 37,66 | ||||
| 2025-07-15 | 13F | Financial Management Professionals, Inc. | 811 | 0,00 | 78 | 0,00 | ||||
| 2025-06-30 | NP | ASTIX - Astor Dynamic Allocation Fund Class I shares | 31 508 | 3 024 | ||||||
| 2025-08-14 | 13F | IPG Investment Advisors LLC | 2 743 | 0,00 | 263 | −0,38 | ||||
| 2025-08-12 | 13F | Jpmorgan Chase & Co | 250 872 | 4,00 | 24 041 | 3,84 | ||||
| 2025-08-05 | 13F | Bank Of Montreal /can/ | 462 | 0,00 | 44 | 0,00 | ||||
| 2025-05-01 | 13F | Quest 10 Wealth Builders, Inc. | 229 | 22 | ||||||
| 2025-08-11 | 13F | Citigroup Inc | 2 122 | −0,61 | 203 | −0,49 | ||||
| 2025-07-30 | 13F | Wbh Advisory Inc | 2 529 | −19,92 | 242 | −20,13 | ||||
| 2025-05-13 | 13F | Watts Gwilliam & Co., LLC | 2 669 | −8,97 | 256 | −7,91 | ||||
| 2025-08-08 | 13F | Financial Gravity Companies, Inc. | 933 | −3,32 | 89 | −2,20 | ||||
| 2025-08-19 | 13F | Advisory Services Network, LLC | 9 120 | 43,13 | 872 | 42,72 | ||||
| 2025-05-15 | 13F | Tower Research Capital LLC (TRC) | 0 | −100,00 | 0 | |||||
| 2025-08-18 | 13F | Geneos Wealth Management Inc. | 3 464 | 86,64 | 332 | 85,96 | ||||
| 2025-07-24 | 13F | Reuter James Wealth Management, Llc | 3 555 | 60,21 | 341 | 60,38 | ||||
| 2025-08-12 | 13F | Financial Advocates Investment Management | 0 | −100,00 | 0 | |||||
| 2025-07-28 | 13F | CGC Financial Services, LLC | 2 885 | −8,85 | 276 | −8,91 | ||||
| 2025-08-06 | 13F | Prospera Financial Services Inc | 8 472 | −2,45 | 813 | −2,52 | ||||
| 2025-07-28 | 13F | Morris Financial Concepts, Inc. | 245 | −5,77 | 23 | −4,17 | ||||
| 2025-07-28 | 13F | RFG Advisory, LLC | 30 045 | 9,39 | 2 879 | 9,22 | ||||
| 2025-05-05 | 13F | Transce3nd, LLC | 0 | −100,00 | 0 | |||||
| 2025-07-08 | 13F | First National Corp /ma/ /adv | 93 703 | 5,65 | 8 980 | 5,49 | ||||
| 2025-07-21 | 13F | Ameriflex Group, Inc. | 5 395 | 10,12 | 516 | 9,79 | ||||
| 2025-08-13 | 13F | Jones Financial Companies Lllp | 3 216 | 277,02 | 308 | 280,25 | ||||
| 2025-07-25 | 13F | Means Investment Co., Inc. | 0 | −100,00 | 0 | |||||
| 2025-07-01 | 13F | Burkett Financial Services, Llc | 0 | −100,00 | 0 | |||||
| 2025-05-02 | 13F | Cullen/frost Bankers, Inc. | 0 | −100,00 | 0 | |||||
| 2025-07-17 | 13F | Raleigh Capital Management Inc. | 3 774 | 139,77 | 362 | 139,07 | ||||
| 2025-07-23 | 13F | Clear Creek Financial Management, LLC | 26 607 | −6,47 | 2 550 | −6,63 | ||||
| 2025-07-22 | 13F | Wealthcare Advisory Partners LLC | 8 736 | 12,72 | 837 | 12,65 | ||||
| 2025-08-14 | 13F | Mercer Global Advisors Inc /adv | 9 425 | −2,40 | 903 | −2,48 | ||||
| 2025-05-14 | 13F | Valley Financial Group, Inc. | 0 | −100,00 | 0 | |||||
| 2025-08-14 | 13F | Stifel Financial Corp | 13 310 | −10,74 | 1 275 | −10,90 | ||||
| 2025-07-17 | 13F | Wagner Wealth Management, Llc | 1 | 0,00 | 0 | |||||
| 2025-08-04 | 13F | Syverson Strege & Co | 13 063 | 3,06 | 1 252 | 2,88 | ||||
| 2025-07-16 | 13F | Lloyd Advisory Services, LLC. | 3 289 | 315 | ||||||
| 2025-07-09 | 13F | Procyon Private Wealth Partners, LLC | 3 270 | −60,86 | 313 | −60,92 | ||||
| 2025-08-01 | 13F | Austin Private Wealth, LLC | 6 543 | −72,96 | 627 | −73,00 | ||||
| 2025-08-04 | 13F | Clear Investment Research, Llc | 2 104 | −2,77 | 202 | −2,90 | ||||
| 2025-08-04 | 13F | Atria Investments Llc | 63 999 | 149,31 | 6 133 | 149,01 | ||||
| 2025-04-21 | 13F | ORG Partners LLC | 0 | −100,00 | 0 | |||||
| 2025-05-09 | 13F | TD Waterhouse Canada Inc. | 0 | −100,00 | 0 | |||||
| 2025-04-21 | 13F | Nelson, Van Denburg & Campbell Wealth Management Group, LLC | 0 | −100,00 | 0 | |||||
| 2025-08-06 | 13F | Mark Sheptoff Financial Planning, Llc | 75 | 0,00 | 7 | 0,00 | ||||
| 2025-07-29 | 13F | Stephens Inc /ar/ | 6 125 | −2,42 | 587 | −2,66 | ||||
| 2025-08-07 | 13F | 49 Wealth Management, Llc | 0 | −100,00 | 0 | |||||
| 2025-09-04 | 13F/A | Advisor Group Holdings, Inc. | 49 756 | 76,50 | 4 774 | 76,06 | ||||
| 2025-08-13 | 13F | Avestar Capital, LLC | 17 090 | 2,00 | 1 638 | 1,80 | ||||
| 2025-07-11 | 13F | Diversified Trust Co | 3 266 | 3,85 | 313 | 3,99 | ||||
| 2025-07-15 | 13F | FLP Wealth Management, LLC | 0 | −100,00 | 0 | |||||
| 2025-08-14 | 13F | Integrated Wealth Concepts LLC | 23 707 | −3,15 | 2 272 | −3,32 | ||||
| 2025-07-07 | 13F | Capital Asset Advisory Services LLC | 3 575 | 1,94 | 341 | 1,79 | ||||
| 2025-07-28 | 13F | JGP Wealth Management, LLC | 6 380 | 611 | ||||||
| 2025-08-11 | 13F | HighTower Advisors, LLC | 131 354 | 3,29 | 12 588 | 3,13 | ||||
| 2025-08-12 | 13F | MAI Capital Management | 23 | 0,00 | 2 | 0,00 | ||||
| 2025-08-15 | 13F | Morgan Stanley | 354 441 | 7,12 | 33 966 | 6,96 | ||||
| 2025-07-11 | 13F | Skyline Advisors, Inc. | 3 201 | −10,36 | 307 | −10,53 | ||||
| 2025-04-09 | 13F | Milestone Asset Management, Llc | 0 | −100,00 | 0 | −100,00 | ||||
| 2025-04-29 | 13F | Vickerman Investment Advisors, Inc. | 0 | −100,00 | 0 | |||||
| 2025-07-14 | 13F | AdvisorNet Financial, Inc | 0 | −100,00 | 0 | |||||
| 2025-07-17 | 13F | Sage Rhino Capital Llc | 25 772 | −10,30 | 2 470 | −10,45 |