Grundläggande statistik
| Institutionella ägare | 253 total, 253 long only, 0 short only, 0 long/short - change of 18,69% MRQ |
| Genomsnittlig portföljallokering | 1.3999 % - change of −10,02% MRQ |
| Institutionella aktier (lång) | 160 284 535 (ex 13D/G) - change of 1,41MM shares 0,89% MRQ |
| Institutionellt värde (lång) | $ 10 884 234 USD ($1000) |
Institutionellt ägande och aktieägare
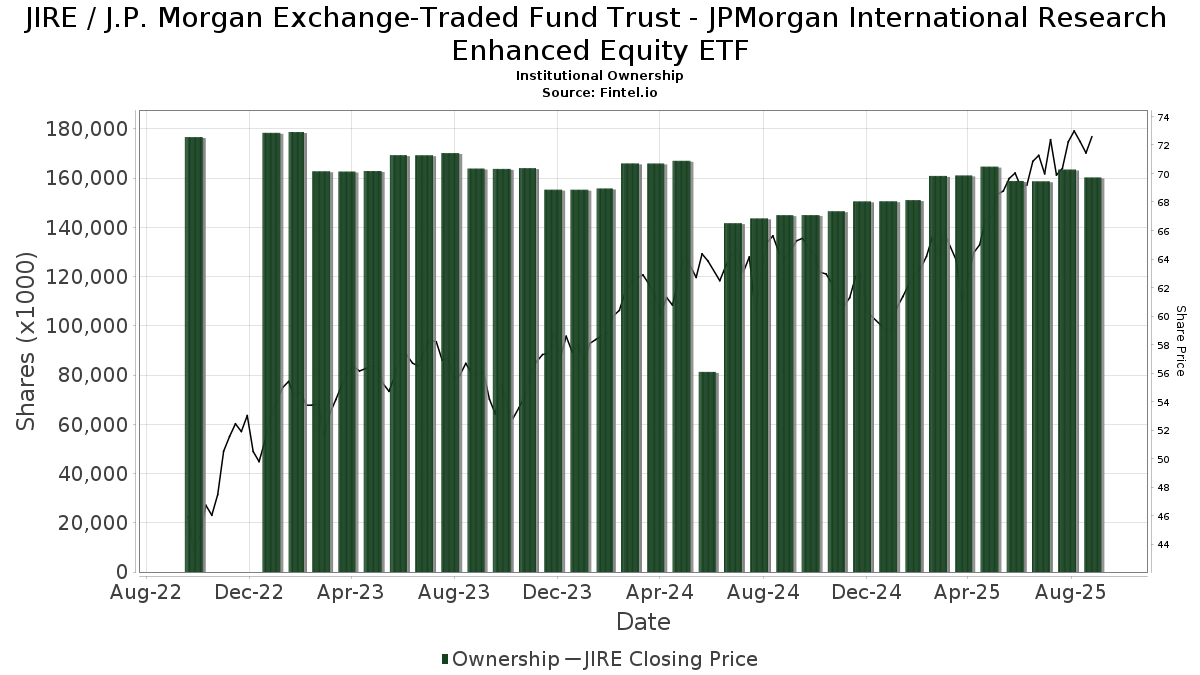
J.P. Morgan Exchange-Traded Fund Trust - JPMorgan International Research Enhanced Equity ETF (US:JIRE) har 253 Institutionella ägare och aktieägare som har lämnat in 13D/G- eller 13F-formulär till Securities Exchange Commission (SEC). Dessa institut innehar totalt 160,284,535 aktier. Största aktieägare inkluderar Jpmorgan Chase & Co, ONIFX - JPMorgan Investor Growth Fund Class I, SMTAX - JPMorgan SmartRetirement 2040 Fund Class A, SRJAX - JPMorgan SmartRetirement 2035 Fund Class A, JSACX - JPMorgan SmartRetirement 2045 Fund Class C, JTSAX - JPMorgan SmartRetirement 2050 Fund Class A, JSMAX - JPMorgan SmartRetirement 2030 Fund Class A, OIBFX - JPMorgan Investor Balanced Fund Class I, LPL Financial LLC, and ONGFX - JPMorgan Investor Growth & Income Fund Class I .
J.P. Morgan Exchange-Traded Fund Trust - JPMorgan International Research Enhanced Equity ETF (ARCA:JIRE) Institutionell ägarstruktur visar institutioners och fonders nuvarande positioner i företaget, samt de senaste förändringarna i positionernas storlek. Större aktieägare kan vara enskilda investerare, fonder, hedgefonder eller institutioner. Bilaga 13D visar att investeraren äger (eller ägde) mer än 5% av företaget och avser (eller avsåg) att aktivt eftersträva en förändring av affärsstrategin. Schedule 13G indikerar en passiv investering på över 5%.
The share price as of September 12, 2025 is 73,07 / share. Previously, on September 16, 2024, the share price was 65,12 / share. This represents an increase of 12,21% over that period.
Fondsentimentets poäng
Fondsentimentet poängen(fka Ägarackumulation-poäng) visar vilka aktier som är mest köpta av fonder. Det är resultatet av en sofistikerad kvantitativ flerfaktormodell som identifierar företag med de högsta nivåerna av institutionell ackumulering. Poängsättningsmodellen använder en kombination av den totala ökningen av redovisade ägare, förändringarna i portföljallokeringarna för dessa ägare och andra mått. Siffran sträcker sig från 0 till 100, där högre siffror indikerar en högre nivå av ackumulering i förhållande till sina konkurrenter, och 50 är genomsnittet.
Uppdateringsfrekvens: Dagligen
Se Ownership Explorer, som innehåller en lista över de högst rankade företagen.
Institutionell sälj/köp-kvot
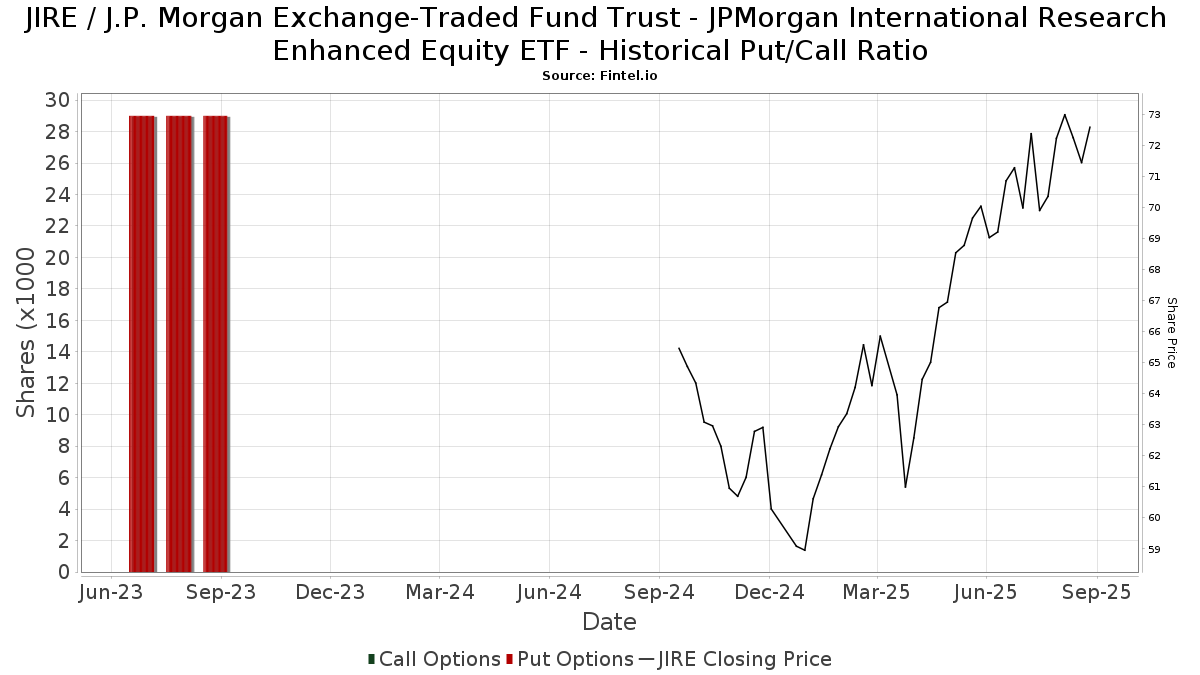
Förutom att rapportera vanliga eget kapital- och skuldemissioner måste institutioner med mer än 100MM tillgångar under förvaltning också avslöja sina innehav av sälj- och köpoptioner. Eftersom säljoptioner i allmänhet indikerar ett negativt sentiment och köpoptioner indikerar ett positivt sentiment, kan vi få en uppfattning om det övergripande institutionella sentimentet genom att plotta förhållandet mellan säljoptioner och köpoptioner. Diagrammet till höger visar det historiska förhållandet mellan sälj- och köpoptioner för detta instrument.
Genom att använda sälj/köp-kvoten som en indikator på aktieägarnas sentiment undviker man en av de största bristerna med att använda det totala institutionella ägandet, nämligen att en betydande del av de förvaltade tillgångarna investeras passivt för att följa index. Passivt förvaltade fonder köper vanligtvis inte optioner, så indikatorn för sälj/köp-kvoten ger en bättre bild av stämningen i aktivt förvaltade fonder.
13D/G-Arkiveringar
Vi presenterar 13D/G-arkiveringar separat från 13F-arkiveringar på grund av att de behandlas olika av SEC. 13D/G-arkiveringar kan lämnas in av grupper av investerare (med en ledare), medan 13F-arkiveringar inte kan det. Detta leder till situationer där en investerare kan lämna in en 13D/G-ansökan med ett värde för de totala aktierna (vilket motsvarar alla aktier som ägs av investerargruppen), men sedan lämna in en 13F-ansökan med ett annat värde för de totala aktierna (vilket motsvarar enbart deras eget ägande). Detta innebär att aktieägandet i 13D/G-arkiveringar och 13F-arkiveringar ofta inte är direkt jämförbara, så vi presenterar dem separat.
Notera: Från och med den 16 maj 2021 visar vi inte längre ägare som inte har lämnat in en 13D/G under det senaste året. Tidigare visade vi hela historiken för 13D/G-arkiveringar. I allmänhet måste enheter som är skyldiga att lämna in 13D/G-arkiveringar lämna in minst en gång per år innan de lämnar in en stängningsarkivering. Fonder avslutar dock ibland positioner utan att lämna in en avslutande arkivering (dvs. de avvecklar), så att visa hela historiken resulterade ibland i förvirring om det nuvarande ägandet. För att förhindra förvirring visar vi nu endast "nuvarande" ägare - det vill säga ägare som har lämnat in en ansökan under det senaste året.
Upgrade to unlock premium data.
13F- och NPORT-arkiveringar
Detaljer om 13F-arkiveringar är gratis. Detaljer om NP-arkiveringar kräver ett premiummedlemskap. Gröna rader indikerar nya positioner. Röda rader indikerar stängda positioner. Klicka på länk symbolen för att se hela transaktionshistoriken.
Uppgradera
för att låsa upp premiumdata och exportera till Excel ![]() .
.
| Fil Datum | Källa | Investerare | Typ | Genomsnittligt pris (beräknat) |
Aktier | Δ Aktier (%) |
Rapporterat värde (1000 USD) |
Δ Värde (%) |
Portföljallokering (%) |
|
|---|---|---|---|---|---|---|---|---|---|---|
| 2025-08-11 | 13F | Principal Securities, Inc. | 254 | 27,00 | 18 | 54,55 | ||||
| 2025-07-18 | 13F | Truist Financial Corp | 3 823 | −0,47 | 271 | 10,66 | ||||
| 2025-08-11 | 13F | Semus Wealth Partners LLC | 3 795 | 18,56 | 269 | 32,02 | ||||
| 2025-08-12 | 13F | Allen Capital Group, LLC | 3 154 | 223 | ||||||
| 2025-05-12 | 13F | C2P Capital Advisory Group, LLC d.b.a. Prosperity Capital Advisors | 0 | −100,00 | 0 | −100,00 | ||||
| 2025-08-06 | 13F | First Horizon Advisors, Inc. | 137 418 | −4,70 | 9 725 | 5,84 | ||||
| 2025-07-21 | 13F | Fairvoy Private Wealth, LLC | 5 410 | 3,76 | 383 | 15,06 | ||||
| 2025-08-13 | 13F | Gateway Wealth Partners, LLC | 4 733 | −18,87 | 335 | −9,97 | ||||
| 2025-07-16 | 13F | Badgley Phelps Wealth Managers, LLC | 264 030 | 18 685 | ||||||
| 2025-08-08 | 13F | Advyzon Investment Management, LLC | 3 207 | 227 | ||||||
| 2025-08-12 | 13F | Wayfinding Financial, LLC | 12 087 | 16,40 | 1 | |||||
| 2025-07-16 | 13F | Register Financial Advisors LLC | 73 | 0,00 | 5 | 25,00 | ||||
| 2025-07-31 | 13F | MN Wealth Advisors, LLC | 105 407 | 19,07 | 7 460 | 32,25 | ||||
| 2025-04-23 | 13F | Mascagni Wealth Management, Inc. | 0 | −100,00 | 0 | −100,00 | ||||
| 2025-07-08 | 13F | Choice Wealth Advisors, LLC | 301 176 | −2,57 | 21 314 | 8,21 | ||||
| 2025-07-16 | 13F | EdgeRock Capital LLC | 185 366 | 54,56 | 13 127 | 71,76 | ||||
| 2025-08-04 | 13F | Atria Investments Llc | 6 083 | 430 | ||||||
| 2025-08-12 | 13F | Tradition Wealth Management, LLC | 214 776 | 2,32 | 15 200 | 13,64 | ||||
| 2025-07-23 | 13F | New England Professional Planning Group Inc. | 768 955 | −0,05 | 54 419 | 11,01 | ||||
| 2025-08-13 | 13F | Transce3nd, LLC | 83 | 6 | ||||||
| 2025-07-08 | 13F | Richard P Slaughter Associates Inc | 726 790 | 15,90 | 51 435 | 28,73 | ||||
| 2025-07-22 | 13F | BridgePort Financial Solutions, LLC | 70 140 | 308,91 | 4 964 | 354,49 | ||||
| 2025-08-04 | 13F | IFG Advisory, LLC | 4 700 | 4,82 | 333 | 16,49 | ||||
| 2025-08-14 | 13F | Garden State Investment Advisory Services LLC | 60 587 | −2,71 | 4 289 | 8,06 | ||||
| 2025-07-21 | 13F | Sterling Investment Counsel, LLC | 3 898 | 18,70 | 276 | 31,58 | ||||
| 2025-07-28 | 13F | Mutual Advisors, LLC | 28 341 | 4,06 | 2 027 | 13,63 | ||||
| 2025-07-30 | 13F | Parcion Private Wealth LLC | 26 473 | −1,12 | 1 873 | 9,85 | ||||
| 2025-08-12 | 13F | Jpmorgan Chase & Co | 59 920 846 | −3,70 | 4 240 598 | 6,96 | ||||
| 2025-08-14 | 13F | Atomi Financial Group, Inc. | 16 214 | 1 147 | ||||||
| 2025-07-09 | 13F | VisionPoint Advisory Group, LLC | 21 998 | 1 557 | ||||||
| 2025-07-28 | 13F | Cutler Investment Counsel Llc | 419 687 | 8,37 | 29 701 | 20,36 | ||||
| 2025-08-26 | NP | JFFAX - JPMorgan SmartRetirement 2055 Fund Class A | 3 657 529 | −6,32 | 258 843 | 4,05 | ||||
| 2025-07-31 | 13F | West Michigan Advisors, Llc | 64 506 | 0,35 | 4 565 | 11,45 | ||||
| 2025-07-24 | 13F | Etesian Wealth Advisors, Inc. | 78 431 | 25,74 | 5 551 | 39,66 | ||||
| 2025-07-24 | 13F | Ronald Blue Trust, Inc. | 421 | 30 | ||||||
| 2025-07-23 | 13F | Bellevue Asset Management, Llc | 60 864 | −1,17 | 4 307 | 9,76 | ||||
| 2025-08-08 | 13F | Tiemann Investment Advisors, Llc | 7 115 | 77,21 | 504 | 97,25 | ||||
| 2025-08-05 | 13F | GPS Wealth Strategies Group, LLC | 8 | 0,00 | 1 | |||||
| 2025-08-13 | 13F | GeoWealth Management, LLC | 5 912 | 45,29 | 418 | 61,39 | ||||
| 2025-07-25 | 13F | Envestnet Portfolio Solutions, Inc. | 5 992 | −59,61 | 424 | −55,13 | ||||
| 2025-08-08 | 13F | Kingsview Wealth Management, LLC | 77 167 | 1 425,94 | 5 461 | 1 595,96 | ||||
| 2025-07-21 | 13F | Ascent Group, LLC | 13 500 | 11,27 | 955 | 23,54 | ||||
| 2025-08-14 | 13F | Bank Of America Corp /de/ | 8 210 | −81,42 | 581 | −79,35 | ||||
| 2025-08-05 | 13F | Bank of New York Mellon Corp | 1 087 220 | 0,62 | 76 943 | 11,75 | ||||
| 2025-08-12 | 13F | Proequities, Inc. | 0 | 0 | ||||||
| 2025-08-13 | 13F | Cary Street Partners Financial Llc | 4 858 | 344 | ||||||
| 2025-08-18 | 13F | Geneos Wealth Management Inc. | 26 047 | 2,74 | 1 843 | 14,12 | ||||
| 2025-08-26 | NP | JNSAX - JPMorgan SmartRetirement 2025 Fund Class A | 2 185 868 | −17,63 | 154 694 | −8,52 | ||||
| 2025-07-24 | 13F | Galvin, Gaustad & Stein, LLC | 48 867 | 55,31 | 3 458 | 72,55 | ||||
| 2025-08-04 | 13F | Assetmark, Inc | 1 704 525 | 12,74 | 120 629 | 25,21 | ||||
| 2025-08-12 | 13F | Integras Partners LLC | 11 660 | 2,68 | 825 | 14,11 | ||||
| 2025-08-13 | 13F | Level Four Advisory Services, Llc | 450 142 | 3,01 | 31 857 | 14,41 | ||||
| 2025-07-30 | 13F | Southern Farm Bureau Life Insurance | 322 180 | 0,00 | 23 | 10,00 | ||||
| 2025-08-14 | 13F | Qube Research & Technologies Ltd | 67 | 34,00 | 5 | 33,33 | ||||
| 2025-07-09 | 13F | Goelzer Investment Management, Inc. | 4 343 | 0,00 | 307 | 11,23 | ||||
| 2025-07-15 | 13F | Family Investment Center, Inc. | 310 510 | −4,19 | 21 975 | 6,41 | ||||
| 2025-07-10 | 13F | Marshall Financial Group LLC | 20 158 | −10,98 | 1 408 | −2,36 | ||||
| 2025-07-09 | 13F | Pallas Capital Advisors LLC | 351 234 | 39,64 | 24 857 | 55,09 | ||||
| 2025-07-28 | 13F | Axxcess Wealth Management, Llc | 6 037 | 427 | ||||||
| 2025-08-15 | 13F | Provenance Wealth Advisors, LLC | 0 | −100,00 | 0 | −100,00 | ||||
| 2025-08-19 | 13F | Newbridge Financial Services Group, Inc. | 0 | −100,00 | 0 | |||||
| 2025-07-14 | 13F | U.S. Capital Wealth Advisors, LLC | 61 135 | 12,20 | 4 327 | 24,63 | ||||
| 2025-08-13 | 13F | Renaissance Technologies Llc | 10 100 | 715 | ||||||
| 2025-05-15 | 13F | Citadel Advisors Llc | Call | 0 | −100,00 | 0 | −100,00 | |||
| 2025-08-11 | 13F | Private Advisor Group, LLC | 759 327 | 7,92 | 53 738 | 19,86 | ||||
| 2025-07-24 | 13F | Leo Wealth, LLC | 290 730 | 46,66 | 20 602 | 63,11 | ||||
| 2025-08-15 | 13F | Kestra Advisory Services, LLC | 16 330 | 47,13 | 1 156 | 63,37 | ||||
| 2025-08-26 | NP | JSMAX - JPMorgan SmartRetirement 2030 Fund Class A | 4 837 717 | −11,24 | 342 365 | −1,42 | ||||
| 2025-05-13 | 13F | Bank Of Montreal /can/ | 0 | −100,00 | 0 | |||||
| 2025-07-18 | 13F | Cooper Financial Group | 8 864 | 3,55 | 627 | 15,05 | ||||
| 2025-07-30 | 13F | LGT Financial Advisors LLC | 128 | 23,08 | 9 | 50,00 | ||||
| 2025-07-18 | 13F | Pure Financial Advisors, Inc. | 676 057 | −1,39 | 47 845 | 9,52 | ||||
| 2025-04-11 | 13F | Summit Investment Advisory Services, LLC | 0 | −100,00 | 0 | −100,00 | ||||
| 2025-07-22 | 13F | Firethorn Wealth Partners, Llc | 6 676 | 40,61 | 472 | 56,29 | ||||
| 2025-08-12 | 13F | Change Path, LLC | 29 948 | 26,55 | 2 119 | 40,61 | ||||
| 2025-07-28 | 13F | ForthRight Wealth Management, LLC | 78 919 | 5 585 | ||||||
| 2025-08-15 | 13F | Morgan Stanley | 284 814 | −83,68 | 20 156 | −81,88 | ||||
| 2025-08-26 | NP | OIBFX - JPMorgan Investor Balanced Fund Class I | 4 336 934 | −9,58 | 306 925 | 0,42 | ||||
| 2025-08-06 | 13F | AE Wealth Management LLC | 279 | −30,42 | 20 | −24,00 | ||||
| 2025-08-12 | 13F | Steward Partners Investment Advisory, Llc | 7 833 | 335,17 | 554 | 385,96 | ||||
| 2025-05-13 | 13F | UBS Group AG | 0 | −100,00 | 0 | −100,00 | ||||
| 2025-08-14 | 13F | IHT Wealth Management, LLC | 49 543 | 3 506 | ||||||
| 2025-04-29 | 13F | Element Wealth, LLC | 0 | −100,00 | 0 | |||||
| 2025-07-09 | 13F | Massmutual Trust Co Fsb/adv | 20 823 | 22,73 | 1 474 | 36,26 | ||||
| 2025-08-04 | 13F | Creative Financial Designs Inc /adv | 40 017 | −3,55 | 2 832 | 7,15 | ||||
| 2025-07-11 | 13F | SILVER OAK SECURITIES, Inc | 42 713 | 3,33 | 3 023 | 13,52 | ||||
| 2025-08-27 | NP | JNL SERIES TRUST - JNL iShares Tactical Moderate Fund (A) | 153 802 | −0,03 | 10 885 | 11,04 | ||||
| 2025-07-10 | 13F | Family Legacy Financial Solutions, LLC | 119 | 8 | ||||||
| 2025-08-14 | 13F | Stifel Financial Corp | 6 995 | 495 | ||||||
| 2025-08-14 | 13F | Capital Planning Advisors, LLC | 279 588 | 19 786 | ||||||
| 2025-08-06 | 13F | Golden State Wealth Management, LLC | 7 439 | 9,16 | 526 | 21,20 | ||||
| 2025-08-18 | 13F | Arq Wealth Advisors, Llc | 55 033 | 0,00 | 3 507 | 0,00 | ||||
| 2025-08-26 | NP | JSMOX - JPMorgan SmartRetirement 2065 Fund Class R6 | 167 596 | 11,82 | 11 861 | 24,19 | ||||
| 2025-08-08 | 13F | Phoenix Wealth Advisors | 5 995 | 424 | ||||||
| 2025-08-06 | 13F | Paladin Advisory Group, LLC | 805 | 0,00 | 57 | 9,80 | ||||
| 2025-09-04 | 13F/A | Advisor Group Holdings, Inc. | 750 730 | 58,16 | 51 483 | 70,21 | ||||
| 2025-05-15 | 13F/A | Orion Portfolio Solutions, LLC | 3 441 | 219 | ||||||
| 2025-08-14 | 13F | Mml Investors Services, Llc | 1 358 561 | 887,63 | 96 | 1 100,00 | ||||
| 2025-07-07 | 13F | Wealth Alliance Advisory Group, LLC | 6 981 | −1,06 | 494 | 10,02 | ||||
| 2025-07-08 | 13F | Parallel Advisors, LLC | 47 | 3 | ||||||
| 2025-08-14 | 13F | Jane Street Group, Llc | 70 117 | −79,86 | 4 962 | −77,63 | ||||
| 2025-07-17 | 13F | Sound Income Strategies, LLC | 39 | 50,00 | 3 | 100,00 | ||||
| 2025-08-08 | 13F | Francis Financial, Inc. | 326 329 | 7,81 | 23 094 | 19,74 | ||||
| 2025-07-14 | 13F | AdvisorNet Financial, Inc | 5 609 | 34,32 | 397 | 48,87 | ||||
| 2025-08-29 | 13F | Total Investment Management Inc | 336 | 24 | ||||||
| 2025-07-17 | 13F | HB Wealth Management, LLC | 32 730 | 16,21 | 2 316 | 29,10 | ||||
| 2025-08-26 | NP | JTSAX - JPMorgan SmartRetirement 2050 Fund Class A | 5 521 248 | −7,03 | 390 739 | 3,26 | ||||
| 2025-08-12 | 13F | O'shaughnessy Asset Management, Llc | 1 986 | 1 068,24 | 141 | 1 300,00 | ||||
| 2025-08-11 | 13F/A | Purus Wealth Management, LLC | 29 718 | 2,41 | 2 103 | 13,74 | ||||
| 2025-06-30 | NP | PFJDX - RiskPro® Dynamic 20-30 Fund Class R | 118 965 | −12,93 | 7 733 | −7,91 | ||||
| 2025-07-31 | 13F | Cambridge Investment Research Advisors, Inc. | 306 630 | 5,25 | 22 | 16,67 | ||||
| 2025-07-22 | 13F | Unique Wealth, Llc | 71 556 | −0,55 | 5 064 | 10,47 | ||||
| 2025-07-25 | 13F | Northwest Capital Management Inc | 7 751 | −4,21 | 549 | 6,41 | ||||
| 2025-08-08 | 13F | Meridian Wealth Management, LLC | 7 016 | 3,13 | 497 | 14,55 | ||||
| 2025-08-08 | 13F | Kaizen Financial Strategies | 66 401 | 25,65 | 4 699 | 39,56 | ||||
| 2025-04-29 | 13F | Pensionmark Financial Group, Llc | 0 | −100,00 | 0 | |||||
| 2025-08-06 | 13F | Commonwealth Equity Services, Llc | 1 413 400 | 3,56 | 100 | 16,28 | ||||
| 2025-08-26 | NP | SRJAX - JPMorgan SmartRetirement 2035 Fund Class A | 5 695 440 | −7,85 | 403 066 | 2,34 | ||||
| 2025-08-01 | 13F | Rossby Financial, LCC | 307 | 0,00 | 22 | 5,00 | ||||
| 2025-08-26 | NP | SMTAX - JPMorgan SmartRetirement 2040 Fund Class A | 6 623 916 | −7,14 | 468 775 | 3,14 | ||||
| 2025-08-14 | 13F | Goldman Sachs Group Inc | 0 | −100,00 | 0 | −100,00 | ||||
| 2025-08-04 | 13F | Daymark Wealth Partners, Llc | 17 255 | 1 221 | ||||||
| 2025-08-11 | 13F | Intrepid Financial Planning Group LLC | 20 151 | 1,65 | 1 426 | 12,91 | ||||
| 2025-08-12 | 13F | Franklin Resources Inc | 4 022 | 172,68 | 285 | 205,38 | ||||
| 2025-08-13 | 13F | Twin Peaks Wealth Advisors, LLC | 83 | 6 | ||||||
| 2025-08-07 | 13F | Allworth Financial LP | 256 | 0,00 | 18 | 12,50 | ||||
| 2025-07-25 | 13F | NorthRock Partners, LLC | 1 515 | 299,74 | 107 | 345,83 | ||||
| 2025-08-07 | 13F | Hughes Financial Services, LLC | 781 048 | 6,51 | 54 947 | 17,49 | ||||
| 2025-08-05 | 13F | Huntington National Bank | 0 | −100,00 | ||||||
| 2025-07-28 | 13F | WealthPlan Investment Management, LLC | 33 652 | 2 382 | ||||||
| 2025-05-28 | NP | JTTAX - JPMorgan SmartRetirement 2020 Fund Class A | 1 031 361 | −5,86 | 65 718 | 2,53 | ||||
| 2025-07-24 | 13F | Eastern Bank | 572 196 | 40 494 | ||||||
| 2025-08-14 | 13F | GWM Advisors LLC | 14 603 | −21,12 | 1 033 | −12,38 | ||||
| 2025-08-13 | 13F | My Purposeful Wealth Corp. | 5 286 | 372 | ||||||
| 2025-08-14 | 13F | Susquehanna International Group, Llp | 118 953 | 8 418 | ||||||
| 2025-08-27 | NP | JNL SERIES TRUST - JNL iShares Tactical Moderate Growth Fund (I) | 359 622 | −0,16 | 25 450 | 10,88 | ||||
| 2025-08-14 | 13F | Brinker Capital Investments, LLC | 0 | −100,00 | 0 | |||||
| 2025-07-10 | 13F | Sharkey, Howes & Javer | 19 492 | 1 379 | ||||||
| 2025-07-10 | 13F | Sovran Advisors, LLC | 5 387 | 2,90 | 380 | 14,80 | ||||
| 2025-08-01 | 13F | Planning Directions Inc | 12 130 | 858 | ||||||
| 2025-07-02 | 13F | First Financial Bank - Trust Division | 488 788 | 5,00 | 34 592 | 16,62 | ||||
| 2025-07-30 | 13F | Bogart Wealth, LLC | 1 621 384 | 107,54 | 114 745 | 130,50 | ||||
| 2025-07-24 | 13F | 3Chopt Investment Partners, LLC | 12 460 | 47,00 | 882 | 63,15 | ||||
| 2025-07-24 | 13F | Us Bancorp \de\ | 2 326 | 9,87 | 165 | 22,39 | ||||
| 2025-05-15 | 13F | Lido Advisors, LLC | 0 | −100,00 | 0 | −100,00 | ||||
| 2025-07-15 | 13F | Centerline Wealth Advisors, LLC | 43 113 | 3 051 | ||||||
| 2025-08-08 | 13F/A | Ignite Planners, LLC | 27 473 | 1 919 | ||||||
| 2025-07-23 | 13F | Sax Wealth Advisors, Llc | 214 045 | 38,19 | 15 148 | 53,48 | ||||
| 2025-08-12 | 13F | J.w. Cole Advisors, Inc. | 5 876 | −7,70 | 416 | 2,47 | ||||
| 2025-07-17 | 13F | Janney Montgomery Scott LLC | 1 252 180 | 12,09 | 89 | 23,94 | ||||
| 2025-08-12 | 13F | SRS Capital Advisors, Inc. | 106 | 0,00 | 8 | 16,67 | ||||
| 2025-08-05 | 13F | Tsfg, Llc | 78 | 0,00 | 0 | |||||
| 2025-08-11 | 13F | Aptus Capital Advisors, LLC | 106 | 23,26 | 8 | 40,00 | ||||
| 2025-07-18 | 13F | Trust Co Of Vermont | 2 | 0 | ||||||
| 2025-07-16 | 13F | Valicenti Advisory Services Inc | 25 161 | −1,46 | 2 | 0,00 | ||||
| 2025-07-09 | 13F | Bulwark Capital Corp | 720 | 51 | ||||||
| 2025-07-14 | 13F | Park Avenue Securities Llc | 88 979 | 4,89 | 6 | 20,00 | ||||
| 2025-08-12 | 13F | MAI Capital Management | 967 | 18,50 | 68 | 30,77 | ||||
| 2025-08-14 | 13F | Fmr Llc | 2 528 022 | −8,50 | 178 908 | 1,63 | ||||
| 2025-08-14 | 13F | Integrated Wealth Concepts LLC | 55 301 | 1,86 | 3 914 | 13,13 | ||||
| 2025-07-30 | 13F | TFB Advisors LLC | 20 582 | 25,85 | 1 457 | 39,73 | ||||
| 2025-08-12 | 13F | Global Retirement Partners, LLC | 34 077 | 716,61 | 2 412 | 888,11 | ||||
| 2025-08-26 | NP | ONCFX - JPMorgan Investor Conservative Growth Fund Class I | 2 395 988 | −14,85 | 169 564 | −5,43 | ||||
| 2025-08-06 | NP | LINCOLN VARIABLE INSURANCE PRODUCTS TRUST - LVIP JPMorgan Retirement Income Fund Standard Class | 112 104 | −9,74 | 7 934 | 0,25 | ||||
| 2025-07-15 | 13F | Aspire Capital Advisors LLC | 133 823 | −0,18 | 9 471 | 10,86 | ||||
| 2025-07-24 | 13F | Cyndeo Wealth Partners, LLC | 16 816 | 8,53 | 1 190 | 20,57 | ||||
| 2025-04-25 | 13F | TBH Global Asset Management, LLC | 0 | −100,00 | 0 | −100,00 | ||||
| 2025-04-28 | 13F | Buffington Mohr McNeal | 253 125 | −7,98 | 16 129 | 0,21 | ||||
| 2025-08-13 | 13F | Banco de Sabadell, S.A | 659 | 0 | ||||||
| 2025-07-25 | 13F | Atria Wealth Solutions, Inc. | 2 871 | −65,38 | 203 | −61,55 | ||||
| 2025-08-13 | 13F | Northwestern Mutual Wealth Management Co | 263 095 | 22,71 | 18 619 | 36,29 | ||||
| 2025-07-21 | 13F | Ameriflex Group, Inc. | 80 | −84,00 | 6 | −83,87 | ||||
| 2025-07-25 | 13F | Concurrent Investment Advisors, LLC | 4 126 | 291 | ||||||
| 2025-07-31 | 13F | Conservest Capital Advisors, Inc. | 868 178 | −0,82 | 61 441 | 10,15 | ||||
| 2025-04-29 | 13F | Financial Network Wealth Management LLC | 2 164 | 0 | ||||||
| 2025-07-17 | 13F | Genesis Private Wealth, Llc | 3 361 | 238 | ||||||
| 2025-05-15 | 13F | Gts Securities Llc | 0 | −100,00 | 0 | |||||
| 2025-08-14 | 13F | Mariner, LLC | 2 944 | −18,83 | 208 | −9,96 | ||||
| 2025-07-25 | 13F | Cwm, Llc | 1 411 110 | 30,04 | 100 | 43,48 | ||||
| 2025-08-07 | 13F | Kestra Private Wealth Services, Llc | 31 791 | 6,35 | 2 250 | 18,12 | ||||
| 2025-07-08 | 13F | Lowe Wealth Advisors, LLC | 3 226 | 197,05 | 228 | 230,43 | ||||
| 2025-07-17 | 13F | Raleigh Capital Management Inc. | 185 | 13 | ||||||
| 2025-07-21 | 13F | Greenwood Capital Associates Llc | 82 571 | 37,31 | 5 844 | 52,52 | ||||
| 2025-04-23 | 13F | WoodTrust Financial Corp | 0 | −100,00 | 0 | |||||
| 2025-08-14 | 13F | Bank of Marin | 6 583 | 466 | ||||||
| 2025-08-14 | 13F | Wells Fargo & Company/mn | 518 | 1 570,97 | 37 | 3 500,00 | ||||
| 2025-08-15 | 13F | Captrust Financial Advisors | 12 492 | 16,30 | 884 | 29,24 | ||||
| 2025-08-26 | NP | EQ ADVISORS TRUST - EQ/International Core Managed Volatility Portfolio Class IB | 59 700 | 264,02 | 4 225 | 304,21 | ||||
| 2025-08-27 | NP | JNL SERIES TRUST - JNL iShares Tactical Growth Fund (A) | 570 239 | 0,59 | 40 356 | 11,72 | ||||
| 2025-05-15 | 13F | Citadel Advisors Llc | Put | 0 | −100,00 | 0 | −100,00 | |||
| 2025-07-16 | 13F | Blue Oak Capital, LLC | 26 119 | 58,62 | 1 848 | 76,17 | ||||
| 2025-08-14 | 13F | Wiley Bros.-aintree Capital, Llc | 4 408 | 312 | ||||||
| 2025-07-30 | 13F | Wbh Advisory Inc | 24 584 | 1 740 | ||||||
| 2025-08-06 | 13F | Convergence Financial, LLC | 56 005 | 3 963 | ||||||
| 2025-08-13 | 13F | Cary Street Partner Investment Advisory Llc | 2 869 | 203 | ||||||
| 2025-07-01 | 13F | Harbor Investment Advisory, Llc | 270 | 0,00 | 19 | 11,76 | ||||
| 2025-07-28 | 13F | Sagespring Wealth Partners, Llc | 1 165 969 | 7,34 | 82 516 | 19,21 | ||||
| 2025-08-14 | 13F | Ameriprise Financial Inc | 3 729 | −9,16 | 264 | 0,77 | ||||
| 2025-07-22 | 13F | Cedar Mountain Advisors, LLC | 630 | 45 | ||||||
| 2025-07-22 | 13F | Berger Financial Group, Inc | 6 534 | 0,00 | 462 | 11,06 | ||||
| 2025-07-22 | 13F | Grimes & Company, Inc. | 135 004 | 37,94 | 9 554 | 53,21 | ||||
| 2025-08-14 | 13F | Financial Advisory Service, Inc. | 0 | −100,00 | 0 | |||||
| 2025-07-31 | 13F | Whipplewood Advisors, LLC | 3 345 | 7 171,74 | 237 | 8,26 | ||||
| 2025-04-21 | 13F | Nelson, Van Denburg & Campbell Wealth Management Group, LLC | 0 | −100,00 | 0 | |||||
| 2025-08-12 | 13F | Park Square Financial Group, LLC | 356 | 13,02 | 25 | 25,00 | ||||
| 2025-08-14 | 13F | Royal Bank Of Canada | 245 766 | −1,02 | 17 393 | 9,94 | ||||
| 2025-07-18 | 13F | Lockerman Financial Group, Inc. | 11 598 | 4,72 | 821 | 16,31 | ||||
| 2025-08-14 | 13F | CoreCap Advisors, LLC | 106 | 8 | ||||||
| 2025-07-28 | 13F | Harbour Investments, Inc. | 826 | 0,00 | 58 | 11,54 | ||||
| 2025-08-13 | 13F | Mayfair Advisory Group, LLC | 3 373 | 241 | ||||||
| 2025-07-16 | 13F | Kendall Capital Management | 245 388 | 37,99 | 17 366 | 53,26 | ||||
| 2025-08-01 | 13F | Logan Capital Management Inc | 370 | 26 | ||||||
| 2025-08-12 | 13F | Vestor Capital, Llc | 601 | −99,79 | 0 | −100,00 | ||||
| 2025-08-19 | 13F | Asset Dedication, LLC | 275 | 0,00 | 19 | 11,76 | ||||
| 2025-07-29 | NP | MVFG - Monarch Volume Factor Global Unconstrained Index ETF | 55 901 | 3 863 | ||||||
| 2025-07-22 | 13F | Integrated Capital Management, LLC | 9 334 | 146,67 | 1 | |||||
| 2025-08-26 | NP | JAKAX - JPMorgan SmartRetirement 2060 Fund Class A | 1 619 310 | −5,06 | 114 599 | 5,44 | ||||
| 2025-07-30 | 13F | Patten Group, Inc. | 5 171 | 0,00 | 366 | 10,94 | ||||
| 2025-08-14 | 13F | EP Wealth Advisors, Inc. | 249 433 | 17 652 | ||||||
| 2025-07-17 | 13F | Wagner Wealth Management, Llc | 103 408 | 2,99 | 7 318 | 14,40 | ||||
| 2025-07-22 | 13F | Mascoma Wealth Management LLC | 164 145 | 7,30 | 11 617 | 19,18 | ||||
| 2025-08-14 | 13F | Great Valley Advisor Group, Inc. | 705 238 | 10,10 | 49 910 | 22,28 | ||||
| 2025-07-23 | 13F | Gentry Private Wealth, Llc | 11 980 | 0,02 | 848 | 11,01 | ||||
| 2025-08-13 | 13F | Colonial Trust Co / SC | 0 | −100,00 | 0 | |||||
| 2025-08-08 | 13F | Cetera Investment Advisers | 856 804 | 8,46 | 60 636 | 20,46 | ||||
| 2025-07-24 | 13F | Financial Connections Group, Inc. | 80 133 | 61,43 | 6 | 66,67 | ||||
| 2025-08-26 | NP | JSACX - JPMorgan SmartRetirement 2045 Fund Class C | 5 629 467 | −9,08 | 398 397 | 0,98 | ||||
| 2025-06-30 | NP | PFSEX - RiskPro® 30+ Fund Class R | 434 338 | −24,88 | 28 232 | −20,54 | ||||
| 2025-08-08 | 13F | Pnc Financial Services Group, Inc. | 8 | −99,48 | 1 | −100,00 | ||||
| 2025-08-15 | 13F | Equitable Holdings, Inc. | 69 849 | 206,53 | 4 943 | 240,66 | ||||
| 2025-08-13 | 13F | Jones Financial Companies Lllp | 278 868 | 48,62 | 19 730 | 63,28 | ||||
| 2025-08-11 | 13F | Western Wealth Management, LLC | 31 960 | 4,43 | 2 262 | 15,95 | ||||
| 2025-08-13 | 13F | StoneX Group Inc. | 7 059 | 10,40 | 500 | 22,60 | ||||
| 2025-07-15 | 13F | Bfsg, Llc | 0 | −100,00 | 0 | −100,00 | ||||
| 2025-08-26 | NP | ONGFX - JPMorgan Investor Growth & Income Fund Class I | 4 018 481 | −1,55 | 284 388 | 9,34 | ||||
| 2025-08-06 | 13F | Walkner Condon Financial Advisors LLC | 6 585 | −12,20 | 466 | −2,31 | ||||
| 2025-07-21 | 13F | Ashton Thomas Securities, Llc | 995 | 0,00 | 70 | 11,11 | ||||
| 2025-08-13 | 13F | Continuum Advisory, LLC | 0 | −100,00 | 0 | −100,00 | ||||
| 2025-08-26 | NP | ONIFX - JPMorgan Investor Growth Fund Class I | 6 764 094 | −1,57 | 478 695 | 9,32 | ||||
| 2025-07-22 | 13F/A | Red Mountain Financial, LLC | 19 313 | 1 367 | ||||||
| 2025-08-14 | 13F/A | Rockefeller Capital Management L.P. | 278 844 | 5,76 | 19 734 | 17,47 | ||||
| 2025-07-24 | 13F | IFP Advisors, Inc | 8 780 | 52,64 | 621 | 69,67 | ||||
| 2025-08-11 | 13F | HighTower Advisors, LLC | 4 597 | 13,82 | 325 | 26,46 | ||||
| 2025-08-13 | 13F | Invesco Ltd. | 739 000 | 0,00 | 52 299 | 11,06 | ||||
| 2025-08-11 | 13F | Lake Street Financial Llc | 11 963 | 27,23 | 847 | 41,24 | ||||
| 2025-05-05 | 13F | Nwam Llc | 0 | −100,00 | 0 | −100,00 | ||||
| 2025-07-22 | 13F | Belpointe Asset Management LLC | 25 276 | −0,07 | 1 789 | 10,99 | ||||
| 2025-05-15 | 13F | Glenmede Trust Co Na | 691 | 44 | ||||||
| 2025-08-14 | 13F | Comerica Bank | 187 | 83,33 | 13 | 116,67 | ||||
| 2025-07-18 | 13F | TruNorth Capital Management, LLC | 0 | −100,00 | 0 | −100,00 | ||||
| 2025-07-28 | 13F | Kiker Wealth Management, LLC | 27 | 0,00 | 2 | 0,00 | ||||
| 2025-08-06 | 13F | Csenge Advisory Group | 21 897 | 1,41 | 1 513 | 10,84 | ||||
| 2025-08-06 | 13F | Vestmark Advisory Solutions, Inc. | 1 001 264 | 194,92 | 70 859 | 227,55 | ||||
| 2025-07-02 | 13F | HBW Advisory Services LLC | 40 264 | 43,70 | 2 849 | 59,61 | ||||
| 2025-08-11 | 13F | Mill Creek Capital Advisors, LLC | 4 656 | 330 | ||||||
| 2025-07-24 | 13F | Lokken Investment Group LLC | 34 766 | 1,97 | 2 460 | 13,26 | ||||
| 2025-07-24 | 13F | Bryant Woods Investment Advisors, LLC | 102 131 | 47,46 | 7 228 | 63,77 | ||||
| 2025-07-11 | 13F | Elk River Wealth Management, LLC | 368 118 | 0,81 | 26 052 | 11,96 | ||||
| 2025-07-21 | 13F | Cliftonlarsonallen Wealth Advisors, Llc | 485 913 | 15,36 | 34 388 | 28,12 | ||||
| 2025-07-25 | 13F | Richardson Financial Services Inc. | 504 | 27,92 | 36 | 40,00 | ||||
| 2025-07-16 | 13F | Essex Financial Services, Inc. | 4 697 | 0,00 | 332 | 11,04 | ||||
| 2025-08-18 | 13F | N.E.W. Advisory Services LLC | 8 015 | −90,29 | 567 | −89,22 | ||||
| 2025-04-18 | 13F | Halbert Hargrove Global Advisors, Llc | 0 | −100,00 | 0 | −100,00 | ||||
| 2025-07-29 | 13F | Smithbridge Asset Management Inc/de | 118 890 | 3,44 | 8 414 | 14,88 | ||||
| 2025-07-30 | 13F | Lionsbridge Wealth Management LLC | 14 462 | 1 023 | ||||||
| 2025-08-08 | 13F | Capital Investment Advisory Services, LLC | 3 042 | 13,09 | 215 | 25,73 | ||||
| 2025-08-14 | 13F | Citadel Advisors Llc | 9 391 | 4,25 | 665 | 15,88 | ||||
| 2025-08-26 | NP | JSRAX - JPMorgan SmartRetirement Income Fund Class A | 1 707 648 | 92,18 | 120 850 | 113,44 | ||||
| 2025-05-09 | 13F | NewEdge Wealth, LLC | 0 | −100,00 | 0 | |||||
| 2025-08-08 | 13F | Avantax Advisory Services, Inc. | 139 399 | 1 495,87 | 9 865 | 1 674,28 | ||||
| 2025-07-10 | 13F | Wealth Enhancement Advisory Services, Llc | 152 509 | −3,52 | 10 796 | 7,19 | ||||
| 2025-08-14 | 13F | Raymond James Financial Inc | 595 665 | 24,19 | 42 155 | 37,93 | ||||
| 2025-08-01 | 13F | Signature Wealth Management Group | 4 989 | 0,48 | 353 | 11,71 | ||||
| 2025-08-05 | 13F | Simplex Trading, Llc | 0 | −100,00 | 0 | |||||
| 2025-07-29 | 13F | Private Trust Co Na | 5 788 | 23,73 | 410 | 37,25 | ||||
| 2025-08-01 | 13F | Envestnet Asset Management Inc | 2 061 888 | 183,88 | 145 920 | 215,29 | ||||
| 2025-08-04 | 13F | Creekmur Asset Management LLC | 479 | 34 | ||||||
| 2025-07-11 | 13F | Farther Finance Advisors, LLC | 7 586 | 5,57 | 537 | 17,03 | ||||
| 2025-08-11 | 13F | United Advisor Group, LLC | 3 688 | −10,16 | 261 | 0,00 | ||||
| 2025-08-12 | 13F | LPL Financial LLC | 4 051 112 | 34,38 | 286 697 | 49,25 | ||||
| 2025-07-10 | 13F | Shira Ridge Wealth Management | 4 262 | 15,60 | 302 | 28,63 | ||||
| 2025-08-05 | 13F | Dynasty Wealth Management, Llc | 1 057 253 | −10,42 | 74 822 | −0,51 |