Grundläggande statistik
| Institutionella ägare | 173 total, 173 long only, 0 short only, 0 long/short - change of 21,83% MRQ |
| Genomsnittlig portföljallokering | 0.9328 % - change of −17,12% MRQ |
| Institutionella aktier (lång) | 36 067 627 (ex 13D/G) - change of 8,34MM shares 30,09% MRQ |
| Institutionellt värde (lång) | $ 1 742 957 USD ($1000) |
Institutionellt ägande och aktieägare
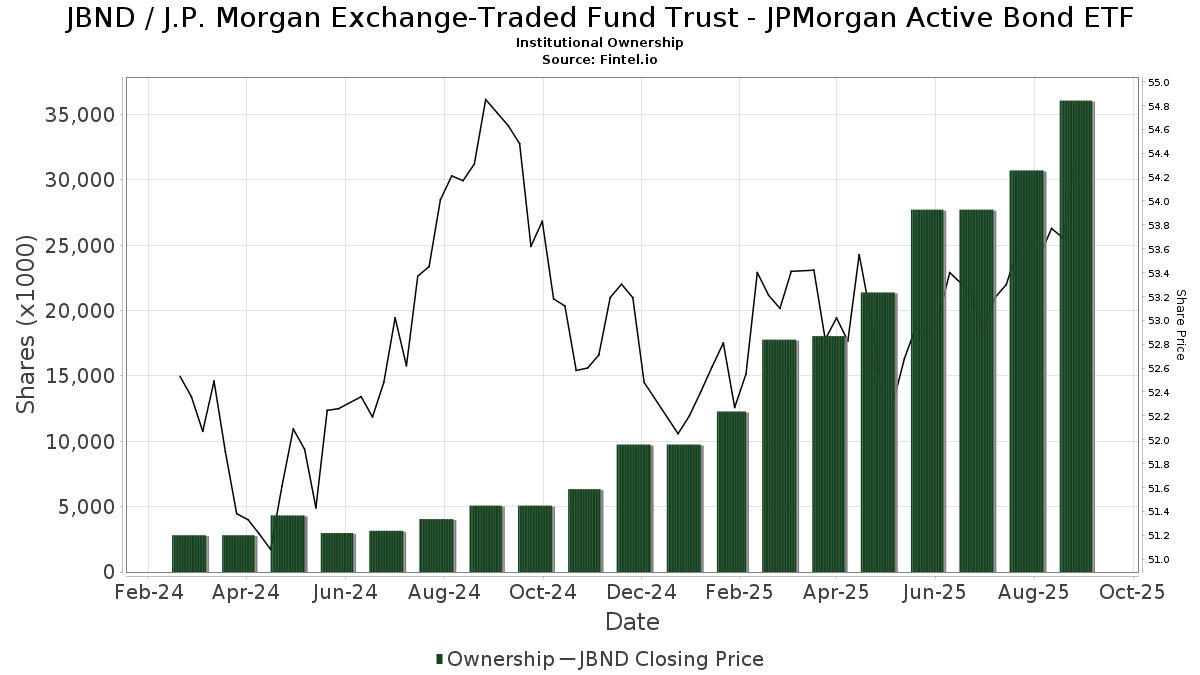
J.P. Morgan Exchange-Traded Fund Trust - JPMorgan Active Bond ETF (US:JBND) har 173 Institutionella ägare och aktieägare som har lämnat in 13D/G- eller 13F-formulär till Securities Exchange Commission (SEC). Dessa institut innehar totalt 36,067,627 aktier. Största aktieägare inkluderar LPL Financial LLC, Cetera Investment Advisers, Diversified Portfolios, Inc., Envestnet Asset Management Inc, Baldwin Brothers Inc/ma, Berger Financial Group, Inc, IAG Wealth Partners, LLC, Royal Bank Of Canada, Cwm, Llc, and Mml Investors Services, Llc .
J.P. Morgan Exchange-Traded Fund Trust - JPMorgan Active Bond ETF (NYSE:JBND) Institutionell ägarstruktur visar institutioners och fonders nuvarande positioner i företaget, samt de senaste förändringarna i positionernas storlek. Större aktieägare kan vara enskilda investerare, fonder, hedgefonder eller institutioner. Bilaga 13D visar att investeraren äger (eller ägde) mer än 5% av företaget och avser (eller avsåg) att aktivt eftersträva en förändring av affärsstrategin. Schedule 13G indikerar en passiv investering på över 5%.
The share price as of September 11, 2025 is 54,42 / share. Previously, on September 12, 2024, the share price was 54,74 / share. This represents a decline of 0,58% over that period.
Fondsentimentets poäng
Fondsentimentet poängen(fka Ägarackumulation-poäng) visar vilka aktier som är mest köpta av fonder. Det är resultatet av en sofistikerad kvantitativ flerfaktormodell som identifierar företag med de högsta nivåerna av institutionell ackumulering. Poängsättningsmodellen använder en kombination av den totala ökningen av redovisade ägare, förändringarna i portföljallokeringarna för dessa ägare och andra mått. Siffran sträcker sig från 0 till 100, där högre siffror indikerar en högre nivå av ackumulering i förhållande till sina konkurrenter, och 50 är genomsnittet.
Uppdateringsfrekvens: Dagligen
Se Ownership Explorer, som innehåller en lista över de högst rankade företagen.
Institutionell sälj/köp-kvot
Förutom att rapportera vanliga eget kapital- och skuldemissioner måste institutioner med mer än 100MM tillgångar under förvaltning också avslöja sina innehav av sälj- och köpoptioner. Eftersom säljoptioner i allmänhet indikerar ett negativt sentiment och köpoptioner indikerar ett positivt sentiment, kan vi få en uppfattning om det övergripande institutionella sentimentet genom att plotta förhållandet mellan säljoptioner och köpoptioner. Diagrammet till höger visar det historiska förhållandet mellan sälj- och köpoptioner för detta instrument.
Genom att använda sälj/köp-kvoten som en indikator på aktieägarnas sentiment undviker man en av de största bristerna med att använda det totala institutionella ägandet, nämligen att en betydande del av de förvaltade tillgångarna investeras passivt för att följa index. Passivt förvaltade fonder köper vanligtvis inte optioner, så indikatorn för sälj/köp-kvoten ger en bättre bild av stämningen i aktivt förvaltade fonder.
13F- och NPORT-arkiveringar
Detaljer om 13F-arkiveringar är gratis. Detaljer om NP-arkiveringar kräver ett premiummedlemskap. Gröna rader indikerar nya positioner. Röda rader indikerar stängda positioner. Klicka på länk symbolen för att se hela transaktionshistoriken.
Uppgradera
för att låsa upp premiumdata och exportera till Excel ![]() .
.
| Fil Datum | Källa | Investerare | Typ | Genomsnittligt pris (beräknat) |
Aktier | Δ Aktier (%) |
Rapporterat värde (1000 USD) |
Δ Värde (%) |
Portföljallokering (%) |
|
|---|---|---|---|---|---|---|---|---|---|---|
| 2025-08-01 | 13F | Gwn Securities Inc. | 21 342 | −8,40 | 1 145 | −8,11 | ||||
| 2025-08-14 | 13F | Aqr Capital Management Llc | 14 036 | −32,17 | 752 | −32,07 | ||||
| 2025-07-31 | 13F | MN Wealth Advisors, LLC | 15 486 | −3,74 | 830 | −3,60 | ||||
| 2025-08-05 | 13F | Sigma Planning Corp | 60 046 | 3 218 | ||||||
| 2025-07-08 | 13F | Gallacher Capital Management LLC | 106 630 | 3,27 | 5 714 | 3,42 | ||||
| 2025-08-08 | 13F | Larson Financial Group LLC | 379 409 | 69,37 | 20 333 | 69,59 | ||||
| 2025-07-15 | 13F | Garrett Investment Advisors LLC | 254 980 | −16,81 | 13 664 | −16,70 | ||||
| 2025-05-06 | 13F | Lifeworks Advisors, LLC | 0 | −100,00 | 0 | −100,00 | ||||
| 2025-08-11 | 13F | Private Advisor Group, LLC | 505 074 | 668,64 | 27 067 | 669,80 | ||||
| 2025-08-05 | 13F | AGH Wealth Advisors, LLC | 118 797 | 4,94 | 6 367 | 5,08 | ||||
| 2025-08-05 | 13F | BEAM Asset Management, LLC | 39 793 | 235,49 | 2 133 | 236,28 | ||||
| 2025-08-11 | 13F | NewEdge Wealth, LLC | 424 089 | 11 146,06 | 22 723 | 11 204,48 | ||||
| 2025-08-04 | 13F | IFG Advisory, LLC | 63 621 | 325,44 | 3 409 | 326,13 | ||||
| 2025-08-11 | 13F | Diversified Portfolios, Inc. | 1 625 209 | 9,04 | 87 095 | 9,18 | ||||
| 2025-07-29 | 13F | Pinnacle Wealth Management, LLC | 236 927 | 24,30 | 12 697 | 24,46 | ||||
| 2025-05-14 | 13F | Susquehanna International Group, Llp | 0 | −100,00 | 0 | |||||
| 2025-07-28 | 13F | Essex LLC | 36 400 | 1 951 | ||||||
| 2025-08-15 | 13F | High Falls Advisors, Inc | 3 895 | 209 | ||||||
| 2025-07-18 | 13F | Truist Financial Corp | 22 051 | 145,26 | 1 182 | 145,53 | ||||
| 2025-08-14 | 13F | Atomi Financial Group, Inc. | 5 468 | 293 | ||||||
| 2025-08-06 | 13F | Vestmark Advisory Solutions, Inc. | 35 213 | 1 887 | ||||||
| 2025-08-12 | 13F | Vawter Financial, Ltd. | 14 098 | −84,97 | 756 | −84,96 | ||||
| 2025-08-07 | 13F | Parkside Financial Bank & Trust | 450 | 24 | ||||||
| 2025-08-21 | 13F | Aveo Capital Partners, LLC | 0 | −100,00 | 0 | |||||
| 2025-07-09 | 13F | Fermata Advisors, LLC | 43 291 | −87,01 | 2 320 | −87,00 | ||||
| 2025-05-16 | 13F | Coordinated Financial Services, Inc./CO | 7 851 | 420 | ||||||
| 2025-08-07 | 13F | Compass Financial Group, Inc. | 60 634 | −0,19 | 3 249 | −0,06 | ||||
| 2025-08-11 | 13F | Summit Wealth Partners, LLC | 9 596 | 514 | ||||||
| 2025-07-15 | 13F | Avaii Wealth Management, Llc | 22 700 | −2,66 | 1 217 | −2,56 | ||||
| 2025-08-12 | 13F | Proequities, Inc. | 0 | 0 | ||||||
| 2025-07-11 | 13F | Bond & Devick Financial Network, Inc. | 4 060 | 0,00 | 218 | 0,00 | ||||
| 2025-07-21 | 13F | Ascent Group, LLC | 17 380 | 10,03 | 931 | 10,18 | ||||
| 2025-04-28 | 13F | Financial Advocates Investment Management | 0 | −100,00 | 0 | |||||
| 2025-07-23 | 13F | Defined Financial Planning LLC | 62 911 | 3 321 | ||||||
| 2025-07-25 | 13F | Means Investment Co., Inc. | 364 117 | 1,70 | 19 513 | 1,84 | ||||
| 2025-08-08 | 13F | Kingsview Wealth Management, LLC | 4 279 | 229 | ||||||
| 2025-07-25 | 13F | Envestnet Portfolio Solutions, Inc. | 4 151 | 222 | ||||||
| 2025-07-30 | 13F | Bleakley Financial Group, LLC | 29 542 | 1 583 | ||||||
| 2025-08-13 | 13F | Cary Street Partners Financial Llc | 1 925 | 414,71 | 103 | 415,00 | ||||
| 2025-08-01 | 13F | Ashton Thomas Private Wealth, LLC | 49 914 | 22,90 | 2 675 | 23,06 | ||||
| 2025-08-14 | 13F | Mariner, LLC | 183 168 | 20,79 | 9 816 | 20,95 | ||||
| 2025-07-25 | 13F | Total Clarity Wealth Management, Inc. | 11 400 | 15,28 | 611 | 18,22 | ||||
| 2025-07-30 | 13F | D.a. Davidson & Co. | 288 528 | 7,32 | 15 462 | 7,46 | ||||
| 2025-08-11 | 13F | Advisor Resource Council | 0 | −100,00 | 0 | |||||
| 2025-07-23 | 13F | WESPAC Advisors, LLC | 51 762 | 911,77 | 2 774 | 915,75 | ||||
| 2025-08-20 | 13F/A | Coppell Advisory Solutions LLC | 11 763 | 628 | ||||||
| 2025-07-17 | 13F | Sterling Investment Advisors, Ltd. | 21 810 | 9,27 | 1 169 | 9,36 | ||||
| 2025-08-04 | 13F | Spire Wealth Management | 33 | 3,12 | 2 | 0,00 | ||||
| 2025-07-09 | 13F | Pallas Capital Advisors LLC | 612 640 | −2,47 | 32 831 | −2,34 | ||||
| 2025-08-04 | 13F | Assetmark, Inc | 1 024 | 55 | ||||||
| 2025-07-16 | 13F | Beaumont Financial Advisors, LLC | 13 323 | 1,77 | 714 | 1,86 | ||||
| 2025-07-28 | 13F | Axxcess Wealth Management, Llc | 141 567 | 174,94 | 7 587 | 175,35 | ||||
| 2025-08-11 | 13F | Principal Securities, Inc. | 1 388 | 74 | ||||||
| 2025-08-14 | 13F | Bank Of America Corp /de/ | 346 945 | 18 593 | ||||||
| 2025-08-12 | 13F | Jpmorgan Chase & Co | 570 031 | 9,06 | 30 548 | 9,20 | ||||
| 2025-08-12 | 13F | Steward Partners Investment Advisory, Llc | 227 | 180,25 | 12 | 200,00 | ||||
| 2025-09-04 | 13F/A | Advisor Group Holdings, Inc. | 177 922 | 24,35 | 9 535 | 24,51 | ||||
| 2025-08-05 | 13F | Beckerman Institutional, LLC | 4 234 | 0,07 | 0 | |||||
| 2025-07-25 | 13F | Yarger Wealth Strategies, Llc | 92 505 | −5,95 | 4 957 | −5,81 | ||||
| 2025-07-17 | 13F | KWB Wealth | 106 932 | 95,28 | 5 723 | 100,00 | ||||
| 2025-08-12 | 13F | Archer Investment Corp | 21 693 | 135,61 | 1 163 | 136,18 | ||||
| 2025-07-18 | 13F | Cooper Financial Group | 107 522 | −1,52 | 5 762 | −1,39 | ||||
| 2025-08-05 | 13F | Aurdan Capital Management, LLC | 17 185 | 19,33 | 921 | 19,48 | ||||
| 2025-04-23 | 13F | Golden State Wealth Management, LLC | 0 | −100,00 | 0 | |||||
| 2025-07-23 | 13F | Prime Capital Investment Advisors, LLC | 26 303 | 1 410 | ||||||
| 2025-08-08 | 13F/A | Prospect Financial Services LLC | 4 135 | 222 | ||||||
| 2025-08-14 | 13F | Mml Investors Services, Llc | 934 225 | 20,39 | 50 | 21,95 | ||||
| 2025-07-08 | 13F | Parallel Advisors, LLC | 84 463 | −0,99 | 4 526 | −0,85 | ||||
| 2025-08-14 | 13F | Stifel Financial Corp | 10 617 | 569 | ||||||
| 2025-08-12 | 13F | Eldridge Investment Advisors, Inc. | 201 405 | 164,85 | 10 755 | 164,29 | ||||
| 2025-08-06 | 13F | Legacy Wealth Managment, LLC/ID | 41 462 | 7,27 | 2 222 | 7,40 | ||||
| 2025-08-08 | 13F | Fortis Group Advisors, LLC | 15 034 | 802 | ||||||
| 2025-07-21 | 13F | Cornell Pochily Investment Advisors, Inc. | 0 | −100,00 | 0 | |||||
| 2025-08-14 | 13F | GWM Advisors LLC | 72 915 | −2,62 | 3 908 | −2,50 | ||||
| 2025-07-15 | 13F | LVZ Advisors, Inc. | 920 066 | 0,79 | 49 306 | 0,92 | ||||
| 2025-07-16 | 13F | ORG Partners LLC | 12 304 | 657 | ||||||
| 2025-08-08 | 13F | Atlantic Trust, LLC | 56 | −30,00 | 3 | −25,00 | ||||
| 2025-07-24 | 13F | Jfs Wealth Advisors, Llc | 1 889 | 0,00 | 101 | 0,00 | ||||
| 2025-08-06 | 13F | Prospera Financial Services Inc | 29 935 | 16,42 | 1 604 | 16,57 | ||||
| 2025-08-13 | 13F | Baird Financial Group, Inc. | 112 727 | 1,70 | 6 041 | 1,84 | ||||
| 2025-08-13 | 13F | Rosenblum Silverman Sutton S F Inc /ca | 83 010 | 38,69 | 4 449 | 38,87 | ||||
| 2025-07-28 | 13F | Evernest Financial Advisors, LLC | 41 939 | 2 248 | ||||||
| 2025-05-15 | 13F | Two Sigma Securities, Llc | 0 | −100,00 | 0 | −100,00 | ||||
| 2025-07-14 | 13F | Cobblestone Asset Management LLC | 195 775 | −11,53 | 10 492 | −11,42 | ||||
| 2025-08-07 | 13F | Nwam Llc | 4 404 | 235 | ||||||
| 2025-08-06 | 13F | Innealta Capital, Llc | 44 591 | −87,85 | 2 390 | −87,83 | ||||
| 2025-08-15 | 13F | Kestra Advisory Services, LLC | 6 078 | 35,19 | 326 | 35,42 | ||||
| 2025-07-21 | 13F | Mattern Capital Management, Llc | 104 228 | 5 586 | ||||||
| 2025-08-14 | 13F | Vienna Asset Management LLC | 40 577 | 20,76 | 2 175 | 20,91 | ||||
| 2025-08-13 | 13F | VestGen Advisors, LLC | 236 931 | 23,50 | 12 709 | 23,78 | ||||
| 2025-08-06 | 13F | Commonwealth Equity Services, Llc | 932 398 | 16,84 | 50 | 16,67 | ||||
| 2025-08-12 | 13F | Resolute Wealth Strategies, LLC | 5 856 | 51,87 | 314 | 51,94 | ||||
| 2025-07-10 | 13F | Sovran Advisors, LLC | 75 302 | 3 990 | ||||||
| 2025-07-24 | 13F | Coordinated Financial Services, Inc. | 7 851 | 421 | ||||||
| 2025-08-08 | 13F | Pnc Financial Services Group, Inc. | 0 | −100,00 | 0 | |||||
| 2025-08-06 | 13F | Quadrant Private Wealth Management, LLC | 4 900 | 22,50 | 263 | 22,43 | ||||
| 2025-08-06 | 13F | AE Wealth Management LLC | 11 221 | 601 | ||||||
| 2025-04-28 | 13F | Strategic Financial Concepts, LLC | 0 | −100,00 | 0 | −100,00 | ||||
| 2025-07-17 | 13F | Janney Montgomery Scott LLC | 532 384 | 4,85 | 29 | 3,70 | ||||
| 2025-07-21 | 13F | Ameriflex Group, Inc. | 932 | −14,57 | 50 | −15,52 | ||||
| 2025-08-14 | 13F | Integrated Wealth Concepts LLC | 83 883 | 47,14 | 4 495 | 47,33 | ||||
| 2025-07-28 | 13F | RFG Advisory, LLC | 41 181 | 5,49 | 2 207 | 5,60 | ||||
| 2025-08-08 | 13F/A | Ignite Planners, LLC | 4 156 | 220 | ||||||
| 2025-05-15 | 13F | Old Mission Capital Llc | 0 | −100,00 | 0 | −100,00 | ||||
| 2025-08-07 | 13F | Sollinda Capital Management LLC | 41 810 | 2 241 | ||||||
| 2025-08-11 | 13F | Perennial Investment Advisors, LLC | 0 | −100,00 | 0 | |||||
| 2025-08-11 | 13F | Regal Investment Advisors LLC | 11 851 | 1,80 | 635 | 1,93 | ||||
| 2025-08-13 | 13F | Northwestern Mutual Wealth Management Co | 503 | −67,15 | 27 | −67,90 | ||||
| 2025-07-28 | 13F | SFG Wealth Management, LLC. | 0 | −100,00 | 0 | |||||
| 2025-08-13 | 13F | IAG Wealth Partners, LLC | 991 378 | −8,23 | 53 128 | −8,11 | ||||
| 2025-07-10 | 13F | Guided Capital Wealth Management, LLC | 128 188 | −3,69 | 6 870 | −3,57 | ||||
| 2025-08-01 | 13F/A | GGM Financials LLC | 12 078 | 91,99 | 647 | 92,56 | ||||
| 2025-07-31 | 13F | Insight Wealth Partners, LLC | 94 436 | 7,39 | 5 061 | 7,52 | ||||
| 2025-07-29 | 13F | Latitude Advisors, LLC | 4 569 | 245 | ||||||
| 2025-07-31 | 13F | Cambridge Investment Research Advisors, Inc. | 116 289 | 9,67 | 6 | 20,00 | ||||
| 2025-08-14 | 13F | Ruggaard & Associates LLC | 227 167 | 0,06 | 12 174 | 0,18 | ||||
| 2025-07-22 | 13F | Sutton Place Investors Llc | 7 087 | −5,28 | 380 | −5,25 | ||||
| 2025-07-25 | 13F | Cwm, Llc | 978 086 | 834,19 | 52 | 940,00 | ||||
| 2025-08-08 | 13F | Intrua Financial, LLC | 657 211 | −1,47 | 35 220 | −1,34 | ||||
| 2025-07-24 | 13F | Robertson Stephens Wealth Management, LLC | 15 134 | 811 | ||||||
| 2025-07-24 | 13F | Baldwin Brothers Inc/ma | 1 343 741 | −0,62 | 72 011 | −0,49 | ||||
| 2025-07-24 | 13F | Us Bancorp \de\ | 26 168 | 47,11 | 1 402 | 47,27 | ||||
| 2025-05-12 | 13F | Independent Advisor Alliance | 0 | −100,00 | 0 | |||||
| 2025-08-14 | 13F | Fmr Llc | 9 | 12,50 | 0 | |||||
| 2025-07-29 | 13F | Citizens Business Bank | 199 665 | 10 700 | ||||||
| 2025-08-14 | 13F | Jane Street Group, Llc | 203 111 | −16,00 | 10 885 | −15,90 | ||||
| 2025-07-30 | 13F | Wbh Advisory Inc | 90 445 | 816,36 | 4 847 | 817,80 | ||||
| 2025-08-08 | 13F | Royal Harbor Partners, LLC | 166 166 | 0,92 | 8 905 | 1,04 | ||||
| 2025-08-13 | 13F | Cary Street Partner Investment Advisory Llc | 3 506 | −24,75 | 188 | −24,90 | ||||
| 2025-08-25 | 13F | Silverlake Wealth Management Llc | 34 505 | 6,77 | 1 849 | 6,94 | ||||
| 2025-07-31 | 13F | Opes Wealth Management LLC | 170 970 | 10,06 | 9 162 | 10,21 | ||||
| 2025-08-08 | 13F | OmniStar Financial Group, Inc. | 53 937 | 16,34 | 2 890 | 16,34 | ||||
| 2025-08-28 | NP | ICSIX - Dynamic U.S. Opportunity Fund Class I | 6 087 | −98,24 | 326 | −98,24 | ||||
| 2025-07-08 | 13F | Goldstone Financial Group, LLC | 154 474 | −43,21 | 8 213 | −43,58 | ||||
| 2025-07-28 | 13F | Harbour Investments, Inc. | 2 890 | 21,48 | 155 | 21,26 | ||||
| 2025-07-24 | 13F | Ronald Blue Trust, Inc. | 19 718 | 42,52 | 1 057 | 42,70 | ||||
| 2025-08-11 | 13F | HighTower Advisors, LLC | 283 186 | 9,32 | 15 176 | 9,46 | ||||
| 2025-08-14 | 13F | CoreCap Advisors, LLC | 102 | 5 | ||||||
| 2025-08-18 | 13F | Tyler-Stone Wealth Management | 102 707 | 2,02 | 5 504 | 2,15 | ||||
| 2025-05-16 | 13F | American Trust | 0 | −100,00 | 0 | |||||
| 2025-07-28 | 13F | CGC Financial Services, LLC | 443 166 | 23 749 | ||||||
| 2025-07-07 | 13F | Centurion Wealth Management LLC | 183 158 | −6,48 | 9 815 | −4,08 | ||||
| 2025-07-22 | 13F | Berger Financial Group, Inc | 1 266 953 | 1,28 | 67 896 | 1,41 | ||||
| 2025-07-22 | 13F | Cedar Mountain Advisors, LLC | 53 096 | −2,84 | 2 845 | −2,70 | ||||
| 2025-07-28 | 13F | Sagespring Wealth Partners, Llc | 368 452 | 19 745 | ||||||
| 2025-08-14 | 13F | Goldman Sachs Group Inc | 0 | −100,00 | 0 | |||||
| 2025-08-04 | 13F | Northwest Financial Advisors | 41 915 | 3,41 | 2 246 | 3,55 | ||||
| 2025-07-15 | 13F | Foster Victor Wealth Advisors, LLC | 49 975 | 2 659 | ||||||
| 2025-08-18 | 13F | Geneos Wealth Management Inc. | 2 120 | 107,44 | 114 | 109,26 | ||||
| 2025-07-25 | 13F | Atria Wealth Solutions, Inc. | 0 | −100,00 | 0 | |||||
| 2025-08-14 | 13F | Visionary Wealth Advisors | 6 183 | 331 | ||||||
| 2025-08-14 | 13F | EP Wealth Advisors, Inc. | 0 | −100,00 | 0 | |||||
| 2025-04-25 | 13F | MidAtlantic Capital Management, Inc. | 0 | −100,00 | 0 | |||||
| 2025-08-04 | 13F | Savvy Advisors, Inc. | 205 026 | 10 987 | ||||||
| 2025-08-12 | 13F | Martin Worley Group | 89 954 | 15,39 | 4 821 | 15,53 | ||||
| 2025-08-11 | 13F | Forge Financial Services LLC | 0 | −100,00 | 0 | |||||
| 2025-08-11 | 13F | Inspire Advisors, LLC | 21 410 | 1 147 | ||||||
| 2025-08-14 | 13F | Royal Bank Of Canada | 988 313 | 89,71 | 52 964 | 89,96 | ||||
| 2025-08-13 | 13F | Twin Peaks Wealth Advisors, LLC | 9 836 | 10,64 | 526 | 12,15 | ||||
| 2025-08-15 | 13F | Equitable Holdings, Inc. | 34 216 | 56,48 | 1 834 | 56,67 | ||||
| 2025-08-06 | 13F | Mark Sheptoff Financial Planning, Llc | 797 | 42,32 | 43 | 44,83 | ||||
| 2025-08-12 | 13F | LPL Financial LLC | 7 155 369 | 58,18 | 383 456 | 58,39 | ||||
| 2025-08-11 | 13F | Western Wealth Management, LLC | 40 075 | 13,75 | 2 148 | 13,90 | ||||
| 2025-07-14 | 13F | Chapin Davis, Inc. | 11 315 | 0,00 | 606 | 0,17 | ||||
| 2025-07-17 | 13F | ERn Financial, LLC | 74 137 | 3 973 | ||||||
| 2025-08-04 | 13F | Atria Investments Llc | 63 469 | 3 401 | ||||||
| 2025-08-06 | 13F | Legacy Investment Solutions, LLC | 41 462 | 2 222 | ||||||
| 2025-08-07 | 13F | Kestra Private Wealth Services, Llc | 252 157 | 36,29 | 13 513 | 36,48 | ||||
| 2025-08-08 | 13F | Cetera Investment Advisers | 1 700 150 | 63,71 | 91 111 | 63,92 | ||||
| 2025-08-13 | 13F | StoneX Group Inc. | 264 181 | 15,45 | 14 157 | 15,60 | ||||
| 2025-07-09 | 13F | Lifelong Wealth Advisors, Inc. | 566 067 | 30 336 | ||||||
| 2025-07-07 | 13F | Taylor & Morgan Wealth Management, LLC | 4 911 | 0,00 | 263 | 0,38 | ||||
| 2025-08-12 | 13F | Global Retirement Partners, LLC | 95 268 | 1 058 433,33 | 5 105 | |||||
| 2025-08-01 | 13F | Envestnet Asset Management Inc | 1 475 828 | 3,38 | 78 717 | 3,02 | ||||
| 2025-08-13 | 13F | Jones Financial Companies Lllp | 326 852 | 117,01 | 17 464 | 117,17 | ||||
| 2025-07-10 | 13F | Waypoint Wealth Partners Inc. | 8 194 | 439 | ||||||
| 2025-08-14 | 13F | UBS Group AG | 0 | −100,00 | 0 | |||||
| 2025-07-18 | 13F | Newman Dignan & Sheerar, Inc. | 5 925 | −14,44 | 318 | −14,32 | ||||
| 2025-08-14 | 13F | Raymond James Financial Inc | 377 875 | −17,60 | 20 250 | −17,49 | ||||
| 2025-07-03 | 13F | TrueWealth Advisors, LLC | 11 240 | 23,73 | 602 | 23,87 | ||||
| 2025-07-24 | 13F | IFP Advisors, Inc | 48 695 | 1 368,49 | 2 610 | 1 374,01 | ||||
| 2025-07-22 | 13F | USAdvisors Wealth Management, LLC | 32 554 | 11,71 | 2 | 0,00 | ||||
| 2025-07-14 | 13F | AdvisorNet Financial, Inc | 981 | 53 | ||||||
| 2025-07-11 | 13F | Farther Finance Advisors, LLC | 500 | 0,00 | 27 | 0,00 | ||||
| 2025-07-30 | 13F | LGT Financial Advisors LLC | 340 | −3,41 | 18 | 0,00 | ||||
| 2025-08-08 | 13F | Capital Investment Advisory Services, LLC | 316 167 | 1,15 | 16 943 | 1,29 | ||||
| 2025-08-14 | 13F | Colony Group, LLC | 10 068 | 34,78 | 540 | 35,09 | ||||
| 2025-07-16 | 13F | Essex Financial Services, Inc. | 135 131 | 5,31 | 7 242 | 5,45 | ||||
| 2025-07-10 | 13F | Wealth Enhancement Advisory Services, Llc | 412 063 | 50,03 | 21 909 | 49,05 | ||||
| 2025-07-29 | 13F | Private Trust Co Na | 10 702 | 145,91 | 574 | 146,98 | ||||
| 2025-07-07 | 13F | Peterson Wealth Advisors, LLC | 176 130 | 15,29 | 9 439 | 15,90 | ||||
| 2025-07-10 | 13F | Focus Financial Network, Inc. | 25 584 | −88,42 | 1 371 | −88,40 | ||||
| 2025-07-24 | 13F | Bernard Wealth Management Corp. | 225 | 0,00 | 12 | 0,00 | ||||
| 2025-08-14 | 13F | Great Valley Advisor Group, Inc. | 128 997 | −3,83 | 6 913 | −3,71 | ||||
| 2025-07-21 | 13F | Triad Wealth Partners, LLC | 9 171 | 47,73 | 491 | 47,89 |