Grundläggande statistik
| Institutionella ägare | 274 total, 273 long only, 0 short only, 1 long/short - change of 1,85% MRQ |
| Genomsnittlig portföljallokering | 0.3378 % - change of 18,67% MRQ |
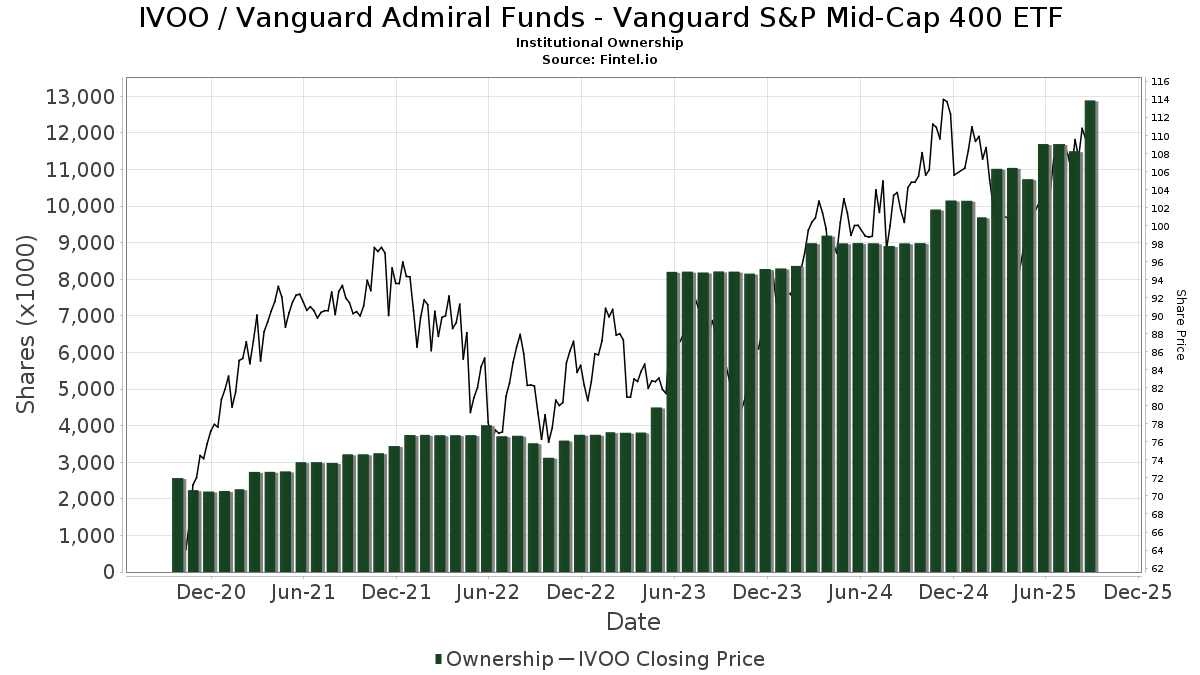
| Institutionella aktier (lång) | 12 885 887 (ex 13D/G) - change of 1,19MM shares 10,18% MRQ |
| Institutionellt värde (lång) | $ 1 240 164 USD ($1000) |
Institutionellt ägande och aktieägare
Vanguard Admiral Funds - Vanguard S&P Mid-Cap 400 ETF (US:IVOO) har 274 Institutionella ägare och aktieägare som har lämnat in 13D/G- eller 13F-formulär till Securities Exchange Commission (SEC). Dessa institut innehar totalt 12,885,887 aktier. Största aktieägare inkluderar Goldman Sachs Group Inc, Bank Of America Corp /de/, UBS Group AG, Morgan Stanley, Lockheed Martin Investment Management Co, Hantz Financial Services, Inc., Northwestern Mutual Wealth Management Co, Starr Indemnity & Liability Co, Raymond James Financial Inc, and LPL Financial LLC .
Vanguard Admiral Funds - Vanguard S&P Mid-Cap 400 ETF (ARCA:IVOO) Institutionell ägarstruktur visar institutioners och fonders nuvarande positioner i företaget, samt de senaste förändringarna i positionernas storlek. Större aktieägare kan vara enskilda investerare, fonder, hedgefonder eller institutioner. Bilaga 13D visar att investeraren äger (eller ägde) mer än 5% av företaget och avser (eller avsåg) att aktivt eftersträva en förändring av affärsstrategin. Schedule 13G indikerar en passiv investering på över 5%.
The share price as of September 10, 2025 is 110,74 / share. Previously, on September 10, 2024, the share price was 99,95 / share. This represents an increase of 10,80% over that period.
Fondsentimentets poäng
Fondsentimentet poängen(fka Ägarackumulation-poäng) visar vilka aktier som är mest köpta av fonder. Det är resultatet av en sofistikerad kvantitativ flerfaktormodell som identifierar företag med de högsta nivåerna av institutionell ackumulering. Poängsättningsmodellen använder en kombination av den totala ökningen av redovisade ägare, förändringarna i portföljallokeringarna för dessa ägare och andra mått. Siffran sträcker sig från 0 till 100, där högre siffror indikerar en högre nivå av ackumulering i förhållande till sina konkurrenter, och 50 är genomsnittet.
Uppdateringsfrekvens: Dagligen
Se Ownership Explorer, som innehåller en lista över de högst rankade företagen.
Institutionell sälj/köp-kvot
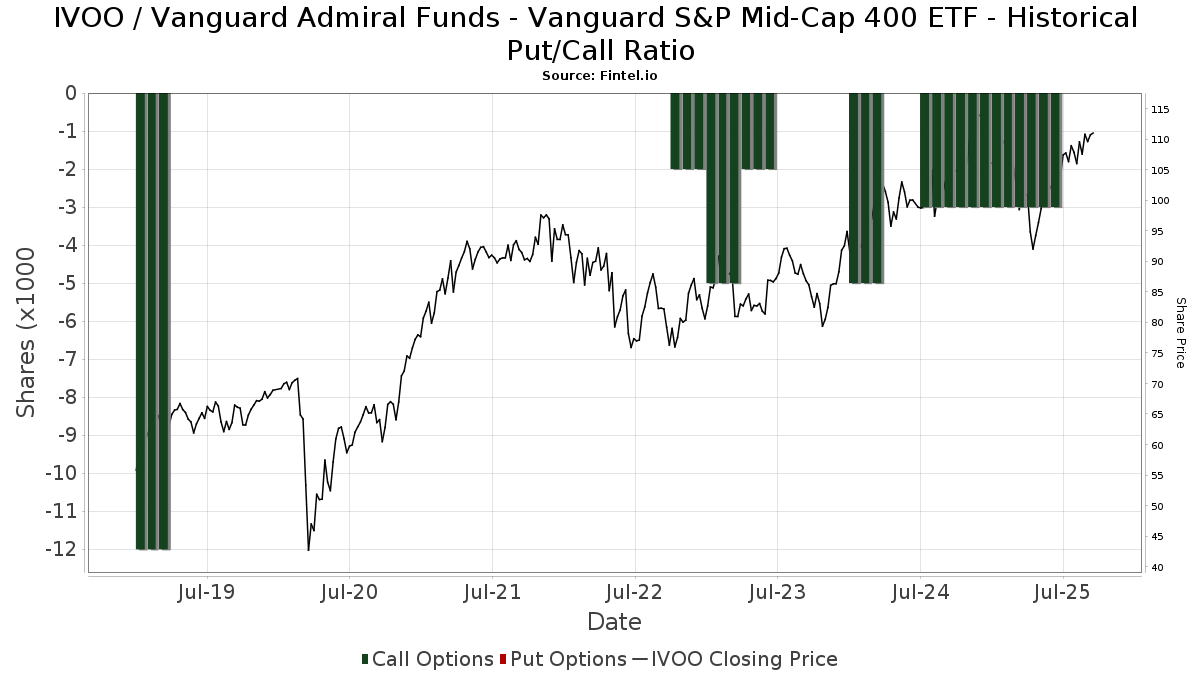
Förutom att rapportera vanliga eget kapital- och skuldemissioner måste institutioner med mer än 100MM tillgångar under förvaltning också avslöja sina innehav av sälj- och köpoptioner. Eftersom säljoptioner i allmänhet indikerar ett negativt sentiment och köpoptioner indikerar ett positivt sentiment, kan vi få en uppfattning om det övergripande institutionella sentimentet genom att plotta förhållandet mellan säljoptioner och köpoptioner. Diagrammet till höger visar det historiska förhållandet mellan sälj- och köpoptioner för detta instrument.
Genom att använda sälj/köp-kvoten som en indikator på aktieägarnas sentiment undviker man en av de största bristerna med att använda det totala institutionella ägandet, nämligen att en betydande del av de förvaltade tillgångarna investeras passivt för att följa index. Passivt förvaltade fonder köper vanligtvis inte optioner, så indikatorn för sälj/köp-kvoten ger en bättre bild av stämningen i aktivt förvaltade fonder.
13F- och NPORT-arkiveringar
Detaljer om 13F-arkiveringar är gratis. Detaljer om NP-arkiveringar kräver ett premiummedlemskap. Gröna rader indikerar nya positioner. Röda rader indikerar stängda positioner. Klicka på länk symbolen för att se hela transaktionshistoriken.
Uppgradera
för att låsa upp premiumdata och exportera till Excel ![]() .
.
| Fil Datum | Källa | Investerare | Typ | Genomsnittligt pris (beräknat) |
Aktier | Δ Aktier (%) |
Rapporterat värde (1000 USD) |
Δ Värde (%) |
Portföljallokering (%) |
|
|---|---|---|---|---|---|---|---|---|---|---|
| 2025-08-18 | 13F | Geneos Wealth Management Inc. | 560 | −46,56 | 59 | −43,69 | ||||
| 2025-08-12 | 13F | Atlas Capital Advisors Llc | 800 | −24,88 | 84 | −20,95 | ||||
| 2025-08-13 | 13F | Beacon Pointe Advisors, LLC | 3 813 | 9,82 | 400 | 16,96 | ||||
| 2025-08-11 | 13F | Dorsey & Whitney Trust CO LLC | 3 460 | 0,00 | 363 | 6,45 | ||||
| 2025-08-11 | 13F | Ritter Daniher Financial Advisory LLC / DE | 10 979 | 0,00 | 1 153 | 6,37 | ||||
| 2025-08-05 | 13F | Bank Of Montreal /can/ | 2 930 | 2,45 | 308 | 8,87 | ||||
| 2025-07-18 | 13F | Centricity Wealth Management, LLC | 3 013 | 0,00 | 316 | 6,40 | ||||
| 2025-07-31 | 13F | Ssa Swiss Advisors Ag | 0 | −100,00 | 0 | |||||
| 2025-07-23 | 13F | Trifecta Capital Advisors, LLC | 258 | 0,00 | 27 | 8,00 | ||||
| 2025-08-12 | 13F/A | Cozad Asset Management Inc | 2 386 | 0,00 | 250 | 6,38 | ||||
| 2025-07-28 | 13F | Harbour Investments, Inc. | 42 467 | 7,00 | 4 458 | 13,81 | ||||
| 2025-08-06 | 13F | Mascagni Wealth Management, Inc. | 2 823 | −12,95 | 296 | −7,50 | ||||
| 2025-08-04 | 13F | Simon Quick Advisors, Llc | 8 990 | −6,51 | 944 | −0,63 | ||||
| 2025-08-04 | 13F | JDM Financial Group LLC | 0 | −100,00 | 0 | |||||
| 2025-08-04 | 13F | Spire Wealth Management | 7 578 | −10,14 | 795 | −4,45 | ||||
| 2025-08-14 | 13F | Glenmede Investment Management, LP | 4 000 | 420 | ||||||
| 2025-08-05 | 13F | Fourth Dimension Wealth, LLC | 10 | −77,78 | 1 | −75,00 | ||||
| 2025-08-13 | 13F | Texas Capital Bank Wealth Management Services Inc | 54 261 | −9,17 | 5 696 | −3,39 | ||||
| 2025-08-19 | 13F | Asset Dedication, LLC | 0 | −100,00 | 0 | |||||
| 2025-08-13 | 13F | Jones Financial Companies Lllp | 3 818 | 64,14 | 401 | 74,67 | ||||
| 2025-05-05 | 13F | J.w. Cole Advisors, Inc. | 0 | −100,00 | 0 | |||||
| 2025-05-12 | 13F | Townsquare Capital Llc | 0 | −100,00 | 0 | |||||
| 2025-08-13 | 13F | Capital Analysts, Inc. | 4 204 | −26,15 | 0 | |||||
| 2025-08-13 | 13F | Renaissance Technologies Llc | 7 600 | −25,49 | 798 | −20,78 | ||||
| 2025-08-13 | 13F | Fort Sheridan Advisors Llc | 10 845 | −4,39 | 1 138 | 1,70 | ||||
| 2025-08-08 | 13F | Pnc Financial Services Group, Inc. | 66 | 0,00 | 7 | 0,00 | ||||
| 2025-07-31 | 13F | LJI Wealth Management, LLC | 2 002 | 210 | ||||||
| 2025-07-17 | 13F | Independence Bank of Kentucky | 948 | 0,00 | 100 | 6,45 | ||||
| 2025-08-11 | 13F | Wealthspire Advisors, LLC | 6 263 | 0,00 | 658 | 6,31 | ||||
| 2025-09-04 | 13F/A | Advisor Group Holdings, Inc. | 115 106 | 7,83 | 12 092 | 14,71 | ||||
| 2025-07-22 | 13F | Checchi Capital Advisers, LLC | 44 011 | 15,24 | 4 620 | 22,58 | ||||
| 2025-07-18 | 13F | Naples Global Advisors, Llc | 10 165 | 0,00 | 1 067 | 6,38 | ||||
| 2025-08-07 | 13F | King Luther Capital Management Corp | 207 | −0,48 | ||||||
| 2025-07-17 | 13F | Alliance Wealth Advisors, LLC | 1 968 | 207 | ||||||
| 2025-07-23 | 13F | SpringVest Wealth Management LLC | 22 454 | −2,03 | 2 357 | 4,20 | ||||
| 2025-07-31 | 13F | City State Bank | 50 | 0,00 | 5 | 25,00 | ||||
| 2025-08-14 | 13F | CoreCap Advisors, LLC | 2 370 | 0,38 | 249 | 6,44 | ||||
| 2025-08-14 | 13F | EP Wealth Advisors, Inc. | 38 230 | 0,21 | 4 013 | 6,59 | ||||
| 2025-08-14 | 13F | Goldman Sachs Group Inc | 1 496 468 | 75,38 | 157 099 | 86,54 | ||||
| 2025-07-14 | 13F | Kieckhefer Group Llc | 2 466 | 8,87 | 259 | 15,70 | ||||
| 2025-07-30 | 13F | Klingman & Associates, LLC | 14 807 | −0,53 | 1 554 | 5,79 | ||||
| 2025-07-29 | 13F | Stratos Wealth Partners, LTD. | 3 905 | −13,61 | 410 | −8,30 | ||||
| 2025-08-12 | 13F | Wealthbridge Capital Management, Llc | 10 853 | −0,58 | 1 139 | 5,76 | ||||
| 2025-08-12 | 13F | O'shaughnessy Asset Management, Llc | 2 094 | 207,94 | 220 | 226,87 | ||||
| 2025-08-14 | 13F | Evergreen Capital Management Llc | 114 281 | 6,38 | 11 997 | 13,15 | ||||
| 2025-08-13 | 13F | Flow Traders U.s. Llc | 0 | −100,00 | 0 | |||||
| 2025-07-08 | 13F | Parallel Advisors, LLC | 180 | 0,00 | 19 | 5,88 | ||||
| 2025-08-14 | 13F | Wiley Bros.-aintree Capital, Llc | 23 914 | 104,43 | 2 527 | 119,36 | ||||
| 2025-08-05 | 13F | Key FInancial Inc | 57 | 0,00 | 6 | 0,00 | ||||
| 2025-08-04 | 13F | Grant Street Asset Management, Inc. | 4 898 | 70,72 | 514 | 81,63 | ||||
| 2025-08-12 | 13F | CIBC Private Wealth Group, LLC | 240 | 0,00 | 25 | 25,00 | ||||
| 2025-08-11 | 13F | Citigroup Inc | 408 | −13,01 | 43 | −8,70 | ||||
| 2025-08-14 | 13F | Lebenthal Global Advisors, LLC | 77 837 | −1,19 | 8 171 | 5,09 | ||||
| 2025-08-15 | 13F | Kestra Advisory Services, LLC | 41 760 | 10,33 | 4 384 | 17,35 | ||||
| 2025-07-02 | 13F | Central Pacific Bank - Trust Division | 26 | 0,00 | 3 | 0,00 | ||||
| 2025-08-14 | 13F | Mariner, LLC | 36 710 | 6,62 | 3 854 | 13,39 | ||||
| 2025-08-13 | 13F | Transce3nd, LLC | 71 | 7 | ||||||
| 2025-08-13 | 13F | Colonial Trust Co / SC | 880 | 0,00 | 92 | 6,98 | ||||
| 2025-08-15 | 13F | Alaethes Wealth LLC | 1 938 | 203 | ||||||
| 2025-07-25 | 13F | Cwm, Llc | 202 | −90,39 | 0 | |||||
| 2025-08-01 | 13F | Belvedere Trading LLC | Call | 3 000 | −3,23 | 315 | 2,95 | |||
| 2025-08-06 | 13F | Adviser Investments LLC | 12 252 | 0,00 | 1 286 | 6,37 | ||||
| 2025-08-14 | 13F | Betterment LLC | 5 319 | −17,68 | 1 | |||||
| 2025-08-01 | 13F | Belvedere Trading LLC | Put | 100 | 0,00 | 10 | 11,11 | |||
| 2025-07-14 | 13F | AdvisorNet Financial, Inc | 4 573 | 0,02 | 480 | 6,43 | ||||
| 2025-07-30 | 13F | Fairway Wealth LLC | 17 600 | −6,83 | 1 848 | −0,91 | ||||
| 2025-08-12 | 13F | Steward Partners Investment Advisory, Llc | 2 041 | 83,54 | 214 | 96,33 | ||||
| 2025-07-30 | 13F | D.a. Davidson & Co. | 131 296 | 17,27 | 13 783 | 24,73 | ||||
| 2025-05-08 | 13F | Menard Financial Group LLC | 0 | −100,00 | 0 | |||||
| 2025-08-14 | 13F | Raymond James Financial Inc | 313 532 | 1,75 | 32 915 | 8,23 | ||||
| 2025-08-06 | 13F | Savant Capital, LLC | 99 310 | −7,97 | 10 426 | −2,11 | ||||
| 2025-08-13 | 13F | Northern Trust Corp | 3 593 | −9,08 | 377 | −3,33 | ||||
| 2025-08-13 | 13F | MetLife Investment Management, LLC | 33 264 | 0,00 | 3 492 | 6,37 | ||||
| 2025-07-23 | 13F | Opulen Financial Group LLC | 2 065 | −23,46 | 217 | −18,80 | ||||
| 2025-08-14 | 13F | Wells Fargo & Company/mn | 238 336 | −0,44 | 25 021 | 5,90 | ||||
| 2025-08-07 | 13F | Allworth Financial LP | 157 741 | −2,82 | 16 560 | 6,06 | ||||
| 2025-08-18 | 13F/A | National Bank Of Canada /fi/ | 271 | 0,74 | 28 | 7,69 | ||||
| 2025-08-19 | 13F/A | Pitcairn Co | 10 060 | 0,00 | 1 056 | 6,45 | ||||
| 2025-07-15 | 13F | Td Private Client Wealth Llc | 4 132 | 9,40 | 434 | 16,40 | ||||
| 2025-08-14 | 13F/A | Skopos Labs, Inc. | 2 313 | 243 | ||||||
| 2025-08-14 | 13F | GWM Advisors LLC | 2 880 | −23,59 | 302 | −18,82 | ||||
| 2025-07-31 | 13F | Sage Mountain Advisors LLC | 3 226 | 0,00 | 339 | 6,29 | ||||
| 2025-08-05 | 13F | GHP Investment Advisors, Inc. | 129 | 67,53 | 14 | 85,71 | ||||
| 2025-08-12 | 13F | Global Retirement Partners, LLC | 1 709 | −12,22 | 179 | −12,68 | ||||
| 2025-08-13 | 13F | Northwestern Mutual Wealth Management Co | 534 247 | 9,84 | 56 085 | 16,82 | ||||
| 2025-08-15 | 13F | Captrust Financial Advisors | 8 094 | 46,00 | 850 | 55,21 | ||||
| 2025-08-14 | 13F | Fiduciary Trust Co | 23 111 | −0,43 | 2 426 | 5,94 | ||||
| 2025-08-08 | 13F | Hartland & Co., LLC | 110 | 92,98 | 12 | 120,00 | ||||
| 2025-07-10 | 13F | Wealth Enhancement Advisory Services, Llc | 4 213 | −9,30 | 455 | −0,87 | ||||
| 2025-05-14 | 13F | Smartleaf Asset Management LLC | 0 | −100,00 | 0 | |||||
| 2025-08-14 | 13F | Susquehanna International Group, Llp | 4 917 | −49,45 | 516 | −46,25 | ||||
| 2025-08-04 | 13F | Assetmark, Inc | 253 | 96,12 | 27 | 116,67 | ||||
| 2025-08-05 | 13F | Gibraltar Capital Management, Inc. | 43 530 | 212,72 | 1 491 | 8,52 | ||||
| 2025-07-11 | 13F | Farther Finance Advisors, LLC | 48 | 0,00 | 5 | 25,00 | ||||
| 2025-07-30 | 13F | Phoenix Holdings Ltd. | 15 000 | −58,62 | 1 575 | −56,01 | ||||
| 2025-08-18 | 13F | Front Row Advisors LLC | 30 | 0,00 | 3 | 50,00 | ||||
| 2025-08-14 | 13F | Moneta Group Investment Advisors Llc | 60 790 | 1 064,34 | 6 382 | 1 139,03 | ||||
| 2025-04-21 | 13F | Nelson, Van Denburg & Campbell Wealth Management Group, LLC | 0 | −100,00 | 0 | |||||
| 2025-08-12 | 13F | Virtu Financial LLC | 43 895 | −22,93 | 5 | −20,00 | ||||
| 2025-08-12 | 13F | Pathstone Holdings, LLC | 82 887 | −19,01 | 8 701 | −13,86 | ||||
| 2025-08-13 | 13F | M Holdings Securities, Inc. | 0 | −100,00 | 0 | |||||
| 2025-07-14 | 13F | CRA Financial Services, LLC | 4 628 | 0,00 | 486 | 6,36 | ||||
| 2025-08-08 | 13F | Francis Financial, Inc. | 145 797 | −23,85 | 15 306 | −19,01 | ||||
| 2025-07-09 | 13F | Taylor Hoffman Capital Management LLC | 6 745 | −4,92 | 708 | 0,57 | ||||
| 2025-08-01 | 13F | Envestnet Asset Management Inc | 256 737 | 1,86 | 26 952 | 8,34 | ||||
| 2025-08-12 | 13F | Proequities, Inc. | 0 | 0 | ||||||
| 2025-07-11 | 13F | Pinnacle Bancorp, Inc. | 1 105 | 0,00 | 116 | 6,42 | ||||
| 2025-07-23 | 13F | Asset Planning Corporation | 76 785 | 27,36 | 8 061 | 35,46 | ||||
| 2025-08-06 | 13F | Raelipskie Partnership | 77 565 | 9,69 | 8 143 | 16,66 | ||||
| 2025-07-17 | 13F | Greenleaf Trust | 15 134 | 7,46 | 1 589 | 14,24 | ||||
| 2025-04-30 | 13F | Bridges Investment Management Inc | 0 | −100,00 | 0 | |||||
| 2025-05-12 | 13F | Independent Advisor Alliance | 0 | −100,00 | 0 | |||||
| 2025-07-15 | 13F | Garrett Investment Advisors LLC | 3 982 | 13,87 | 418 | 20,87 | ||||
| 2025-07-21 | 13F | Ameriflex Group, Inc. | 285 | 0,00 | 30 | 3,57 | ||||
| 2025-08-04 | 13F | Flagship Harbor Advisors, Llc | 5 133 | 0,14 | 539 | 6,53 | ||||
| 2025-07-16 | 13F | Octavia Wealth Advisors, LLC | 17 150 | −2,44 | 1 800 | 3,75 | ||||
| 2025-08-06 | 13F | Commonwealth Equity Services, Llc | 149 772 | 0,07 | 16 | 7,14 | ||||
| 2025-08-21 | NP | SFBPX - Great-West SecureFoundation Balanced ETF Fund Class A | 20 988 | −1,54 | 2 203 | 4,76 | ||||
| 2025-08-08 | 13F | C V Starr & Co Inc | 227 427 | 23 875 | ||||||
| 2025-08-01 | 13F | Zhang Financial LLC | 9 871 | 0,04 | 1 036 | 6,47 | ||||
| 2025-08-14 | 13F | Ameriprise Financial Inc | 204 205 | 8,83 | 21 430 | 15,47 | ||||
| 2025-07-29 | 13F | Stordahl Capital Management, Inc. | 5 176 | 8,13 | 543 | 15,04 | ||||
| 2025-08-07 | 13F | PFG Advisors | 0 | −100,00 | 0 | |||||
| 2025-07-08 | 13F | Nbc Securities, Inc. | 3 233 | 98,34 | 0 | |||||
| 2025-08-13 | 13F | Cerity Partners LLC | 51 442 | −14,65 | 5 400 | −9,21 | ||||
| 2025-07-17 | 13F | Janney Montgomery Scott LLC | 63 252 | 8,58 | 7 | 20,00 | ||||
| 2025-08-12 | 13F | Harbor Advisory Corp /ma/ | 49 459 | −0,16 | 5 192 | 6,20 | ||||
| 2025-08-13 | 13F | Vertex Planning Partners, LLC | 2 900 | 0,00 | 304 | 6,29 | ||||
| 2025-08-08 | 13F | Truepoint, Inc. | 18 200 | 0,00 | 1 911 | 6,35 | ||||
| 2025-07-21 | 13F | Barrett & Company, Inc. | 792 | 0,00 | 83 | 6,41 | ||||
| 2025-07-14 | 13F | Park Avenue Securities Llc | 13 059 | 1,03 | 1 | 0,00 | ||||
| 2025-08-05 | 13F | Snider Financial Group | 2 074 | −0,72 | 218 | 5,34 | ||||
| 2025-08-11 | 13F | Vanguard Group Inc | 15 630 | 16,49 | 1 641 | 23,87 | ||||
| 2025-07-25 | 13F | Atria Wealth Solutions, Inc. | 2 038 | −1,92 | 214 | 3,90 | ||||
| 2025-08-04 | 13F | Atria Investments Llc | 10 849 | −0,61 | 1 139 | 5,66 | ||||
| 2025-07-24 | 13F | IFP Advisors, Inc | 1 206 | 0,00 | 127 | 5,88 | ||||
| 2025-07-10 | 13F | Atticus Wealth Management, Llc | 405 | 43 | ||||||
| 2025-05-02 | 13F | Transcendent Capital Group LLC | 0 | −100,00 | 0 | −100,00 | ||||
| 2025-08-12 | 13F | Ameritas Investment Partners, Inc. | 5 910 | −0,20 | 620 | 6,16 | ||||
| 2025-08-13 | 13F | Quadrant Capital Group Llc | 0 | −100,00 | 0 | |||||
| 2025-07-17 | 13F | Coastline Trust Co | 35 673 | 24,74 | 3 745 | 32,67 | ||||
| 2025-07-30 | 13F | Smith Thornton Advisors LLC | 2 000 | 210 | ||||||
| 2025-08-11 | 13F | Hexagon Capital Partners LLC | 0 | −100,00 | 0 | |||||
| 2025-07-25 | 13F | Northwest Capital Management Inc | 0 | −100,00 | 0 | |||||
| 2025-08-04 | 13F | Lockheed Martin Investment Management Co | 750 000 | 0,00 | 78 735 | 6,36 | ||||
| 2025-08-14 | 13F | Mml Investors Services, Llc | 22 856 | 1,83 | 2 | 0,00 | ||||
| 2025-08-04 | 13F | Bristlecone Advisors, LLC | 2 058 | 0,00 | 216 | 6,40 | ||||
| 2025-08-11 | 13F | Eq Llc | 23 745 | 6,74 | 2 493 | 13,53 | ||||
| 2025-08-13 | 13F | Valued Retirements, Inc. | 2 158 | 0,00 | 227 | 6,60 | ||||
| 2025-05-14 | 13F | Van Hulzen Asset Management, LLC | 0 | −100,00 | 0 | |||||
| 2025-08-11 | 13F | VSM Wealth Advisory, LLC | 371 | 0,00 | 39 | 5,56 | ||||
| 2025-08-13 | 13F | EverSource Wealth Advisors, LLC | 523 | −8,41 | 55 | −3,57 | ||||
| 2025-07-31 | 13F | Optimum Investment Advisors | 1 000 | 0,00 | 105 | 6,12 | ||||
| 2025-07-23 | 13F | Sax Wealth Advisors, Llc | 10 799 | −4,24 | 1 134 | 1,80 | ||||
| 2025-08-04 | 13F | Coign Capital Advisors LLC | 102 743 | −1,17 | 10 786 | 5,12 | ||||
| 2025-08-07 | 13F | Sound View Wealth Advisors Group, LLC | 6 625 | −5,53 | 695 | 0,43 | ||||
| 2025-08-08 | 13F | Starr Indemnity & Liability Co | 364 098 | 38 223 | ||||||
| 2025-08-11 | 13F | HighTower Advisors, LLC | 1 989 | −4,05 | 209 | 1,96 | ||||
| 2025-08-14 | 13F | Mpwm Advisory Solutions, Llc | 60 | 0,00 | 6 | 20,00 | ||||
| 2025-08-06 | 13F | AE Wealth Management LLC | 376 | 7,43 | 39 | 14,71 | ||||
| 2025-07-30 | 13F | Castle Wealth Management Llc | 8 188 | 43,17 | 860 | 52,30 | ||||
| 2025-08-08 | 13F | Creative Planning | 32 161 | 15,90 | 3 376 | 23,30 | ||||
| 2025-05-13 | 13F | Brooklyn FI, LLC | 0 | −100,00 | 0 | −100,00 | ||||
| 2025-08-08 | 13F | Sittner & Nelson, Llc | 11 050 | 0,00 | 1 160 | 6,42 | ||||
| 2025-08-13 | 13F | Russell Investments Group, Ltd. | 268 | −8,84 | 28 | −3,45 | ||||
| 2025-08-07 | 13F | Samalin Investment Counsel, LLC | 3 350 | 7,51 | 352 | 14,33 | ||||
| 2025-08-05 | 13F | Carolinas Wealth Consulting Llc | 0 | −100,00 | 0 | −100,00 | ||||
| 2025-08-14 | 13F | Gotham Asset Management, LLC | 3 435 | 0,00 | 361 | 6,19 | ||||
| 2025-08-14 | 13F | Great Valley Advisor Group, Inc. | 3 291 | −58,16 | 345 | −55,54 | ||||
| 2025-07-21 | 13F | Monticello Wealth Management, Llc | 4 461 | 3,55 | 468 | 10,12 | ||||
| 2025-08-14 | 13F | Tandem Wealth Advisors LLC | 0 | −100,00 | 0 | |||||
| 2025-08-14 | 13F/A | Rockefeller Capital Management L.P. | 43 965 | 1,05 | 4 615 | 7,48 | ||||
| 2025-08-13 | 13F | Level Four Advisory Services, Llc | 6 375 | −1,15 | 669 | 5,19 | ||||
| 2025-08-15 | 13F | CI Private Wealth, LLC | 24 588 | 370,13 | 2 619 | 407,56 | ||||
| 2025-07-31 | 13F | SoundView Advisors Inc. | 17 350 | −13,18 | 2 | 0,00 | ||||
| 2025-07-23 | 13F | Bellevue Asset Management, Llc | 150 | 0,00 | 16 | 7,14 | ||||
| 2025-08-08 | 13F | Cetera Investment Advisers | 112 893 | −0,05 | 11 851 | 6,31 | ||||
| 2025-08-05 | 13F | Tiaa Trust, National Association | 3 758 | 0,00 | 395 | 6,49 | ||||
| 2025-08-14 | 13F | Mercer Global Advisors Inc /adv | 5 910 | 620 | ||||||
| 2025-08-14 | 13F | STAR Financial Bank | 5 014 | 526 | ||||||
| 2025-08-05 | 13F | Bank of New York Mellon Corp | 8 562 | 52,87 | 899 | 62,68 | ||||
| 2025-08-08 | 13F | Avantax Advisory Services, Inc. | 8 909 | 0,30 | 935 | 6,74 | ||||
| 2025-08-04 | 13F | Hantz Financial Services, Inc. | 539 465 | 41,68 | 57 | 51,35 | ||||
| 2025-07-15 | 13F | Legacy Solutions, Llc | 38 325 | 3,07 | 4 023 | 9,62 | ||||
| 2025-08-13 | 13F | Brown Advisory Inc | 59 944 | 1 249,18 | 6 293 | 1 336,53 | ||||
| 2025-08-07 | 13F | New England Private Wealth Advisors LLC | 2 995 | 0,34 | 323 | 9,52 | ||||
| 2025-08-15 | 13F | Tower Research Capital LLC (TRC) | 1 665 | −21,13 | 175 | −16,35 | ||||
| 2025-08-13 | 13F | Baird Financial Group, Inc. | 5 264 | 9,83 | 553 | 16,70 | ||||
| 2025-08-13 | 13F | Amundi | 0 | −100,00 | 0 | |||||
| 2025-07-15 | 13F | Verum Partners LLC | 2 610 | 0,27 | 274 | 6,64 | ||||
| 2025-08-04 | 13F | Arkadios Wealth Advisors | 1 934 | 203 | ||||||
| 2025-07-22 | 13F | Warwick Investment Management, Inc. | 27 167 | 14,71 | 2 852 | 21,99 | ||||
| 2025-07-24 | 13F | Ramirez Asset Management, Inc. | 1 280 | 0,00 | 134 | 6,35 | ||||
| 2025-07-31 | 13F | Moser Wealth Advisors, LLC | 631 | 0,00 | 66 | 6,45 | ||||
| 2025-07-16 | 13F | Embree Financial Group | 2 918 | 0,34 | 306 | 6,62 | ||||
| 2025-08-04 | 13F | HBK Sorce Advisory LLC | 2 031 | 0,05 | 213 | 6,50 | ||||
| 2025-08-12 | 13F | Bokf, Na | 3 413 | 260,02 | 358 | 284,95 | ||||
| 2025-07-25 | 13F | Concurrent Investment Advisors, LLC | 6 774 | 3,21 | 711 | 9,89 | ||||
| 2025-08-14 | 13F | UBS Group AG | 982 542 | 14,94 | 103 147 | 22,26 | ||||
| 2025-07-28 | 13F | Evernest Financial Advisors, LLC | 2 145 | −26,67 | 225 | −21,87 | ||||
| 2025-07-31 | 13F | Waldron Private Wealth LLC | 3 369 | 0,00 | 354 | 6,33 | ||||
| 2025-08-14 | 13F | Colony Group, LLC | 10 790 | 7,61 | 1 133 | 14,46 | ||||
| 2025-08-12 | 13F | AlphaCore Capital LLC | 170 | −80,14 | 18 | −79,76 | ||||
| 2025-07-30 | 13F | Wallace Advisory Group, LLC | 0 | −100,00 | 0 | |||||
| 2025-08-08 | 13F | Marble Harbor Investment Counsel, LLC | 19 830 | 0,00 | 2 082 | 6,34 | ||||
| 2025-07-31 | 13F | Kathleen S. Wright Associates Inc. | 3 325 | 0,24 | 349 | 6,73 | ||||
| 2025-08-08 | 13F | WASHINGTON TRUST Co | 0 | −100,00 | 0 | |||||
| 2025-09-03 | 13F | American Trust | 4 417 | 464 | ||||||
| 2025-07-17 | 13F | Fifth Third Securities, Inc. | 6 078 | −5,52 | 638 | 0,63 | ||||
| 2025-07-21 | 13F | Ameritas Advisory Services, LLC | 3 122 | −46,98 | 328 | −43,81 | ||||
| 2025-07-30 | 13F | Bogart Wealth, LLC | 567 | 0,00 | 60 | 7,27 | ||||
| 2025-08-12 | 13F | Hanover Advisors Inc | 7 076 | 7,34 | 743 | 14,15 | ||||
| 2025-08-12 | 13F | Manchester Capital Management LLC | 6 488 | 0,00 | 681 | 6,41 | ||||
| 2025-07-22 | 13F | Valpey Financial Services, LLC | 20 595 | 2 162 | ||||||
| 2025-08-12 | 13F | BlackRock, Inc. | 401 | 0,25 | 42 | 7,69 | ||||
| 2025-08-05 | 13F | Crestwood Advisors Group LLC | 3 090 | 0,82 | 324 | 7,28 | ||||
| 2025-08-08 | 13F | SBI Securities Co., Ltd. | 42 | −12,50 | 4 | 0,00 | ||||
| 2025-05-15 | 13F | Wealth Watch Advisors, INC | 0 | −100,00 | 0 | −100,00 | ||||
| 2025-07-25 | 13F | Iron Financial, LLC | 5 515 | 0,16 | 579 | 6,45 | ||||
| 2025-07-18 | 13F | Benchmark Wealth Management, LLC | 2 841 | 3,05 | 298 | 9,56 | ||||
| 2025-07-23 | 13F | Joel Isaacson & Co., LLC | 2 283 | 0,31 | 240 | 6,70 | ||||
| 2025-08-11 | 13F | Blue Bell Private Wealth Management, Llc | 810 | 0,00 | 85 | 7,59 | ||||
| 2025-07-16 | 13F | Northern Oak Wealth Management Inc | 12 347 | −1,46 | 1 296 | 4,85 | ||||
| 2025-07-24 | 13F | Ronald Blue Trust, Inc. | 42 | 0,00 | 4 | 0,00 | ||||
| 2025-07-17 | 13F | Beacon Capital Management, LLC | 141 | 0,00 | 15 | 7,69 | ||||
| 2025-07-24 | 13F | Us Bancorp \de\ | 4 495 | −2,49 | 472 | 3,52 | ||||
| 2025-07-22 | 13F | Old National Bancorp /in/ | 140 767 | 6,49 | 14 778 | 13,26 | ||||
| 2025-07-29 | 13F | Harbor Asset Planning, Inc. | 78 | 8 | ||||||
| 2025-07-30 | 13F | Bleakley Financial Group, LLC | 13 701 | 1 438 | ||||||
| 2025-07-23 | 13F | Valmark Advisers, Inc. | 32 184 | 270,48 | 3 379 | 294,17 | ||||
| 2025-08-12 | 13F | Jpmorgan Chase & Co | 173 289 | −13,85 | 18 192 | −8,38 | ||||
| 2025-08-13 | 13F | PACK Private Wealth, LLC | 8 073 | −4,86 | 848 | 1,19 | ||||
| 2025-08-14 | 13F | Warren Averett Asset Management, LLC | 20 940 | 2,11 | 2 198 | 8,60 | ||||
| 2025-08-12 | 13F | Coldstream Capital Management Inc | 0 | −100,00 | 0 | |||||
| 2025-08-06 | 13F | Rialto Wealth Management, LLC | 6 | 0,00 | 1 | |||||
| 2025-07-11 | 13F | Essex Savings Bank | 2 791 | −49,93 | 293 | −46,91 | ||||
| 2025-08-14 | 13F | Bank Of America Corp /de/ | 1 180 379 | −14,06 | 123 916 | −8,60 | ||||
| 2025-05-12 | 13F | Motley Fool Wealth Management, LLC | 0 | −100,00 | 0 | |||||
| 2025-08-06 | 13F | Soltis Investment Advisors LLC | 61 679 | −21,38 | 6 475 | −16,37 | ||||
| 2025-07-18 | 13F | Truist Financial Corp | 20 380 | −24,86 | 2 139 | −20,10 | ||||
| 2025-05-15 | 13F/A | Orion Portfolio Solutions, LLC | 9 457 | −42,72 | 933 | −46,41 | ||||
| 2025-04-29 | 13F | Centered Wealth LLC dba Miller Equity Capital Advisors | 0 | −100,00 | 0 | |||||
| 2025-07-16 | 13F | First American Bank | 35 170 | 0,91 | 3 692 | 7,36 | ||||
| 2025-07-24 | 13F | Eastern Bank | 2 043 | 0,00 | 214 | 6,47 | ||||
| 2025-08-07 | 13F | 1st Source Bank | 3 404 | 0,00 | 357 | 6,57 | ||||
| 2025-08-14 | 13F | Royal Bank Of Canada | 229 277 | 16,99 | 24 070 | 24,44 | ||||
| 2025-05-07 | 13F | Evermay Wealth Management Llc | 0 | −100,00 | 0 | −100,00 | ||||
| 2025-08-26 | 13F/A | Thrivent Financial For Lutherans | 0 | −100,00 | 0 | |||||
| 2025-08-04 | 13F | Pinnacle Associates Ltd | 3 141 | 0,00 | 330 | 6,13 | ||||
| 2025-08-11 | 13F | Private Advisor Group, LLC | 42 722 | −2,56 | 4 485 | 3,63 | ||||
| 2025-05-09 | 13F | R. W. Roge & Company, Inc. | 0 | −100,00 | 0 | |||||
| 2025-04-23 | 13F | Creative Financial Designs Inc /adv | 0 | 0 | ||||||
| 2025-07-16 | 13F | Signaturefd, Llc | 154 | 0,00 | 16 | 6,67 | ||||
| 2025-08-05 | 13F | Plante Moran Financial Advisors, LLC | 378 | 53,66 | 40 | 62,50 | ||||
| 2025-07-08 | 13F | Apella Capital, LLC | 3 025 | 0,00 | 323 | 12,94 | ||||
| 2025-08-15 | 13F | Equitable Holdings, Inc. | 2 745 | 3,31 | 288 | 9,92 | ||||
| 2025-08-06 | 13F | Atlas Legacy Advisors, LLC | 36 003 | 1,21 | 3 780 | 4,54 | ||||
| 2025-08-14 | 13F | Envision Financial Planning, LLC | 9 305 | 10,75 | 977 | 17,73 | ||||
| 2025-07-31 | 13F | Sentinel Trust Co Lba | 61 700 | −28,34 | 6 | −25,00 | ||||
| 2025-07-23 | 13F | Hemenway Trust Co LLC | 2 492 | 0,00 | 262 | 6,53 | ||||
| 2025-08-11 | 13F | NewEdge Wealth, LLC | 2 826 | 0,00 | 299 | 7,55 | ||||
| 2025-04-18 | 13F | Edge Financial Advisors LLC | 0 | −100,00 | 0 | |||||
| 2025-08-11 | 13F | Principal Securities, Inc. | 2 863 | 0,00 | 301 | −0,66 | ||||
| 2025-07-29 | 13F | Mountain Capital Investment Advisors, Inc | 5 868 | −98,07 | 624 | −97,87 | ||||
| 2025-08-14 | 13F | Stage Harbor Financial, Llc | 2 791 | −49,93 | 293 | −46,91 | ||||
| 2025-07-28 | 13F | Turtle Creek Wealth Advisors, LLC | 7 133 | 749 | ||||||
| 2025-08-07 | 13F | Nwam Llc | 2 600 | 0,00 | 280 | 9,38 | ||||
| 2025-07-18 | 13F | Bartlett & Co. Wealth Management Llc | 7 623 | 1,13 | 800 | 7,53 | ||||
| 2025-08-07 | 13F | Bradley & Co. Private Wealth Management, LLC | 10 | 0,00 | 1 | |||||
| 2025-08-11 | 13F | Sierra Capital LLC | 2 043 | 0 | ||||||
| 2025-07-24 | 13F | McKinley Carter Wealth Services, Inc. | 6 452 | −6,32 | 677 | −0,29 | ||||
| 2025-08-14 | 13F | Ieq Capital, Llc | 11 017 | 1 157 | ||||||
| 2025-07-16 | 13F | St Germain D J Co Inc | 82 | 0,00 | 9 | 0,00 | ||||
| 2025-08-06 | 13F | Walkner Condon Financial Advisors LLC | 6 596 | 0,00 | 692 | 6,30 | ||||
| 2025-07-24 | 13F | Jfs Wealth Advisors, Llc | 269 | 0,37 | 28 | 7,69 | ||||
| 2025-07-29 | 13F | First Bancorp, Inc /ME/ | 11 487 | 0,00 | 1 206 | 6,35 | ||||
| 2025-08-11 | 13F | FSA Wealth Management LLC | 490 | −3,92 | 56 | 3,70 | ||||
| 2025-08-05 | 13F | Huntington National Bank | 1 459 | 20,58 | ||||||
| 2025-08-14 | 13F | Stifel Financial Corp | 71 080 | 5,28 | 7 462 | 11,99 | ||||
| 2025-07-08 | 13F | Chemistry Wealth Management LLC | 2 370 | 0,00 | 249 | 6,44 | ||||
| 2025-07-17 | 13F | Summit Financial Strategies, Inc. | 9 954 | 0,00 | 1 045 | 6,31 | ||||
| 2025-08-13 | 13F | Keystone Financial Group | 28 980 | 1,35 | 3 042 | 7,80 | ||||
| 2025-07-22 | 13F | Tandem Investment Partners LLC | 3 125 | 328 | ||||||
| 2025-07-22 | 13F | Valeo Financial Advisors, LLC | 12 675 | 472,49 | 1 331 | 510,09 | ||||
| 2025-08-04 | 13F | Creekmur Asset Management LLC | 149 | 0,00 | 16 | 7,14 | ||||
| 2025-07-30 | 13F | Phillips Financial Management, Llc | 39 595 | 0,00 | 4 157 | 6,35 | ||||
| 2025-08-07 | 13F | Evoke Wealth, Llc | 8 077 | 848 | ||||||
| 2025-07-24 | 13F | Blair William & Co/il | 251 | −44,35 | 26 | −40,91 | ||||
| 2025-07-25 | 13F | Alpha Financial Partners, LLC | 2 067 | −16,35 | 217 | −10,70 | ||||
| 2025-08-07 | 13F | 49 Wealth Management, Llc | 2 183 | 0,37 | 229 | 7,01 | ||||
| 2025-07-18 | 13F | O'ROURKE & COMPANY, Inc | 6 594 | −5,14 | 692 | 0,87 | ||||
| 2025-07-10 | 13F | Pachira Investments Inc. | 3 615 | 379 | ||||||
| 2025-08-15 | 13F | Morgan Stanley | 968 679 | 6,42 | 101 692 | 13,20 | ||||
| 2025-08-04 | 13F | WNY Asset Management, LLC | 2 336 | −98,30 | 245 | −98,20 | ||||
| 2025-07-10 | 13F | Affiance Financial, LLC | 5 030 | 0,00 | 528 | 6,45 | ||||
| 2025-08-08 | 13F | Thoroughbred Financial Services, Llc | 4 684 | 3,42 | 0 | |||||
| 2025-08-14 | 13F | Brinker Capital Investments, LLC | 0 | −100,00 | 0 | |||||
| 2025-08-14 | 13F | Diversify Advisory Services, LLC | 4 197 | 4,56 | 453 | 16,80 | ||||
| 2025-08-27 | 13F | Tribridge Partners Financial LLC | 5 924 | 1 | ||||||
| 2025-07-29 | 13F | Chicago Partners Investment Group LLC | 6 591 | −3,43 | 718 | 6,54 | ||||
| 2025-08-08 | 13F | Tanglewood Legacy Advisors, LLC | 822 | 0,00 | 86 | 6,17 | ||||
| 2025-08-14 | 13F | Federation des caisses Desjardins du Quebec | 7 038 | 1,73 | 739 | 8,21 | ||||
| 2025-07-08 | 13F | Lowe Wealth Advisors, LLC | 200 | 0,00 | 21 | 5,26 | ||||
| 2025-07-30 | 13F | Fiduciary Family Office, Llc | 3 190 | −31,40 | 335 | −27,07 | ||||
| 2025-07-31 | 13F | Cambridge Investment Research Advisors, Inc. | 106 816 | 4,28 | 11 | 10,00 | ||||
| 2025-08-01 | 13F | Anson Capital, Inc. | 6 072 | 3,87 | 637 | 10,59 | ||||
| 2025-08-14 | 13F | Comerica Bank | 1 984 | −18,08 | 208 | −12,97 | ||||
| 2025-08-13 | 13F | Mount Yale Investment Advisors, LLC | 557 | 58 | ||||||
| 2025-07-23 | 13F | REAP Financial Group, LLC | 40 | 0,00 | 4 | 33,33 | ||||
| 2025-08-06 | 13F | Cherry Creek Investment Advisors, Inc. | 0 | −100,00 | 0 | |||||
| 2025-07-24 | 13F | Bryant Woods Investment Advisors, LLC | 80 608 | 3,70 | 8 462 | 10,30 | ||||
| 2025-08-12 | 13F | LPL Financial LLC | 297 844 | 1,92 | 31 268 | 8,40 | ||||
| 2025-08-14 | 13F | Fmr Llc | 9 314 | 1,60 | 978 | 8,08 |