Grundläggande statistik
| Institutionella ägare | 147 total, 147 long only, 0 short only, 0 long/short - change of 5,71% MRQ |
| Genomsnittlig portföljallokering | 0.2479 % - change of −20,07% MRQ |
| Institutionella aktier (lång) | 19 228 538 (ex 13D/G) - change of −6,08MM shares −24,03% MRQ |
| Institutionellt värde (lång) | $ 1 267 233 USD ($1000) |
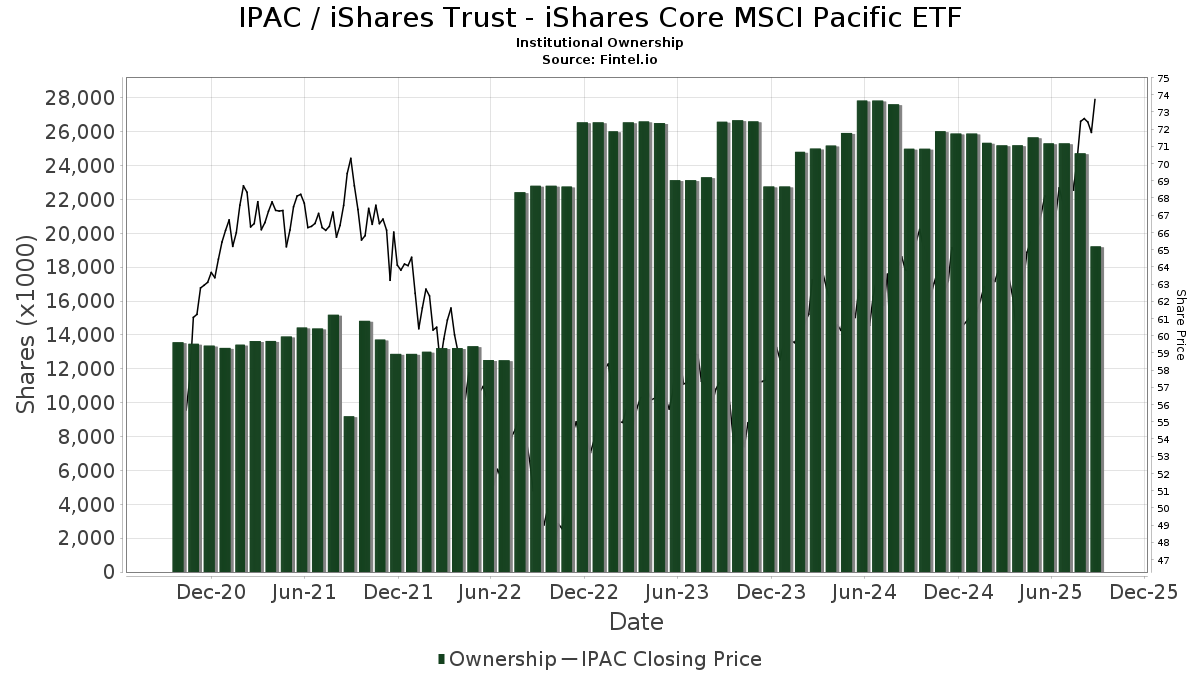
Institutionellt ägande och aktieägare
iShares Trust - iShares Core MSCI Pacific ETF (US:IPAC) har 147 Institutionella ägare och aktieägare som har lämnat in 13D/G- eller 13F-formulär till Securities Exchange Commission (SEC). Dessa institut innehar totalt 19,228,538 aktier. Största aktieägare inkluderar Ronald Blue Trust, Inc., Jpmorgan Chase & Co, Assetmark, Inc, Charles Schwab Investment Management Inc, Morgan Stanley, Mather Group, Llc., Envestnet Asset Management Inc, Stifel Financial Corp, Elm Partners Management LLC, and Cetera Investment Advisers .
iShares Trust - iShares Core MSCI Pacific ETF (ARCA:IPAC) Institutionell ägarstruktur visar institutioners och fonders nuvarande positioner i företaget, samt de senaste förändringarna i positionernas storlek. Större aktieägare kan vara enskilda investerare, fonder, hedgefonder eller institutioner. Bilaga 13D visar att investeraren äger (eller ägde) mer än 5% av företaget och avser (eller avsåg) att aktivt eftersträva en förändring av affärsstrategin. Schedule 13G indikerar en passiv investering på över 5%.
The share price as of September 8, 2025 is 74,02 / share. Previously, on September 9, 2024, the share price was 63,53 / share. This represents an increase of 16,51% over that period.
Fondsentimentets poäng
Fondsentimentet poängen(fka Ägarackumulation-poäng) visar vilka aktier som är mest köpta av fonder. Det är resultatet av en sofistikerad kvantitativ flerfaktormodell som identifierar företag med de högsta nivåerna av institutionell ackumulering. Poängsättningsmodellen använder en kombination av den totala ökningen av redovisade ägare, förändringarna i portföljallokeringarna för dessa ägare och andra mått. Siffran sträcker sig från 0 till 100, där högre siffror indikerar en högre nivå av ackumulering i förhållande till sina konkurrenter, och 50 är genomsnittet.
Uppdateringsfrekvens: Dagligen
Se Ownership Explorer, som innehåller en lista över de högst rankade företagen.
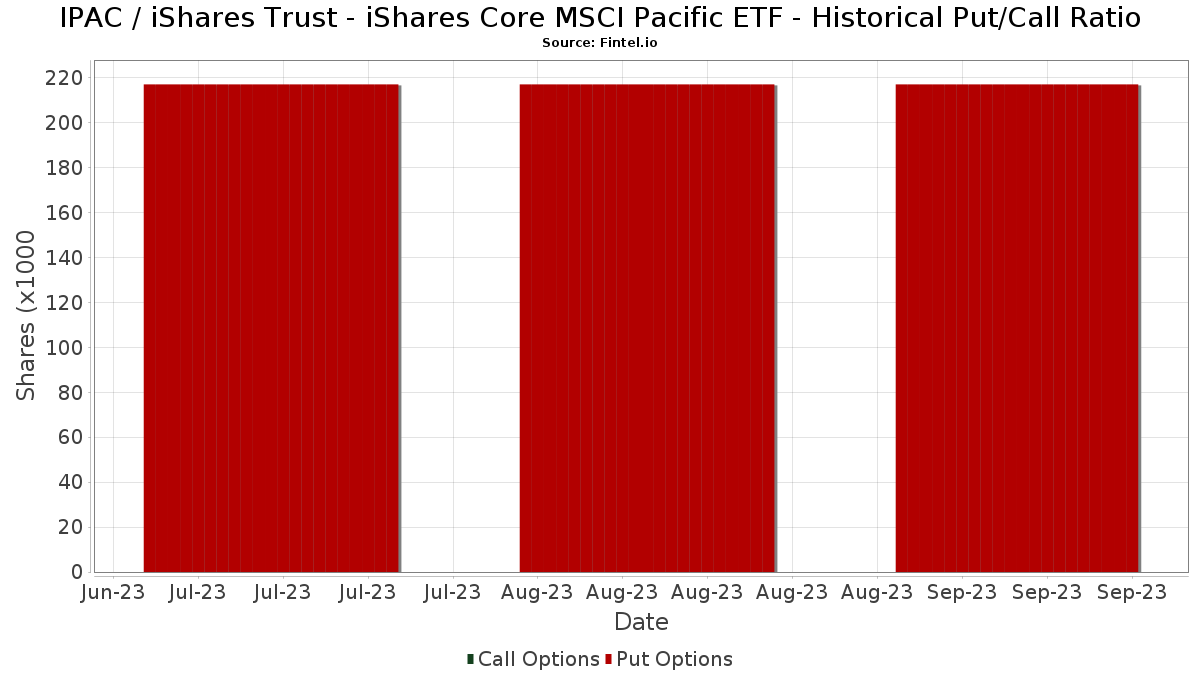
Institutionell sälj/köp-kvot
Förutom att rapportera vanliga eget kapital- och skuldemissioner måste institutioner med mer än 100MM tillgångar under förvaltning också avslöja sina innehav av sälj- och köpoptioner. Eftersom säljoptioner i allmänhet indikerar ett negativt sentiment och köpoptioner indikerar ett positivt sentiment, kan vi få en uppfattning om det övergripande institutionella sentimentet genom att plotta förhållandet mellan säljoptioner och köpoptioner. Diagrammet till höger visar det historiska förhållandet mellan sälj- och köpoptioner för detta instrument.
Genom att använda sälj/köp-kvoten som en indikator på aktieägarnas sentiment undviker man en av de största bristerna med att använda det totala institutionella ägandet, nämligen att en betydande del av de förvaltade tillgångarna investeras passivt för att följa index. Passivt förvaltade fonder köper vanligtvis inte optioner, så indikatorn för sälj/köp-kvoten ger en bättre bild av stämningen i aktivt förvaltade fonder.
13F- och NPORT-arkiveringar
Detaljer om 13F-arkiveringar är gratis. Detaljer om NP-arkiveringar kräver ett premiummedlemskap. Gröna rader indikerar nya positioner. Röda rader indikerar stängda positioner. Klicka på länk symbolen för att se hela transaktionshistoriken.
Uppgradera
för att låsa upp premiumdata och exportera till Excel ![]() .
.
| Fil Datum | Källa | Investerare | Typ | Genomsnittligt pris (beräknat) |
Aktier | Δ Aktier (%) |
Rapporterat värde (1000 USD) |
Δ Värde (%) |
Portföljallokering (%) |
|
|---|---|---|---|---|---|---|---|---|---|---|
| 2025-08-14 | 13F | Quantinno Capital Management LP | 18 392 | 1 264 | ||||||
| 2025-07-24 | 13F | Robertson Stephens Wealth Management, LLC | 39 972 | −13,33 | 2 746 | −4,32 | ||||
| 2025-08-08 | 13F | Avantax Advisory Services, Inc. | 3 998 | −26,11 | 275 | −18,45 | ||||
| 2025-07-08 | 13F | Lowe Wealth Advisors, LLC | 2 325 | 0,00 | 160 | 10,42 | ||||
| 2025-08-06 | 13F | Hoxton Planning & Management, LLC | 3 050 | 210 | ||||||
| 2025-05-01 | 13F | Bleakley Financial Group, LLC | 0 | −100,00 | 0 | −100,00 | ||||
| 2025-07-10 | 13F | Global Financial Private Client, LLC | 17 315 | 0,41 | 1 190 | 10,81 | ||||
| 2025-07-02 | 13F | Central Pacific Bank - Trust Division | 9 | 0,00 | 1 | |||||
| 2025-07-16 | 13F | Perigon Wealth Management, LLC | 28 158 | 1 934 | ||||||
| 2025-07-30 | 13F | Bogart Wealth, LLC | 710 | 0,00 | 49 | 9,09 | ||||
| 2025-07-30 | 13F | Rehmann Capital Advisory Group | 6 089 | 0,00 | 418 | 10,58 | ||||
| 2025-04-30 | 13F | Sofos Investments, Inc. | 56 255 | 9,77 | 3 501 | 11,71 | ||||
| 2025-08-14 | 13F | Royal Bank Of Canada | 26 625 | −47,21 | 1 829 | −41,71 | ||||
| 2025-05-09 | 13F | GeoWealth Management, LLC | 0 | −100,00 | 0 | |||||
| 2025-07-29 | 13F | Yoffe Investment Management, LLC | 9 221 | 0,25 | 633 | 10,66 | ||||
| 2025-07-10 | 13F | Wedmont Private Capital | 0 | −100,00 | 0 | |||||
| 2025-07-15 | 13F | Mather Group, Llc. | 653 467 | 8,97 | 44 893 | 20,28 | ||||
| 2025-08-13 | 13F | Invesco Ltd. | 0 | −100,00 | 0 | |||||
| 2025-07-10 | 13F | Security National Bank | 2 080 | 143 | ||||||
| 2025-07-09 | 13F | VisionPoint Advisory Group, LLC | 8 494 | 584 | ||||||
| 2025-08-25 | 13F/A | Promus Capital, LLC | 214 | −33,33 | 15 | −26,32 | ||||
| 2025-07-18 | 13F | Tanager Wealth Management LLP | 10 635 | 731 | ||||||
| 2025-08-15 | 13F | Tower Research Capital LLC (TRC) | 0 | −100,00 | 0 | |||||
| 2025-07-09 | 13F | Sapient Capital Llc | 8 317 | 571 | ||||||
| 2025-07-24 | 13F | Blair William & Co/il | 139 | 10 | ||||||
| 2025-08-14 | 13F | GWM Advisors LLC | 5 410 | −0,92 | 372 | 9,44 | ||||
| 2025-07-16 | 13F | John W. Brooker & Co., CPAs | 0 | −100,00 | 0 | |||||
| 2025-08-04 | 13F | Municipal Employees' Retirement System of Michigan | 0 | −100,00 | 0 | |||||
| 2025-07-28 | 13F | Harbour Investments, Inc. | 21 | 0,00 | 1 | 0,00 | ||||
| 2025-07-08 | 13F | Nbc Securities, Inc. | 349 | 0,00 | 0 | |||||
| 2025-08-12 | 13F | Proequities, Inc. | 0 | 0 | ||||||
| 2025-07-11 | 13F | Mandatum Life Insurance Co Ltd | 155 637 | 24,06 | 10 692 | 36,94 | ||||
| 2025-07-24 | 13F | Ronald Blue Trust, Inc. | 6 996 027 | −3,37 | 480 627 | 6,66 | ||||
| 2025-07-31 | 13F | GenTrust, LLC | 137 140 | −2,23 | 9 422 | 7,93 | ||||
| 2025-07-23 | 13F | Family Legacy, Inc. | 24 220 | 1,59 | 1 664 | 12,14 | ||||
| 2025-08-12 | 13F | BlackRock, Inc. | 205 | 0,00 | 14 | 16,67 | ||||
| 2025-08-05 | 13F | Elm Partners Management LLC | 476 862 | 24,89 | 32 760 | 37,86 | ||||
| 2025-08-12 | 13F | Howe & Rusling Inc | 0 | −100,00 | 0 | −100,00 | ||||
| 2025-08-14 | 13F | Qube Research & Technologies Ltd | 0 | −100,00 | 0 | |||||
| 2025-08-08 | 13F | Compass Wealth Management LLC | 2 961 | −3,27 | 203 | 6,84 | ||||
| 2025-08-14 | 13F | Cardiff Park Advisors, Llc | 1 291 | 0,00 | 89 | 10,00 | ||||
| 2025-07-25 | 13F | Cwm, Llc | 33 730 | 2 558,00 | 2 | |||||
| 2025-08-07 | 13F | Resources Investment Advisors, LLC. | 4 974 | 0,48 | 342 | 10,71 | ||||
| 2025-08-08 | 13F | Creative Planning | 54 251 | −3,60 | 3 727 | 6,42 | ||||
| 2025-08-11 | 13F | United Capital Financial Advisers, Llc | 83 749 | −6,14 | 5 754 | 3,60 | ||||
| 2025-08-08 | 13F | ERTS Wealth Advisors, LLC | 135 449 | −38,78 | 9 305 | −32,43 | ||||
| 2025-08-14 | 13F | Raymond James Financial Inc | 6 076 | 1,57 | 417 | 12,10 | ||||
| 2025-08-15 | 13F | Morgan Stanley | 882 289 | 0,37 | 60 613 | 10,79 | ||||
| 2025-08-07 | 13F | Allworth Financial LP | 3 998 | 0,00 | 275 | 7,45 | ||||
| 2025-08-12 | 13F | Charles Schwab Investment Management Inc | 965 523 | −3,54 | 66 331 | 6,47 | ||||
| 2025-07-31 | 13F | CVA Family Office, LLC | 1 085 | 0,00 | 75 | 10,45 | ||||
| 2025-08-07 | 13F | Addison Advisors LLC | 2 690 | 0,00 | 185 | 10,18 | ||||
| 2025-07-31 | 13F | Wealthfront Advisers Llc | 0 | −100,00 | 0 | |||||
| 2025-07-10 | 13F | Redhawk Wealth Advisors, Inc. | 0 | −100,00 | 0 | |||||
| 2025-08-04 | 13F | Savvy Advisors, Inc. | 3 336 | 229 | ||||||
| 2025-08-19 | 13F | Delos Wealth Advisors, LLC | 10 | 1 | ||||||
| 2025-08-06 | 13F | Legacy Investment Solutions, LLC | 43 | 0,00 | 3 | 0,00 | ||||
| 2025-08-14 | 13F | Mml Investors Services, Llc | 3 900 | 18,47 | 0 | |||||
| 2025-08-08 | 13F | Pnc Financial Services Group, Inc. | 31 | −24,39 | 2 | 0,00 | ||||
| 2025-08-12 | 13F | CIBC Private Wealth Group, LLC | 973 | 13,80 | 67 | 40,43 | ||||
| 2025-05-15 | 13F | Mercer Global Advisors Inc /adv | 0 | −100,00 | 0 | |||||
| 2025-08-08 | 13F | Financial Gravity Companies, Inc. | 59 306 | 16,37 | 4 074 | 30,87 | ||||
| 2025-08-12 | 13F | Atlas Capital Advisors Llc | 27 968 | −13,96 | 1 921 | −5,04 | ||||
| 2025-07-08 | 13F/A | Salem Investment Counselors Inc | 301 | 0,00 | 21 | 11,11 | ||||
| 2025-08-05 | 13F | Harel Insurance Investments & Financial Services Ltd. | 5 434 | 0,00 | 0 | |||||
| 2025-05-09 | 13F | TD Waterhouse Canada Inc. | 0 | −100,00 | 0 | |||||
| 2025-08-11 | 13F | Private Advisor Group, LLC | 4 098 | 282 | ||||||
| 2025-08-06 | 13F | Walkner Condon Financial Advisors LLC | 4 772 | 0,91 | 328 | 11,22 | ||||
| 2025-08-12 | 13F | MAI Capital Management | 2 223 | 0,00 | 153 | 10,14 | ||||
| 2025-08-05 | 13F | Dunhill Financial, LLC | 194 | 13 | ||||||
| 2025-07-21 | 13F | Greenwood Capital Associates Llc | 163 950 | 4,53 | 11 263 | 15,39 | ||||
| 2025-08-14 | 13F | Integrated Wealth Concepts LLC | 3 732 | 2,70 | 256 | 13,27 | ||||
| 2025-08-06 | 13F | Legacy Wealth Managment, LLC/ID | 43 | 0,00 | 3 | 0,00 | ||||
| 2025-05-02 | 13F | Signaturefd, Llc | 0 | −100,00 | 0 | |||||
| 2025-04-04 | 13F | Quent Capital, LLC | 0 | −100,00 | 0 | |||||
| 2025-08-15 | 13F | Captrust Financial Advisors | 4 164 | 0,87 | 286 | 11,72 | ||||
| 2025-08-12 | 13F | Steward Partners Investment Advisory, Llc | 376 | 14,98 | 26 | 25,00 | ||||
| 2025-07-24 | 13F | Williams & Novak, LLC | 10 765 | −12,23 | 740 | −3,15 | ||||
| 2025-08-14 | 13F | Susquehanna International Group, Llp | 75 291 | 234,42 | 5 172 | 269,16 | ||||
| 2025-08-14 | 13F | IHT Wealth Management, LLC | 3 613 | 248 | ||||||
| 2025-08-11 | 13F | Strategic Wealth Partners, Ltd. | 1 484 | 102 | ||||||
| 2025-05-14 | 13F | Capital Analysts, Inc. | 0 | −100,00 | 0 | |||||
| 2025-08-20 | 13F/A | Coppell Advisory Solutions LLC | 6 428 | 442 | ||||||
| 2025-08-01 | 13F | Envestnet Asset Management Inc | 603 458 | −5,69 | 41 453 | 4,09 | ||||
| 2025-07-22 | 13F | Coastal Investment Advisors, Inc. | 4 | 0,00 | 0 | |||||
| 2025-08-13 | 13F | EverSource Wealth Advisors, LLC | 6 | 0,00 | 0 | |||||
| 2025-07-21 | 13F | Mirae Asset Global Investments Co., Ltd. | 7 730 | 6,47 | 531 | 16,70 | ||||
| 2025-07-24 | 13F | JNBA Financial Advisors | 0 | −100,00 | 0 | |||||
| 2025-07-23 | 13F | Vontobel Holding Ltd. | 20 403 | 1,57 | 1 402 | 12,08 | ||||
| 2025-08-14 | 13F | UBS Group AG | 89 476 | −6,53 | 6 147 | 3,19 | ||||
| 2025-07-24 | 13F | Stonebridge Financial Group, LLC | 0 | −100,00 | 0 | |||||
| 2025-08-08 | 13F | Cetera Investment Advisers | 399 916 | −10,49 | 27 474 | −1,20 | ||||
| 2025-07-23 | 13F | Prime Capital Investment Advisors, LLC | 71 965 | −1,06 | 4 944 | 9,19 | ||||
| 2025-08-14 | 13F | Comerica Bank | 916 | 0,00 | 63 | 8,77 | ||||
| 2025-07-23 | 13F | Integris Wealth Management, LLC | 79 110 | −1,05 | 5 435 | 9,20 | ||||
| 2025-08-12 | 13F | Jpmorgan Chase & Co | 1 823 056 | 61,26 | 125 244 | 78,00 | ||||
| 2025-04-22 | 13F/A | NorthRock Partners, LLC | 0 | −100,00 | 0 | −100,00 | ||||
| 2025-05-09 | 13F | Atria Wealth Solutions, Inc. | 0 | −100,00 | 0 | |||||
| 2025-08-04 | 13F | B&l Asset Management Llc | 8 750 | 601 | ||||||
| 2025-08-28 | NP | ELM - Elm Market Navigator ETF | 293 528 | 11,04 | 20 165 | 22,57 | ||||
| 2025-08-04 | 13F | AlphaStar Capital Management, LLC | 175 984 | 0,86 | 12 090 | 11,34 | ||||
| 2025-08-12 | 13F | LPL Financial LLC | 93 974 | 7,34 | 6 456 | 18,50 | ||||
| 2025-07-25 | 13F | Inman Jager Wealth Management, LLC | 14 139 | −3,85 | 971 | 6,12 | ||||
| 2025-07-22 | 13F | Belpointe Asset Management LLC | 4 739 | −3,13 | 326 | 6,91 | ||||
| 2025-08-05 | 13F | Bank Of Montreal /can/ | 482 | −15,44 | 33 | −5,71 | ||||
| 2025-08-15 | 13F | CI Private Wealth, LLC | 9 644 | −1,03 | 663 | 9,24 | ||||
| 2025-08-07 | 13F | FDx Advisors, Inc. | 48 948 | −5,47 | 3 | 0,00 | ||||
| 2025-08-14 | 13F | Vident Advisory, LLC | 140 242 | 2,67 | 9 635 | 13,31 | ||||
| 2025-07-22 | 13F | Iron Horse Wealth Management, LLC | 340 | 19,72 | 23 | 35,29 | ||||
| 2025-08-15 | 13F | Blue Edge Capital, LLC | 120 729 | 0,01 | 8 294 | 10,40 | ||||
| 2025-07-17 | 13F | Guyasuta Investment Advisors Inc | 4 077 | 0,00 | 280 | 10,67 | ||||
| 2025-07-03 | 13F | Garde Capital, Inc. | 142 939 | 0,64 | 9 820 | 11,09 | ||||
| 2025-07-07 | 13F | Kings Path Partners LLC | 586 | −47,58 | 40 | −42,03 | ||||
| 2025-08-14 | 13F | Vista Private Wealth Partners. LLC | 37 724 | 7,60 | 2 592 | 18,74 | ||||
| 2025-08-14 | 13F | Ameriprise Financial Inc | 6 284 | −6,64 | 432 | 3,11 | ||||
| 2025-07-29 | 13F | APCM Wealth Management for Individuals | 3 014 | 207 | ||||||
| 2025-08-11 | 13F | HighTower Advisors, LLC | 13 670 | 7,63 | 939 | 18,86 | ||||
| 2025-08-13 | 13F | Millington Financial Advisors, LLC | 26 822 | −8,28 | 1 886 | 7,53 | ||||
| 2025-08-04 | 13F | Assetmark, Inc | 989 465 | −10,59 | 67 976 | −1,31 | ||||
| 2025-08-13 | 13F | Allie Family Office LLC | 3 167 | 0,00 | 218 | 3,33 | ||||
| 2025-08-06 | 13F | AE Wealth Management LLC | 570 | 216,67 | 39 | 254,55 | ||||
| 2025-08-14 | 13F | Fmr Llc | 7 556 | −2,39 | 519 | 7,90 | ||||
| 2025-08-14 | 13F | Wells Fargo & Company/mn | 138 231 | 15,03 | 9 496 | 26,97 | ||||
| 2025-08-08 | 13F | Gts Securities Llc | 10 241 | 704 | ||||||
| 2025-08-11 | 13F | PAX Financial Group, LLC | 26 661 | −15,13 | 1 832 | −6,34 | ||||
| 2025-08-14 | 13F | Citadel Advisors Llc | 313 669 | 1 532,08 | 21 549 | 1 701,76 | ||||
| 2025-08-06 | 13F | Csenge Advisory Group | 9 073 | −3,46 | 612 | 5,15 | ||||
| 2025-07-31 | 13F | Cambridge Investment Research Advisors, Inc. | 8 558 | 24,79 | 1 | |||||
| 2025-07-25 | 13F | Richardson Financial Services Inc. | 19 560 | −9,31 | 1 339 | −0,30 | ||||
| 2025-08-05 | 13F | Mission Wealth Management, Lp | 3 650 | 0,00 | 251 | 10,13 | ||||
| 2025-08-14 | 13F | Lazard Asset Management Llc | 94 159 | −19,32 | 6 | −14,29 | ||||
| 2025-07-29 | 13F | Koshinski Asset Management, Inc. | 2 998 | 206 | ||||||
| 2025-07-15 | 13F | LVZ Advisors, Inc. | 0 | −100,00 | 0 | |||||
| 2025-05-01 | 13F | Ballentine Partners, LLC | 0 | −100,00 | 0 | |||||
| 2025-07-24 | 13F | Brandywine Oak Private Wealth Llc | 9 446 | 0,00 | 649 | 10,39 | ||||
| 2025-09-04 | 13F/A | Advisor Group Holdings, Inc. | 196 038 | 116,28 | 12 724 | 125,51 | ||||
| 2025-07-25 | 13F | Presilium Private Wealth, Llc | 28 112 | −45,32 | 1 931 | −39,66 | ||||
| 2025-04-16 | 13F | Wealth Enhancement Advisory Services, Llc | 0 | −100,00 | 0 | |||||
| 2025-07-30 | 13F | TFB Advisors LLC | 3 094 | −5,38 | 213 | 4,43 | ||||
| 2025-08-13 | 13F | Northwestern Mutual Wealth Management Co | 2 056 | 34,47 | 141 | 48,42 | ||||
| 2025-07-14 | 13F | Southland Equity Partners LLC | 4 223 | −0,66 | 290 | 9,85 | ||||
| 2025-08-11 | 13F | Principal Securities, Inc. | 0 | −100,00 | 0 | |||||
| 2025-07-18 | 13F | Truist Financial Corp | 40 441 | −0,94 | 2 778 | 9,37 | ||||
| 2025-08-12 | 13F | AlphaCore Capital LLC | 195 | 0,00 | 13 | 8,33 | ||||
| 2025-07-31 | 13F | Brian Low Financial Group, Llc | 4 724 | 325 | ||||||
| 2025-08-11 | 13F | Aptus Capital Advisors, LLC | 56 | 5,66 | 4 | 0,00 | ||||
| 2025-08-06 | 13F | Commonwealth Equity Services, Llc | 12 264 | −15,26 | 1 | |||||
| 2025-08-13 | 13F | Willis Johnson & Associates, Inc. | 34 776 | −4,92 | 2 389 | 4,96 | ||||
| 2025-08-15 | 13F | Keel Point, LLC | 3 122 | 214 | ||||||
| 2025-08-14 | 13F | Bank Of America Corp /de/ | 232 501 | −27,57 | 15 973 | −20,06 | ||||
| 2025-08-14 | 13F | CoreCap Advisors, LLC | 16 | 0,00 | 1 | |||||
| 2025-07-23 | 13F | BankPlus Trust Department | 38 | 0,00 | 3 | 0,00 | ||||
| 2025-07-11 | 13F | Farther Finance Advisors, LLC | 4 679 | −5,30 | 321 | 4,56 | ||||
| 2025-07-23 | 13F | Godsey & Gibb Associates | 0 | −100,00 | 0 | |||||
| 2025-07-24 | 13F | Us Bancorp \de\ | 8 030 | 0,51 | 552 | 10,87 | ||||
| 2025-07-18 | 13F | Dogwood Wealth Management LLC | 31 748 | −9,17 | 2 145 | −1,38 | ||||
| 2025-08-08 | 13F | Smithfield Trust Co | 352 399 | 12,00 | 24 | 26,32 | ||||
| 2025-05-12 | 13F | Aveo Capital Partners, LLC | 0 | −100,00 | 0 | |||||
| 2025-07-23 | 13F | Columbus Macro, LLC | 88 990 | −26,47 | 6 114 | −18,85 | ||||
| 2025-08-14 | 13F | Jane Street Group, Llc | 0 | −100,00 | 0 | |||||
| 2025-08-13 | 13F | Northern Trust Corp | 10 565 | 0,00 | 726 | 10,35 | ||||
| 2025-08-14 | 13F | Stifel Financial Corp | 549 389 | 2,05 | 37 743 | 12,65 | ||||
| 2025-07-21 | 13F | Fortis Capital Advisors, LLC | 4 739 | −3,01 | 326 | 6,91 | ||||
| 2025-08-13 | 13F | Jones Financial Companies Lllp | 1 213 | 16,97 | 83 | 27,69 | ||||
| 2025-08-14 | 13F | Modern Wealth Management, LLC | 3 021 | 208 | ||||||
| 2025-08-01 | 13F | Bessemer Group Inc | 206 182 | 22,26 | 14 | 40,00 | ||||
| 2025-08-12 | 13F | O'shaughnessy Asset Management, Llc | 594 | 4 142,86 | 41 | |||||
| 2025-08-08 | 13F | Capital Investment Advisory Services, LLC | 1 646 | −5,78 | 113 | 4,63 | ||||
| 2025-07-23 | 13F | Element Wealth, LLC | 8 878 | −7,16 | 610 | 2,35 | ||||
| 2025-08-12 | 13F | Pathstone Holdings, LLC | 3 930 | 0,00 | 270 | 10,25 | ||||
| 2025-08-12 | 13F | Global Retirement Partners, LLC | 236 | −7,45 | 16 | 6,67 | ||||
| 2025-04-24 | 13F | Wingate Wealth Advisors, Inc. | 0 | −100,00 | 0 | |||||
| 2025-08-11 | 13F | Edgemoor Investment Advisors, Inc. | 5 310 | 0,00 | 365 | 10,30 | ||||
| 2025-08-13 | 13F | Amundi | 87 887 | −9,65 | 6 027 | 2,90 | ||||
| 2025-05-15 | 13F | Oxford Financial Group Ltd | 0 | −100,00 | 0 | |||||
| 2025-08-06 | 13F | Hallmark Capital Management Inc | 158 671 | −3,71 | 10 901 | 6,28 | ||||
| 2025-07-25 | 13F | Concurrent Investment Advisors, LLC | 7 279 | 500 | ||||||
| 2025-08-14 | 13F | Hrt Financial Lp | 0 | −100,00 | 0 |
Other Listings
| MX:IPAC |