Grundläggande statistik
| Institutionella ägare | 151 total, 151 long only, 0 short only, 0 long/short - change of 3,40% MRQ |
| Genomsnittlig portföljallokering | 0.3952 % - change of −5,51% MRQ |
| Institutionella aktier (lång) | 14 352 548 (ex 13D/G) - change of −0,27MM shares −1,88% MRQ |
| Institutionellt värde (lång) | $ 298 878 USD ($1000) |
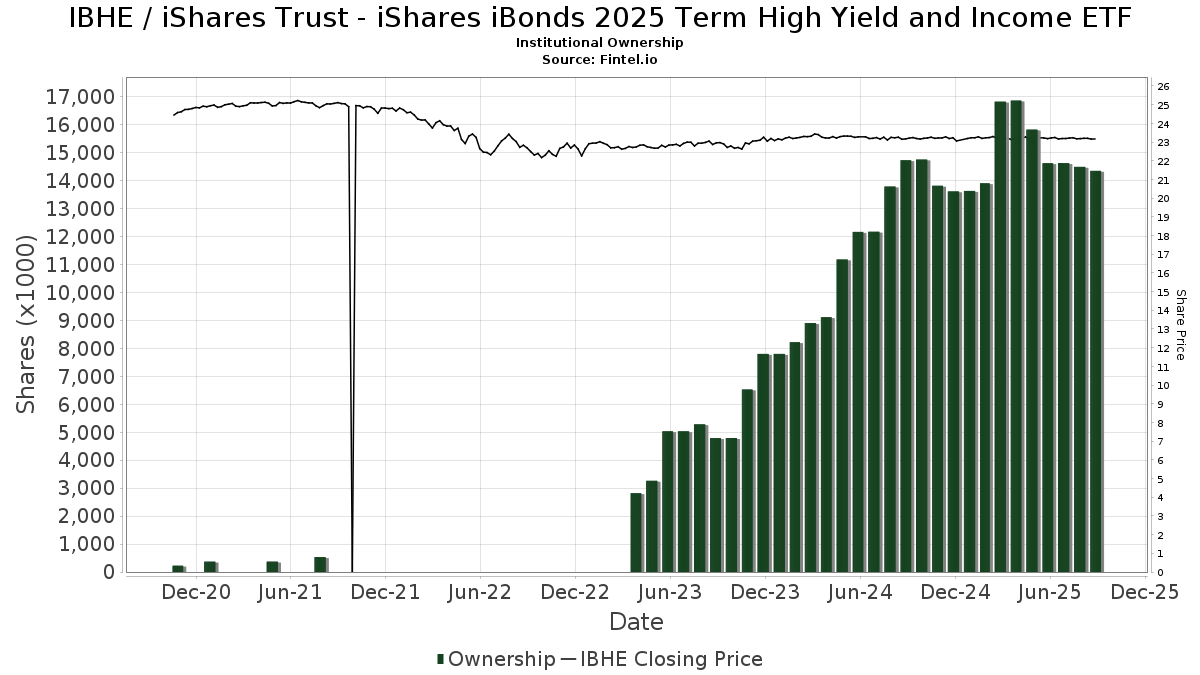
Institutionellt ägande och aktieägare
iShares Trust - iShares iBonds 2025 Term High Yield and Income ETF (US:IBHE) har 151 Institutionella ägare och aktieägare som har lämnat in 13D/G- eller 13F-formulär till Securities Exchange Commission (SEC). Dessa institut innehar totalt 14,352,548 aktier. Största aktieägare inkluderar LPL Financial LLC, Morgan Stanley, SkyView Investment Advisors, LLC, Resources Investment Advisors, LLC., Arrow Financial Corp, Mid-American Wealth Advisory Group, Inc., Raymond James Financial Inc, Wells Fargo & Company/mn, EP Wealth Advisors, Inc., and Scissortail Wealth Management, LLC .
iShares Trust - iShares iBonds 2025 Term High Yield and Income ETF (BATS:IBHE) Institutionell ägarstruktur visar institutioners och fonders nuvarande positioner i företaget, samt de senaste förändringarna i positionernas storlek. Större aktieägare kan vara enskilda investerare, fonder, hedgefonder eller institutioner. Bilaga 13D visar att investeraren äger (eller ägde) mer än 5% av företaget och avser (eller avsåg) att aktivt eftersträva en förändring av affärsstrategin. Schedule 13G indikerar en passiv investering på över 5%.
The share price as of September 11, 2025 is 23,18 / share. Previously, on September 12, 2024, the share price was 23,19 / share. This represents a decline of 0,06% over that period.
Fondsentimentets poäng
Fondsentimentet poängen(fka Ägarackumulation-poäng) visar vilka aktier som är mest köpta av fonder. Det är resultatet av en sofistikerad kvantitativ flerfaktormodell som identifierar företag med de högsta nivåerna av institutionell ackumulering. Poängsättningsmodellen använder en kombination av den totala ökningen av redovisade ägare, förändringarna i portföljallokeringarna för dessa ägare och andra mått. Siffran sträcker sig från 0 till 100, där högre siffror indikerar en högre nivå av ackumulering i förhållande till sina konkurrenter, och 50 är genomsnittet.
Uppdateringsfrekvens: Dagligen
Se Ownership Explorer, som innehåller en lista över de högst rankade företagen.
Institutionell sälj/köp-kvot
Förutom att rapportera vanliga eget kapital- och skuldemissioner måste institutioner med mer än 100MM tillgångar under förvaltning också avslöja sina innehav av sälj- och köpoptioner. Eftersom säljoptioner i allmänhet indikerar ett negativt sentiment och köpoptioner indikerar ett positivt sentiment, kan vi få en uppfattning om det övergripande institutionella sentimentet genom att plotta förhållandet mellan säljoptioner och köpoptioner. Diagrammet till höger visar det historiska förhållandet mellan sälj- och köpoptioner för detta instrument.
Genom att använda sälj/köp-kvoten som en indikator på aktieägarnas sentiment undviker man en av de största bristerna med att använda det totala institutionella ägandet, nämligen att en betydande del av de förvaltade tillgångarna investeras passivt för att följa index. Passivt förvaltade fonder köper vanligtvis inte optioner, så indikatorn för sälj/köp-kvoten ger en bättre bild av stämningen i aktivt förvaltade fonder.

13F- och NPORT-arkiveringar
Detaljer om 13F-arkiveringar är gratis. Detaljer om NP-arkiveringar kräver ett premiummedlemskap. Gröna rader indikerar nya positioner. Röda rader indikerar stängda positioner. Klicka på länk symbolen för att se hela transaktionshistoriken.
Uppgradera
för att låsa upp premiumdata och exportera till Excel ![]() .
.
| Fil Datum | Källa | Investerare | Typ | Genomsnittligt pris (beräknat) |
Aktier | Δ Aktier (%) |
Rapporterat värde (1000 USD) |
Δ Värde (%) |
Portföljallokering (%) |
|
|---|---|---|---|---|---|---|---|---|---|---|
| 2025-07-18 | 13F | Pure Financial Advisors, Inc. | 11 207 | 261 | ||||||
| 2025-07-29 | 13F | Stratos Wealth Partners, LTD. | 227 463 | 5,34 | 5 290 | 5,40 | ||||
| 2025-08-06 | 13F | Savant Capital, LLC | 31 141 | 0,00 | 724 | 0,14 | ||||
| 2025-08-08 | 13F | Wrapmanager Inc | 48 913 | 2,04 | 1 137 | 2,16 | ||||
| 2025-07-22 | 13F | Valley National Advisers Inc | 3 231 | 0,00 | 0 | |||||
| 2025-08-13 | 13F | Lido Advisors, LLC | 139 467 | −5,62 | 3 243 | −5,56 | ||||
| 2025-07-14 | 13F | UMA Financial Services, Inc. | 1 000 | 23 | ||||||
| 2025-08-14 | 13F | Wells Fargo & Company/mn | 510 110 | 0,93 | 11 863 | 0,99 | ||||
| 2025-08-07 | 13F | Kestra Private Wealth Services, Llc | 162 506 | 1,03 | 3 779 | 1,10 | ||||
| 2025-08-01 | 13F | Heritage Wealth Management, Inc./Texas | 8 603 | 200 | ||||||
| 2025-08-12 | 13F | Laurel Wealth Advisors LLC | 23 255 | 2 225,50 | 1 | −95,65 | ||||
| 2025-07-11 | 13F | Farther Finance Advisors, LLC | 1 525 | 0,00 | 35 | 0,00 | ||||
| 2025-08-12 | 13F | BlackRock, Inc. | 0 | −100,00 | 0 | |||||
| 2025-05-12 | 13F | Fmr Llc | 0 | −100,00 | 0 | |||||
| 2025-07-25 | 13F | Cwm, Llc | 1 755 | −11,76 | 0 | |||||
| 2025-05-15 | 13F | Two Sigma Securities, Llc | 0 | −100,00 | 0 | −100,00 | ||||
| 2025-07-15 | 13F | North Star Investment Management Corp. | 2 700 | 0,00 | 63 | 0,00 | ||||
| 2025-08-14 | 13F | Mml Investors Services, Llc | 78 233 | −5,68 | 2 | 0,00 | ||||
| 2025-08-15 | 13F | High Falls Advisors, Inc | 14 089 | 26,91 | 328 | 26,74 | ||||
| 2025-08-06 | 13F | Commonwealth Equity Services, Llc | 143 788 | −1,22 | 3 | 0,00 | ||||
| 2025-08-14 | 13F | Ameriprise Financial Inc | 0 | −100,00 | 0 | |||||
| 2025-08-11 | 13F | Arrow Financial Corp | 868 676 | −30,55 | 20 201 | −30,50 | ||||
| 2025-08-14 | 13F | Susquehanna International Group, Llp | 62 995 | 181,72 | 1 465 | 182,08 | ||||
| 2025-08-05 | 13F | Sigma Planning Corp | 19 182 | −20,73 | 446 | −20,64 | ||||
| 2025-08-15 | 13F | Howland Capital Management Llc | 32 240 | 0,00 | 750 | 0,00 | ||||
| 2025-08-07 | 13F | Bradley & Co. Private Wealth Management, LLC | 1 000 | 0,00 | 23 | 0,00 | ||||
| 2025-08-14 | 13F | Smartleaf Asset Management LLC | 101 | 0,00 | 2 | 0,00 | ||||
| 2025-08-14 | 13F | Eight 31 Financial Llc | 77 894 | −1,29 | 1 811 | −1,20 | ||||
| 2025-07-30 | 13F | Strategic Blueprint, LLC | 10 929 | 4,58 | 254 | 4,96 | ||||
| 2025-08-04 | 13F | Cottage Street Advisors LLC | 87 991 | 8,75 | 2 046 | 8,83 | ||||
| 2025-08-12 | 13F | Coldstream Capital Management Inc | 0 | −100,00 | 0 | |||||
| 2025-07-30 | 13F | Princeton Global Asset Management LLC | 1 342 | 1,28 | 31 | 3,33 | ||||
| 2025-07-15 | 13F | Fifth Third Bancorp | 1 800 | 0,00 | 42 | 0,00 | ||||
| 2025-07-08 | 13F | Richard P Slaughter Associates Inc | 0 | −100,00 | 0 | |||||
| 2025-08-15 | 13F | Captrust Financial Advisors | 11 522 | 268 | ||||||
| 2025-08-05 | 13F | Blue Barn Wealth, LLC | 17 338 | 0,00 | 403 | 0,25 | ||||
| 2025-08-11 | 13F | Aptus Capital Advisors, LLC | 991 | 0,41 | 23 | 4,55 | ||||
| 2025-07-28 | 13F | Harbour Investments, Inc. | 535 | 0,00 | 12 | 0,00 | ||||
| 2025-08-11 | 13F | VSM Wealth Advisory, LLC | 378 | 0,00 | 9 | 0,00 | ||||
| 2025-08-14 | 13F | Great Valley Advisor Group, Inc. | 23 027 | −14,64 | 536 | −14,67 | ||||
| 2025-08-08 | 13F | Keyvantage Wealth, Llc | 9 910 | 1,32 | 230 | 1,32 | ||||
| 2025-08-12 | 13F | Global Retirement Partners, LLC | 8 367 | 6,25 | 195 | 6,59 | ||||
| 2025-08-27 | 13F/A | Brinker Capital Investments, LLC | 12 728 | −44,02 | 296 | −43,94 | ||||
| 2025-08-14 | 13F | Comerica Bank | 1 903 | 0,00 | 44 | 0,00 | ||||
| 2025-07-24 | 13F | Ronald Blue Trust, Inc. | 2 803 | 0,36 | 65 | 1,56 | ||||
| 2025-07-24 | 13F/A | TFR Capital, LLC. | 8 606 | −6,83 | 200 | −6,54 | ||||
| 2025-08-14 | 13F | Wiley Bros.-aintree Capital, Llc | 12 212 | 284 | ||||||
| 2025-08-14 | 13F | Sentinus, LLC | 16 640 | 0,00 | 387 | 0,00 | ||||
| 2025-07-23 | 13F | Madden Advisory Services, Inc. | 17 220 | 13,84 | 400 | 13,96 | ||||
| 2025-08-12 | 13F | Cowa, Llc | 114 852 | 8,00 | 2 670 | 8,01 | ||||
| 2025-08-14 | 13F | Royal Bank Of Canada | 110 632 | 18,80 | 2 572 | 18,85 | ||||
| 2025-08-04 | 13F | Pensionmark Financial Group, Llc | 14 400 | 0,00 | 335 | 0,00 | ||||
| 2025-08-06 | 13F | Rialto Wealth Management, LLC | 0 | −100,00 | 0 | |||||
| 2025-07-08 | 13F | Nbc Securities, Inc. | 1 988 | 0,00 | 0 | |||||
| 2025-07-25 | 13F | Commonwealth Financial Services, LLC | 122 798 | −19,47 | 2 856 | −19,42 | ||||
| 2025-08-14 | 13F | UBS Group AG | 40 981 | −30,80 | 953 | −30,74 | ||||
| 2025-07-16 | 13F | Littlejohn Financial Services, Inc. | 24 790 | −19,06 | 576 | −18,99 | ||||
| 2025-07-25 | 13F | Endowment Wealth Management, Inc. | 67 305 | 5,37 | 1 565 | 5,46 | ||||
| 2025-08-08 | 13F | Avantax Advisory Services, Inc. | 209 321 | 18,78 | 4 868 | 18,85 | ||||
| 2025-07-22 | 13F | Mascoma Wealth Management LLC | 13 932 | 0,00 | 324 | 0,00 | ||||
| 2025-08-14 | 13F | Strategic Wealth Designers | 18 | 0 | ||||||
| 2025-08-05 | 13F | Cherry Tree Wealth Management, LLC | 2 642 | 0,00 | 61 | 0,00 | ||||
| 2025-08-13 | 13F | Baltimore-Washington Financial Advisors, Inc. | 49 273 | −8,13 | 1 146 | −8,11 | ||||
| 2025-08-14 | 13F | Mercer Global Advisors Inc /adv | 8 995 | 2,15 | 209 | 2,45 | ||||
| 2025-08-14 | 13F | Hrt Financial Lp | 11 443 | 0 | ||||||
| 2025-08-11 | 13F | PFG Private Wealth Management, LLC | 0 | −100,00 | 0 | |||||
| 2025-08-11 | 13F | Summit Wealth Partners, LLC | 11 676 | −25,36 | 272 | −25,34 | ||||
| 2025-08-07 | 13F | Resources Investment Advisors, LLC. | 871 874 | 4,65 | 20 275 | 4,72 | ||||
| 2025-05-16 | 13F | Coppell Advisory Solutions LLC | 0 | −100,00 | 0 | |||||
| 2025-07-24 | 13F | IFP Advisors, Inc | 53 590 | −23,21 | 1 246 | −23,13 | ||||
| 2025-08-26 | 13F/A | Thrivent Financial For Lutherans | 0 | −100,00 | 0 | |||||
| 2025-07-17 | 13F | Johnson Bixby & Associates, LLC | 20 350 | 3,73 | 473 | 3,96 | ||||
| 2025-08-12 | 13F | Proequities, Inc. | 0 | 0 | ||||||
| 2025-05-02 | 13F | Whittier Trust Co | 0 | −100,00 | 0 | |||||
| 2025-07-23 | 13F | High Note Wealth, LLC | 25 382 | 590 | ||||||
| 2025-07-30 | 13F | Mid-American Wealth Advisory Group, Inc. | 598 316 | −19,60 | 13 914 | −19,55 | ||||
| 2025-07-16 | 13F | Moisand Fitzgerald Tamayo, LLC | 200 | 0,00 | 5 | 0,00 | ||||
| 2025-08-13 | 13F | Flow Traders U.s. Llc | 12 016 | −54,00 | 0 | |||||
| 2025-08-12 | 13F | PSI Advisors, LLC | 0 | −100,00 | 0 | |||||
| 2025-07-29 | 13F | Werba Rubin Papier Wealth Management | 32 626 | −16,46 | 759 | −16,43 | ||||
| 2025-08-14 | 13F | Jane Street Group, Llc | 149 308 | 113,87 | 3 472 | 114,06 | ||||
| 2025-07-14 | 13F | Sowell Financial Services LLC | 74 809 | 1,02 | 1 740 | 1,05 | ||||
| 2025-08-14 | 13F | Diversify Advisory Services, LLC | 10 023 | −38,31 | 232 | −38,46 | ||||
| 2025-07-23 | 13F | Ironwood Financial, llc | 64 272 | 0,00 | 1 494 | 0,00 | ||||
| 2025-08-13 | 13F | Northwestern Mutual Wealth Management Co | 79 364 | −2,74 | 1 846 | −2,69 | ||||
| 2025-08-06 | 13F | AE Wealth Management LLC | 86 837 | 12,46 | 2 019 | 12,54 | ||||
| 2025-08-13 | 13F | GeoWealth Management, LLC | 8 526 | 198 | ||||||
| 2025-07-29 | 13F | International Assets Investment Management, Llc | 57 557 | −0,69 | 1 338 | −0,59 | ||||
| 2025-07-30 | 13F | Phillips Financial Management, Llc | 45 432 | 0,00 | 1 057 | 0,09 | ||||
| 2025-08-12 | 13F | Integrated Advisors Network LLC | 25 929 | 603 | ||||||
| 2025-07-22 | 13F | Steele Capital Management, Inc. | 40 925 | 0,00 | 952 | 0,00 | ||||
| 2025-08-05 | 13F | Bank Of Montreal /can/ | 1 965 | 46 | ||||||
| 2025-08-14 | 13F | Sunbelt Securities, Inc. | 19 425 | 31,92 | 451 | 31,58 | ||||
| 2025-07-09 | 13F | Krilogy Financial LLC | 73 165 | −3,42 | 1 701 | −3,35 | ||||
| 2025-07-29 | 13F | Private Trust Co Na | 2 319 | −7,79 | 54 | −8,62 | ||||
| 2025-08-14 | 13F | Colony Group, LLC | 12 885 | 0,00 | 300 | 0,00 | ||||
| 2025-08-14 | 13F | Stifel Financial Corp | 13 755 | 1,12 | 320 | 0,95 | ||||
| 2025-08-14 | 13F | GWM Advisors LLC | 32 219 | −27,19 | 749 | −27,14 | ||||
| 2025-07-25 | 13F | M3 Advisory Group, LLC | 10 529 | 0,14 | 245 | 0,00 | ||||
| 2025-08-12 | 13F | Bedel Financial Consulting, Inc. | 30 886 | 32,01 | 718 | 32,47 | ||||
| 2025-08-14 | 13F | Raymond James Financial Inc | 554 671 | −42,09 | 12 899 | −42,05 | ||||
| 2025-08-01 | 13F | Envestnet Asset Management Inc | 85 771 | 1,30 | 1 995 | 1,37 | ||||
| 2025-07-25 | 13F | LRI Investments, LLC | 13 209 | 139,42 | 307 | 139,84 | ||||
| 2025-08-07 | 13F | Nwam Llc | 25 780 | −59,64 | 599 | −59,64 | ||||
| 2025-08-08 | 13F | POM Investment Strategies, LLC | 0 | −100,00 | 0 | |||||
| 2025-07-28 | 13F | Mutual Advisors, LLC | 16 245 | 10,56 | 377 | 10,56 | ||||
| 2025-07-15 | 13F | MCF Advisors LLC | 29 766 | 41,22 | 692 | 41,51 | ||||
| 2025-06-23 | NP | LDRH - iShares iBonds 1-5 Year High Yield and Income Ladder ETF | 33 790 | 14,29 | 786 | 14,41 | ||||
| 2025-08-14 | 13F | Old Mission Capital Llc | 8 889 | 207 | ||||||
| 2025-07-31 | 13F | Cambridge Investment Research Advisors, Inc. | 232 281 | 11,01 | 5 | 25,00 | ||||
| 2025-07-31 | 13F | Keeler THomas Management LLC | 348 988 | 19,76 | 8 116 | 19,83 | ||||
| 2025-05-15 | 13F/A | Orion Portfolio Solutions, LLC | 22 738 | −37,56 | 528 | −37,44 | ||||
| 2025-07-29 | 13F | Straight Path Wealth Management | 78 542 | −3,32 | 1 826 | −3,23 | ||||
| 2025-08-11 | 13F | Private Advisor Group, LLC | 121 782 | −11,02 | 2 832 | −10,94 | ||||
| 2025-08-12 | 13F | Tableaux Llc | 10 000 | 10 | ||||||
| 2025-08-12 | 13F | Argent Trust Co | 0 | −100,00 | 0 | |||||
| 2025-07-02 | 13F | Michael S. Ryan, Inc. | 218 019 | 1,10 | 5 070 | 1,18 | ||||
| 2025-08-06 | 13F | Summit Investment Advisors, Inc. | 54 449 | 0,57 | 1 299 | 3,59 | ||||
| 2025-08-14 | 13F | 10Elms LLP | 28 318 | 0,00 | 659 | 0,00 | ||||
| 2025-08-05 | 13F | C2P Capital Advisory Group, LLC d.b.a. Prosperity Capital Advisors | 0 | −100,00 | 0 | |||||
| 2025-08-14 | 13F | Aprio Wealth Management, LLC | 9 858 | 0,42 | 229 | 0,44 | ||||
| 2025-07-11 | 13F | Quad-Cities Investment Group, LLC | 25 109 | 13,75 | 584 | 13,65 | ||||
| 2025-07-23 | 13F | Mainsail Asset Management, Llc | 11 099 | 0,41 | 258 | 0,78 | ||||
| 2025-07-10 | 13F | Wealth Enhancement Advisory Services, Llc | 10 344 | 0,00 | 240 | −0,42 | ||||
| 2025-08-04 | 13F | Spire Wealth Management | 56 440 | 52,22 | 1 313 | 52,38 | ||||
| 2025-08-14 | 13F | Vista Private Wealth Partners. LLC | 37 447 | −12,17 | 871 | −12,12 | ||||
| 2025-07-16 | 13F | Rebalance, Llc | 43 384 | 0,96 | 1 009 | 1,00 | ||||
| 2025-07-17 | 13F | Tempus Wealth Planning, LLC | 13 393 | 0,22 | 311 | 0,32 | ||||
| 2025-08-08 | 13F | Creative Planning | 12 068 | −6,48 | 281 | −6,35 | ||||
| 2025-05-09 | 13F | Thoroughbred Financial Services, Llc | 0 | −100,00 | 0 | |||||
| 2025-08-12 | 13F | Boreal Capital Management LLC | 0 | 274 | ||||||
| 2025-08-13 | 13F | MONECO Advisors, LLC | 15 773 | 0,00 | 367 | 0,00 | ||||
| 2025-09-04 | 13F/A | Advisor Group Holdings, Inc. | 145 972 | −4,10 | 3 395 | −4,07 | ||||
| 2025-08-15 | 13F | Morgan Stanley | 1 023 403 | −4,05 | 23 799 | −3,99 | ||||
| 2025-08-01 | 13F | Austin Private Wealth, LLC | 17 145 | 23,38 | 399 | 23,60 | ||||
| 2025-08-18 | 13F | Tyler-Stone Wealth Management | 120 522 | −10,72 | 2 803 | −10,68 | ||||
| 2025-08-14 | 13F | EP Wealth Advisors, Inc. | 483 104 | −9,55 | 11 235 | −9,49 | ||||
| 2025-08-14 | 13F | Hurley Capital, LLC | 266 508 | 3,24 | 6 198 | 3,30 | ||||
| 2025-08-01 | 13F | Ashton Thomas Private Wealth, LLC | 0 | −100,00 | 0 | |||||
| 2025-07-24 | 13F | Us Bancorp \de\ | 400 | 9 | ||||||
| 2025-08-08 | 13F | Cetera Investment Advisers | 206 997 | −1,53 | 4 814 | −1,47 | ||||
| 2025-07-25 | 13F | Atria Wealth Solutions, Inc. | 147 778 | −1,25 | 3 437 | −1,18 | ||||
| 2025-08-12 | 13F | Landing Point Financial Group, LLC | 49 217 | −3,49 | 1 145 | −3,46 | ||||
| 2025-08-15 | 13F | SkyView Investment Advisors, LLC | 970 073 | 7,39 | 23 | 10,00 | ||||
| 2025-05-01 | 13F | Exchange Capital Management, Inc. | 0 | −100,00 | 0 | |||||
| 2025-07-10 | 13F | Klaas Financial Asset Advisors, LLC | 30 082 | −6,94 | 700 | −6,92 | ||||
| 2025-07-17 | 13F | Janney Montgomery Scott LLC | 12 059 | 0,00 | 0 | |||||
| 2025-08-12 | 13F | LPL Financial LLC | 1 360 074 | 1,23 | 31 629 | 1,29 | ||||
| 2025-08-06 | 13F | Stone House Investment Management, LLC | 1 975 | −8,14 | 46 | −8,16 | ||||
| 2025-08-13 | 13F | Baird Financial Group, Inc. | 26 931 | −5,59 | 626 | −5,44 | ||||
| 2025-07-29 | 13F | Koshinski Asset Management, Inc. | 16 977 | 57,95 | 395 | 58,23 | ||||
| 2025-08-06 | 13F | Csenge Advisory Group | 11 672 | −2,62 | 271 | −2,88 | ||||
| 2025-08-15 | 13F | Kestra Advisory Services, LLC | 63 260 | 62,00 | 1 471 | 62,18 | ||||
| 2025-08-14 | 13F | Bnp Paribas Arbitrage, Sa | 45 | 1 | ||||||
| 2025-07-21 | 13F | Ameriflex Group, Inc. | 9 976 | 18,35 | 232 | 18,46 | ||||
| 2025-08-15 | 13F | Scissortail Wealth Management, LLC | 382 714 | 1,33 | 8 900 | 1,40 | ||||
| 2025-07-09 | 13F | Lbmc Investment Advisors, Llc | 252 539 | 1,95 | 5 873 | 2,02 | ||||
| 2025-08-08 | 13F | Pnc Financial Services Group, Inc. | 0 | −100,00 | 0 | |||||
| 2025-07-15 | 13F | Carr Financial Group Corp | 153 703 | −41,49 | 3 574 | −41,46 | ||||
| 2025-08-14 | 13F/A | Rockefeller Capital Management L.P. | 20 662 | 0,16 | 481 | 0,21 | ||||
| 2025-08-11 | 13F | HighTower Advisors, LLC | 23 295 | −93,52 | 542 | −93,52 | ||||
| 2025-07-08 | 13F | Parallel Advisors, LLC | 30 645 | 29,60 | 713 | 29,69 | ||||
| 2025-08-11 | 13F | Principal Securities, Inc. | 6 581 | 0,06 | 153 | 0,66 | ||||
| 2025-08-12 | 13F | Jpmorgan Chase & Co | 719 | −27,88 | 17 | −30,43 | ||||
| 2025-08-14 | 13F | Bank Of America Corp /de/ | 215 866 | −15,62 | 5 020 | −15,58 | ||||
| 2025-08-14 | 13F | Integrated Wealth Concepts LLC | 44 735 | −39,04 | 1 040 | −39,00 | ||||
| 2025-08-05 | 13F | Summit Investment Advisory Services, LLC | 54 385 | 1 265 | ||||||
| 2025-08-07 | 13F | New England Private Wealth Advisors LLC | 34 906 | 1,13 | 811 | 1,00 | ||||
| 2025-08-14 | 13F | Citadel Advisors Llc | 0 | −100,00 | 0 | |||||
| 2025-08-12 | 13F | J.w. Cole Advisors, Inc. | 17 750 | 413 | ||||||
| 2025-08-12 | 13F | Timber Creek Capital Management LLC | 27 064 | 11,97 | 627 | 11,76 | ||||
| 2025-07-25 | 13F | Heartland Bank & Trust Co | 19 026 | 59,31 | 442 | 59,57 | ||||
| 2025-08-14 | 13F | IHT Wealth Management, LLC | 8 789 | 0,56 | 204 | 0,49 |