Grundläggande statistik
| Institutionella ägare | 289 total, 289 long only, 0 short only, 0 long/short - change of 4,71% MRQ |
| Genomsnittlig portföljallokering | 0.1863 % - change of −2,76% MRQ |
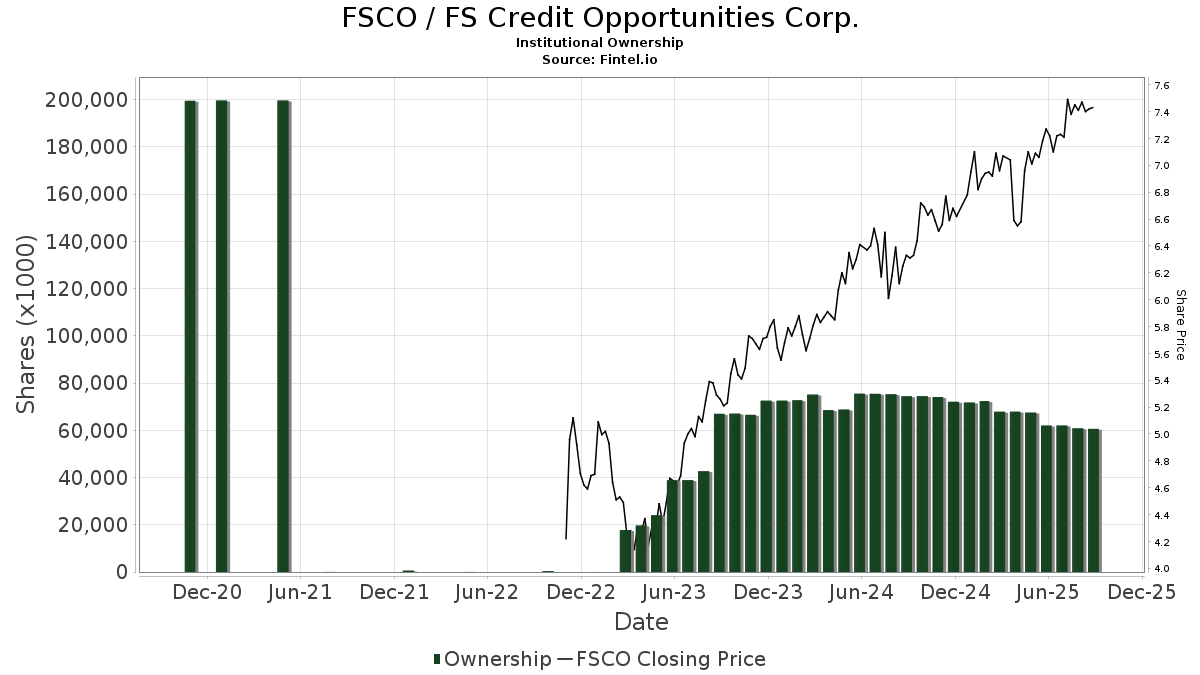
| Institutionella aktier (lång) | 60 591 025 (ex 13D/G) - change of −1,40MM shares −2,25% MRQ |
| Institutionellt värde (lång) | $ 308 632 USD ($1000) |
Institutionellt ägande och aktieägare
FS Credit Opportunities Corp. (US:FSCO) har 289 Institutionella ägare och aktieägare som har lämnat in 13D/G- eller 13F-formulär till Securities Exchange Commission (SEC). Dessa institut innehar totalt 60,591,025 aktier. Största aktieägare inkluderar Commonwealth Equity Services, Llc, Cambridge Investment Research Advisors, Inc., Sit Investment Associates Inc, Thomas J. Herzfeld Advisors, Inc., Cetera Investment Advisers, LPL Financial LLC, Wagner Wealth Management, Llc, Vista Finance, Llc, Envestnet Asset Management Inc, and Avantax Advisory Services, Inc. .
FS Credit Opportunities Corp. (NYSE:FSCO) Institutionell ägarstruktur visar institutioners och fonders nuvarande positioner i företaget, samt de senaste förändringarna i positionernas storlek. Större aktieägare kan vara enskilda investerare, fonder, hedgefonder eller institutioner. Bilaga 13D visar att investeraren äger (eller ägde) mer än 5% av företaget och avser (eller avsåg) att aktivt eftersträva en förändring av affärsstrategin. Schedule 13G indikerar en passiv investering på över 5%.
The share price as of September 18, 2025 is 7,40 / share. Previously, on September 19, 2024, the share price was 6,37 / share. This represents an increase of 16,17% over that period.
Fondsentimentets poäng
Fondsentimentet poängen(fka Ägarackumulation-poäng) visar vilka aktier som är mest köpta av fonder. Det är resultatet av en sofistikerad kvantitativ flerfaktormodell som identifierar företag med de högsta nivåerna av institutionell ackumulering. Poängsättningsmodellen använder en kombination av den totala ökningen av redovisade ägare, förändringarna i portföljallokeringarna för dessa ägare och andra mått. Siffran sträcker sig från 0 till 100, där högre siffror indikerar en högre nivå av ackumulering i förhållande till sina konkurrenter, och 50 är genomsnittet.
Uppdateringsfrekvens: Dagligen
Se Ownership Explorer, som innehåller en lista över de högst rankade företagen.
AI+ Ask Fintel’s AI assistant about FS Credit Opportunities Corp..
Thinking of good questions…
Institutionell sälj/köp-kvot
Förutom att rapportera vanliga eget kapital- och skuldemissioner måste institutioner med mer än 100MM tillgångar under förvaltning också avslöja sina innehav av sälj- och köpoptioner. Eftersom säljoptioner i allmänhet indikerar ett negativt sentiment och köpoptioner indikerar ett positivt sentiment, kan vi få en uppfattning om det övergripande institutionella sentimentet genom att plotta förhållandet mellan säljoptioner och köpoptioner. Diagrammet till höger visar det historiska förhållandet mellan sälj- och köpoptioner för detta instrument.
Genom att använda sälj/köp-kvoten som en indikator på aktieägarnas sentiment undviker man en av de största bristerna med att använda det totala institutionella ägandet, nämligen att en betydande del av de förvaltade tillgångarna investeras passivt för att följa index. Passivt förvaltade fonder köper vanligtvis inte optioner, så indikatorn för sälj/köp-kvoten ger en bättre bild av stämningen i aktivt förvaltade fonder.
13D/G-Arkiveringar
Vi presenterar 13D/G-arkiveringar separat från 13F-arkiveringar på grund av att de behandlas olika av SEC. 13D/G-arkiveringar kan lämnas in av grupper av investerare (med en ledare), medan 13F-arkiveringar inte kan det. Detta leder till situationer där en investerare kan lämna in en 13D/G-ansökan med ett värde för de totala aktierna (vilket motsvarar alla aktier som ägs av investerargruppen), men sedan lämna in en 13F-ansökan med ett annat värde för de totala aktierna (vilket motsvarar enbart deras eget ägande). Detta innebär att aktieägandet i 13D/G-arkiveringar och 13F-arkiveringar ofta inte är direkt jämförbara, så vi presenterar dem separat.
Notera: Från och med den 16 maj 2021 visar vi inte längre ägare som inte har lämnat in en 13D/G under det senaste året. Tidigare visade vi hela historiken för 13D/G-arkiveringar. I allmänhet måste enheter som är skyldiga att lämna in 13D/G-arkiveringar lämna in minst en gång per år innan de lämnar in en stängningsarkivering. Fonder avslutar dock ibland positioner utan att lämna in en avslutande arkivering (dvs. de avvecklar), så att visa hela historiken resulterade ibland i förvirring om det nuvarande ägandet. För att förhindra förvirring visar vi nu endast "nuvarande" ägare - det vill säga ägare som har lämnat in en ansökan under det senaste året.
Upgrade to unlock premium data.
| Fil Datum | Formulär | Investerare | Föregående aktier |
Senaste aktier |
Δ Aktier (Procent) |
Ägande (Procent) |
Δ Ägande (Procent) |
|
|---|---|---|---|---|---|---|---|---|
| 2025-05-07 | COMMONWEALTH EQUITY SERVICES, LLC | 10,104,494 | 9,869,575 | -2.32 | 4.90 | -3.92 | ||
| 2024-11-14 | GUARDIAN LIFE INSURANCE CO OF AMERICA | 25,000 | 25,000 | 0.00 | 6.30 | -24.10 | ||
| 2024-11-14 | Apollo Management Holdings GP, LLC | 25,000 | 25,000 | 0.00 | 6.30 | 0.00 |
13F- och NPORT-arkiveringar
Detaljer om 13F-arkiveringar är gratis. Detaljer om NP-arkiveringar kräver ett premiummedlemskap. Gröna rader indikerar nya positioner. Röda rader indikerar stängda positioner. Klicka på länk symbolen för att se hela transaktionshistoriken.
Uppgradera
för att låsa upp premiumdata och exportera till Excel ![]() .
.
| Fil Datum | Källa | Investerare | Typ | Genomsnittligt pris (beräknat) |
Aktier | Δ Aktier (%) |
Rapporterat värde (1000 USD) |
Δ Värde (%) |
Portföljallokering (%) |
|
|---|---|---|---|---|---|---|---|---|---|---|
| 2025-07-11 | 13F | Farther Finance Advisors, LLC | 6 360 | 0,00 | 46 | 2,22 | ||||
| 2025-07-22 | 13F | Chung Wu Investment Group, LLC | 900 | 7 | ||||||
| 2025-08-14 | 13F | Colony Group, LLC | 66 640 | −17,69 | 484 | −15,26 | ||||
| 2025-07-25 | 13F | Cwm, Llc | 283 431 | −1,64 | 2 | 0,00 | ||||
| 2025-07-21 | 13F | Ameriflex Group, Inc. | 9 211 | −75,49 | 65 | −75,38 | ||||
| 2025-07-23 | 13F | Gerber, Llc | 14 077 | 40,77 | 102 | 45,71 | ||||
| 2025-08-13 | 13F | Townsquare Capital Llc | 0 | −100,00 | 0 | |||||
| 2025-08-11 | 13F | HighTower Advisors, LLC | 50 127 | 40,70 | 364 | 44,62 | ||||
| 2025-07-10 | 13F | Stewardship Advisors, LLC | 25 559 | 0,93 | 186 | 3,93 | ||||
| 2025-08-14 | 13F | Raymond James Financial Inc | 528 526 | 6,76 | 3 837 | 9,94 | ||||
| 2025-07-23 | 13F | Steel Peak Wealth Management LLC | 12 567 | 91 | ||||||
| 2025-08-14 | 13F | Stifel Financial Corp | 149 416 | −1,16 | 1 085 | 1,78 | ||||
| 2025-04-30 | 13F | Sofos Investments, Inc. | 48 478 | 342 | ||||||
| 2025-08-13 | 13F | Certior Financial Group, Llc | 271 331 | −0,33 | 1 970 | 2,61 | ||||
| 2025-08-01 | 13F | Advisory Alpha, LLC | 26 112 | 52,38 | 190 | 57,50 | ||||
| 2025-07-18 | 13F | Consolidated Planning Corp | 10 546 | 0,00 | 77 | 2,70 | ||||
| 2025-07-23 | 13F | Kingswood Wealth Advisors, Llc | 48 349 | 0,00 | 351 | 2,33 | ||||
| 2025-07-15 | 13F | Financial Management Professionals, Inc. | 3 279 | 2,79 | 24 | 4,55 | ||||
| 2025-08-04 | 13F | BLB&B Advisors, LLC | 15 872 | −33,79 | 115 | −31,95 | ||||
| 2025-08-12 | 13F | Jacobi Capital Management LLC | 26 570 | 28,19 | 193 | 31,51 | ||||
| 2025-05-13 | 13F | Robinson Capital Management, Llc | 0 | −100,00 | 0 | |||||
| 2025-08-08 | 13F | Pnc Financial Services Group, Inc. | 1 623 | 12 | ||||||
| 2025-04-02 | 13F | Marcum Wealth, LLC | 56 711 | 4,81 | 400 | 8,13 | ||||
| 2025-08-12 | 13F | Steward Partners Investment Advisory, Llc | 91 859 | −17,39 | 667 | −14,94 | ||||
| 2025-07-14 | 13F | Capital CS Group, LLC | 26 032 | 6,97 | 189 | 9,94 | ||||
| 2025-08-12 | 13F | Inscription Capital, LLC | 129 695 | −45,68 | 942 | −33,50 | ||||
| 2025-07-17 | 13F | Beacon Capital Management, LLC | 1 459 | 2,82 | 11 | 0,00 | ||||
| 2025-07-25 | 13F | Total Clarity Wealth Management, Inc. | 0 | −100,00 | 0 | |||||
| 2025-08-06 | 13F | Strategic Financial Partners, Ltd. | 103 032 | 0,23 | 748 | 3,31 | ||||
| 2025-08-13 | 13F | Virtue Capital Management, LLC | 35 083 | 0,00 | 255 | 2,83 | ||||
| 2025-08-14 | 13F | Hrt Financial Lp | 0 | −100,00 | 0 | |||||
| 2025-08-06 | 13F | Wedbush Securities Inc | 42 939 | 0,00 | 0 | |||||
| 2025-08-13 | 13F | Baird Financial Group, Inc. | 89 187 | 647 | ||||||
| 2025-08-14 | 13F | UBS Group AG | 125 562 | 3,82 | 912 | 6,92 | ||||
| 2025-05-06 | 13F | Alpha Omega Group, Inc. | 12 315 | −44,88 | 87 | −43,42 | ||||
| 2025-08-11 | 13F | Cannon Advisors, Inc. | 19 847 | 2,80 | 144 | 5,88 | ||||
| 2025-08-14 | 13F | Bank Of America Corp /de/ | 1 | 0 | ||||||
| 2025-08-18 | 13F | Second Line Capital, LLC | 11 473 | 83 | ||||||
| 2025-07-16 | 13F | Moisand Fitzgerald Tamayo, LLC | 1 063 | 0,00 | 8 | 0,00 | ||||
| 2025-08-14 | 13F | Bramshill Investments, LLC | 170 943 | 56,26 | 1 241 | 60,96 | ||||
| 2025-08-04 | 13F | Assetmark, Inc | 2 952 | 21 | ||||||
| 2025-08-14 | 13F/A | Rockefeller Capital Management L.P. | 1 292 277 | 2,91 | 9 382 | 5,96 | ||||
| 2025-08-06 | 13F | Centerpoint Advisory Group | 79 722 | −7,38 | 579 | −4,62 | ||||
| 2025-08-14 | 13F | Mercer Global Advisors Inc /adv | 64 771 | −2,80 | 470 | 0,21 | ||||
| 2025-07-25 | 13F | Concurrent Investment Advisors, LLC | 85 695 | 33,64 | 622 | 37,61 | ||||
| 2025-07-16 | 13F | Perigon Wealth Management, LLC | 30 356 | −15,88 | 220 | −13,39 | ||||
| 2025-08-08 | 13F | Cetera Investment Advisers | 2 508 234 | −1,28 | 18 210 | 1,66 | ||||
| 2025-08-12 | 13F | Allen Capital Group, LLC | 137 305 | −4,32 | 997 | −1,48 | ||||
| 2025-08-29 | 13F | Centaurus Financial, Inc. | 12 112 | −18,78 | 0 | |||||
| 2025-08-08 | 13F | CWS Financial Advisors, LLC | 15 201 | 0,00 | 110 | 2,80 | ||||
| 2025-08-12 | 13F | NFP Retirement, Inc. | 49 937 | 0,00 | 363 | 2,84 | ||||
| 2025-07-10 | 13F | Kozak & Associates, Inc. | 1 593 | 2,77 | 12 | 10,00 | ||||
| 2025-07-29 | 13F | Koshinski Asset Management, Inc. | 18 993 | 15,54 | 138 | 19,13 | ||||
| 2025-08-01 | 13F | Rossby Financial, LCC | 22 325 | 0,00 | 162 | 8,72 | ||||
| 2025-08-12 | 13F | XTX Topco Ltd | 0 | −100,00 | 0 | |||||
| 2025-09-09 | 13F | NWF Advisory Services Inc. | 10 369 | 75 | ||||||
| 2025-07-29 | 13F | Signature Estate & Investment Advisors Llc | 20 964 | 152 | ||||||
| 2025-08-13 | 13F | Van Hulzen Asset Management, LLC | 28 710 | 208 | ||||||
| 2025-07-30 | 13F | Strategic Blueprint, LLC | 89 397 | −21,37 | 649 | −18,98 | ||||
| 2025-08-14 | 13F | Ausdal Financial Partners, Inc. | 261 913 | 26,37 | 1 901 | 30,12 | ||||
| 2025-07-29 | 13F | Liberty Square Wealth Partners Llc | 34 257 | −4,73 | 249 | −1,98 | ||||
| 2025-07-21 | 13F | Stock Yards Bank & Trust Co | 30 576 | 0,00 | 222 | 2,79 | ||||
| 2025-07-10 | 13F | Marshall Financial Group LLC | 10 953 | 0,00 | 80 | 2,60 | ||||
| 2025-05-12 | 13F | Independent Advisor Alliance | 0 | −100,00 | 0 | |||||
| 2025-08-05 | 13F | Fullcircle Wealth Llc | 17 109 | 0,00 | 130 | 11,21 | ||||
| 2025-08-07 | 13F | Panoramic Investment Advisors, Llc | 33 060 | −21,48 | 240 | −18,92 | ||||
| 2025-04-14 | 13F | Strategic Wealth Designers | 0 | −100,00 | 0 | −100,00 | ||||
| 2025-07-16 | 13F | St Germain D J Co Inc | 1 499 | 11 | ||||||
| 2025-07-31 | 13F | Cambridge Investment Research Advisors, Inc. | 4 412 418 | −26,46 | 32 | −23,81 | ||||
| 2025-07-22 | 13F | Kercheville Advisors, LLC | 58 790 | 0,03 | 427 | 2,90 | ||||
| 2025-08-14 | 13F | Integrated Wealth Concepts LLC | 131 277 | 84,98 | 953 | 90,60 | ||||
| 2025-05-15 | 13F | Nomura Holdings Inc | 0 | −100,00 | 0 | |||||
| 2025-07-18 | 13F | Cooper Financial Group | 10 531 | −3,39 | 76 | 0,00 | ||||
| 2025-08-04 | 13F | AlphaStar Capital Management, LLC | 92 712 | 0,22 | 673 | 3,22 | ||||
| 2025-08-14 | 13F | Susquehanna International Group, Llp | 0 | −100,00 | 0 | |||||
| 2025-08-12 | 13F | Walled Lake Planning & Wealth Management, Llc | 45 650 | 158,64 | 331 | 166,94 | ||||
| 2025-08-04 | 13F | Kovack Advisors, Inc. | 132 870 | −23,68 | 965 | −21,43 | ||||
| 2025-08-14 | 13F | IHT Wealth Management, LLC | 128 068 | 4,46 | 930 | 7,52 | ||||
| 2025-05-02 | 13F | First Command Advisory Services, Inc. | 0 | −100,00 | 0 | |||||
| 2025-08-14 | 13F | Wells Fargo & Company/mn | 1 | −98,39 | 0 | |||||
| 2025-07-23 | 13F | Ironwood Financial, llc | 15 000 | 0,00 | 106 | 0,00 | ||||
| 2025-08-14 | 13F | Tennessee Valley Asset Management Partners | 0 | −100,00 | 0 | |||||
| 2025-07-17 | 13F | Patton Albertson Miller Group, Llc | 19 149 | 0,00 | 139 | 2,96 | ||||
| 2025-08-05 | 13F | Dunhill Financial, LLC | 30 288 | 220 | ||||||
| 2025-08-13 | 13F | Russell Investments Group, Ltd. | 2 114 | −21,27 | 15 | −16,67 | ||||
| 2025-07-28 | 13F | Rosenberg Matthew Hamilton | 8 859 | 0,00 | 64 | 3,23 | ||||
| 2025-08-12 | 13F | Cornerstone Wealth Management, LLC | 300 916 | 5,10 | 2 185 | 8,23 | ||||
| 2025-09-04 | 13F/A | Advisor Group Holdings, Inc. | 1 235 949 | 7,28 | 8 973 | 10,47 | ||||
| 2025-08-14 | 13F | Valley Financial Group, Inc. | 16 284 | 118 | ||||||
| 2025-08-11 | 13F | Perennial Investment Advisors, LLC | 17 186 | 2,16 | 125 | 5,08 | ||||
| 2025-07-18 | 13F | Foundry Financial Group, Inc. | 39 306 | 0,00 | 285 | 2,89 | ||||
| 2025-06-30 | NP | CVY - Invesco Zacks Multi-Asset Income ETF This fund is a listed as child fund of Invesco Ltd. and if that institution has disclosed ownership in this security, then these positions will not be double counted when calculating total shares and total value | 157 584 | −8,96 | 1 097 | −6,72 | ||||
| 2025-05-08 | 13F | Jefferies Financial Group Inc. | 0 | −100,00 | 0 | |||||
| 2025-08-05 | 13F | Gilbert & Cook, Inc. | 316 350 | −3,27 | 2 297 | −0,39 | ||||
| 2025-08-14 | 13F | Ameriprise Financial Inc | 0 | −100,00 | 0 | |||||
| 2025-07-28 | 13F | RFG Advisory, LLC | 125 175 | −1,48 | 909 | 1,45 | ||||
| 2025-07-30 | 13F | Brookstone Capital Management | 31 227 | 11,06 | 227 | 14,14 | ||||
| 2025-07-21 | 13F | Andina Capital Management, LLC | 20 212 | 68,50 | 147 | 73,81 | ||||
| 2025-07-16 | 13F | Freestate Advisors LLC | 12 554 | 4,10 | 91 | 7,06 | ||||
| 2025-08-12 | 13F | Proequities, Inc. | 0 | 0 | ||||||
| 2025-08-18 | 13F | Tactive Advisors, LLC | 0 | −100,00 | 0 | |||||
| 2025-08-07 | 13F | Summit X, LLC | 47 658 | 71,25 | 346 | 76,02 | ||||
| 2025-08-08 | 13F | Crossmark Global Holdings, Inc. | 21 446 | 0,00 | 156 | 1,30 | ||||
| 2025-07-07 | 13F | Thurston, Springer, Miller, Herd & Titak, Inc. | 4 821 | 35 | ||||||
| 2025-07-23 | 13F | Prime Capital Investment Advisors, LLC | 468 736 | −29,53 | 3 403 | −27,43 | ||||
| 2025-08-07 | 13F | Lakeridge Wealth Management LLC | 14 653 | −47,69 | 106 | −46,19 | ||||
| 2025-08-04 | 13F | Bay Colony Advisory Group, Inc d/b/a Bay Colony Advisors | 32 952 | 4,19 | 239 | 7,17 | ||||
| 2025-07-29 | 13F | Huntleigh Advisors, Inc. | 67 369 | 0,00 | 489 | 3,16 | ||||
| 2025-08-01 | 13F | Bessemer Group Inc | 0 | −100,00 | 0 | |||||
| 2025-08-13 | 13F | Cerity Partners LLC | 0 | −100,00 | 0 | |||||
| 2025-05-07 | 13F | Prosperity Consulting Group, LLC | 0 | −100,00 | 0 | |||||
| 2025-08-13 | 13F | Jones Financial Companies Lllp | 1 572 | 11 | ||||||
| 2025-07-11 | 13F | OxenFree Capital LLC | 18 710 | 0,00 | 136 | 9,76 | ||||
| 2025-08-08 | 13F | Financial Gravity Companies, Inc. | 48 478 | 0,00 | 352 | 6,36 | ||||
| 2025-08-11 | 13F | FSC Wealth Advisors, LLC | 1 671 | 0,00 | 12 | 9,09 | ||||
| 2025-08-14 | 13F | Sentinus, LLC | 78 834 | 0,38 | 572 | 3,44 | ||||
| 2025-08-15 | 13F | Captrust Financial Advisors | 96 739 | 71,20 | 702 | 76,38 | ||||
| 2025-07-17 | 13F | Symmetry Partners, LLC | 16 003 | 116 | ||||||
| 2025-08-14 | 13F | Royal Bank Of Canada | 191 475 | 9,51 | 1 391 | 12,81 | ||||
| 2025-07-24 | 13F | IFP Advisors, Inc | 56 171 | 11,97 | 408 | 15,30 | ||||
| 2025-08-13 | 13F | Integrity Investment Advisors, LLC | 28 641 | 208 | ||||||
| 2025-08-13 | 13F | Keystone Financial Group | 11 138 | 81 | ||||||
| 2025-08-14 | 13F | Sit Investment Associates Inc | 3 796 440 | −0,03 | 28 | 3,85 | ||||
| 2025-07-28 | 13F | WealthPlan Investment Management, LLC | 117 048 | −10,36 | 850 | −7,72 | ||||
| 2025-08-14 | 13F | Great Valley Advisor Group, Inc. | 95 233 | 8,22 | 691 | 11,45 | ||||
| 2025-08-19 | 13F | Newbridge Financial Services Group, Inc. | 181 987 | 1 321 | ||||||
| 2025-08-13 | 13F | Bare Financial Services, Inc | 29 398 | 213 | ||||||
| 2025-07-14 | 13F | Ai Financial Services Llc | 0 | −100,00 | 0 | |||||
| 2025-08-29 | 13F | Total Investment Management Inc | 2 520 | 18 | ||||||
| 2025-05-13 | 13F | Northern Trust Corp | 0 | −100,00 | 0 | −100,00 | ||||
| 2025-08-05 | 13F | C2P Capital Advisory Group, LLC d.b.a. Prosperity Capital Advisors | 0 | −100,00 | 0 | |||||
| 2025-08-08 | 13F | Foundations Investment Advisors, LLC | 30 681 | −8,42 | 223 | −5,93 | ||||
| 2025-08-12 | 13F | Bravias Capital Group, LLC | 10 764 | 0,00 | 78 | 4,00 | ||||
| 2025-07-31 | 13F | West Michigan Advisors, Llc | 154 777 | 0,45 | 1 124 | 3,41 | ||||
| 2025-04-15 | 13F | Focus Financial Network, Inc. | 0 | −100,00 | 0 | −100,00 | ||||
| 2025-08-04 | 13F | Pensionmark Financial Group, Llc | 11 884 | 86 | ||||||
| 2025-07-16 | 13F | Kathmere Capital Management, LLC | 120 087 | 0,00 | 872 | 2,96 | ||||
| 2025-07-28 | 13F | Naviter Wealth, LLC | 27 800 | −39,30 | 202 | −38,53 | ||||
| 2025-05-02 | 13F | Sigma Planning Corp | 0 | −100,00 | 0 | −100,00 | ||||
| 2025-08-13 | 13F | Northwestern Mutual Wealth Management Co | 49 696 | 0,34 | 361 | 3,15 | ||||
| 2025-07-22 | 13F | Global Assets Advisory, LLC | 26 650 | 129,60 | 195 | 155,26 | ||||
| 2025-08-14 | 13F | Visionary Wealth Advisors | 129 281 | −35,85 | 939 | −33,94 | ||||
| 2025-08-15 | 13F | Binnacle Investments Inc | 33 132 | 0,00 | 241 | 3,00 | ||||
| 2025-07-21 | 13F | Patriot Financial Group Insurance Agency, LLC | 355 041 | 20,13 | 2 578 | 23,72 | ||||
| 2025-08-20 | NP | LSPAX - LoCorr Spectrum Income Fund Class A | 156 605 | 57,04 | 1 137 | 61,59 | ||||
| 2025-05-01 | 13F | Key FInancial Inc | 0 | −100,00 | 0 | |||||
| 2025-07-25 | 13F | Concord Wealth Partners | 237 | 0,00 | 2 | 0,00 | ||||
| 2025-08-13 | 13F | WCG Wealth Advisors LLC | 54 382 | −2,35 | 395 | 0,51 | ||||
| 2025-08-14 | 13F | Harvest Investment Services, LLC | 88 522 | −3,08 | 643 | −0,16 | ||||
| 2025-08-01 | 13F | Gwn Securities Inc. | 0 | −100,00 | 0 | |||||
| 2025-08-07 | 13F | Meeder Advisory Services, Inc. | 39 540 | 0,00 | 287 | 3,24 | ||||
| 2025-08-11 | 13F | Western Wealth Management, LLC | 24 909 | 0,00 | 181 | 2,86 | ||||
| 2025-08-14 | 13F | Sunbelt Securities, Inc. | 13 199 | −1,40 | 90 | −4,26 | ||||
| 2025-07-31 | 13F | Oppenheimer & Co Inc | 74 574 | 17,88 | 541 | 21,57 | ||||
| 2025-08-04 | 13F | Flagship Harbor Advisors, Llc | 22 821 | −17,77 | 166 | −15,38 | ||||
| 2025-08-13 | 13F | Wealthedge Investment Advisors, Llc | 22 029 | 15,77 | 160 | 18,66 | ||||
| 2025-07-16 | 13F | ORG Partners LLC | 40 127 | −6,22 | 293 | 0,69 | ||||
| 2025-08-06 | 13F | Carnegie Lake Advisors LLC | 21 663 | 0,00 | 0 | |||||
| 2025-07-10 | 13F | Worth Asset Management, LLC | 14 167 | 103 | ||||||
| 2025-07-09 | 13F | Channel Wealth Llc | 44 946 | −25,30 | 326 | −23,11 | ||||
| 2025-07-18 | 13F | Truist Financial Corp | 20 082 | 146 | ||||||
| 2025-07-23 | 13F | Allegiance Financial Group Advisory Services LLC | 60 611 | 0,00 | 440 | 3,04 | ||||
| 2025-08-14 | 13F | Comerica Bank | 46 | 0,00 | 0 | |||||
| 2025-08-14 | 13F | Mariner, LLC | 399 141 | −8,42 | 2 898 | −5,70 | ||||
| 2025-07-28 | 13F | WealthPLAN Partners, LLC | 36 032 | 0,00 | 262 | 2,76 | ||||
| 2025-08-08 | 13F | Intrua Financial, LLC | 27 130 | −27,60 | 197 | −25,76 | ||||
| 2025-08-13 | 13F | Rsm Us Wealth Management Llc | 242 081 | −43,60 | 1 758 | −41,94 | ||||
| 2025-08-14 | 13F | Dean, Jacobson Financial Services, LLC | 37 501 | −11,12 | 272 | −8,42 | ||||
| 2025-07-15 | 13F | McAdam, LLC | 114 427 | 22,94 | 831 | 26,52 | ||||
| 2025-08-12 | 13F | Frontier Asset Management, LLC | 0 | −100,00 | 0 | |||||
| 2025-08-13 | 13F | Vance Wealth, Inc. | 21 195 | 0,00 | 154 | 2,68 | ||||
| 2025-07-17 | 13F | Raleigh Capital Management Inc. | 2 845 | 2,78 | 21 | 5,26 | ||||
| 2025-08-06 | 13F | Bensler, LLC | 557 808 | −1,99 | 4 050 | 0,92 | ||||
| 2025-07-28 | 13F | Harbour Investments, Inc. | 436 295 | 1,42 | 3 167 | 4,45 | ||||
| 2025-07-22 | 13F | Wealthcare Advisory Partners LLC | 106 897 | 5,35 | 776 | 8,53 | ||||
| 2025-04-30 | 13F | Jessup Wealth Management, Inc | 0 | −100,00 | 0 | |||||
| 2025-08-13 | 13F | EverSource Wealth Advisors, LLC | 7 773 | 0,00 | 56 | 3,70 | ||||
| 2025-08-14 | 13F | Modern Wealth Management, LLC | 189 828 | 12,51 | 1 378 | 15,90 | ||||
| 2025-08-13 | 13F | Millstone Evans Group, LLC | 5 472 | 40 | ||||||
| 2025-07-25 | 13F | Ellis Investment Partners, LLC | 829 909 | 1,62 | 6 025 | 4,66 | ||||
| 2025-07-22 | 13F | Grimes & Company, Inc. | 85 024 | −33,71 | 617 | −31,75 | ||||
| 2025-08-14 | 13F | GWM Advisors LLC | 5 454 | 1,21 | 40 | 5,41 | ||||
| 2025-07-09 | 13F | Heritage Family Offices, LLP | 32 426 | 229 | ||||||
| 2025-08-06 | 13F | Commonwealth Equity Services, Llc | 9 213 437 | −4,83 | 67 | −2,94 | ||||
| 2025-08-14 | 13F | Benjamin Edwards Inc | 13 489 | 8,98 | 98 | 11,49 | ||||
| 2025-08-15 | 13F | Tower Research Capital LLC (TRC) | 2 507 | 18 | ||||||
| 2025-07-21 | 13F | Ameritas Advisory Services, LLC | 2 472 | 18 | ||||||
| 2025-08-14 | 13F | Glen Eagle Advisors, LLC | 10 485 | 11,35 | 76 | 15,15 | ||||
| 2025-05-16 | 13F | Coppell Advisory Solutions LLC | 0 | −100,00 | 0 | |||||
| 2025-08-04 | 13F | Integrity Alliance, Llc. | 26 451 | −34,61 | 192 | −32,63 | ||||
| 2025-07-23 | 13F | REAP Financial Group, LLC | 3 056 | 1,80 | 22 | 4,76 | ||||
| 2025-05-15 | 13F | Lido Advisors, LLC | 0 | −100,00 | 0 | −100,00 | ||||
| 2025-05-02 | 13F | BlackRock, Inc. | 0 | −100,00 | 0 | |||||
| 2025-04-22 | 13F | Evanson Asset Management, LLC | 0 | −100,00 | 0 | |||||
| 2025-07-24 | 13F | Us Bancorp \de\ | 15 150 | 0,00 | 110 | 2,83 | ||||
| 2025-08-05 | 13F | GPS Wealth Strategies Group, LLC | 20 288 | 21,84 | 147 | 25,64 | ||||
| 2025-08-18 | 13F | Geneos Wealth Management Inc. | 590 181 | 74,92 | 4 285 | 80,15 | ||||
| 2025-08-13 | 13F | Beacon Pointe Advisors, LLC | 25 796 | 0,00 | 187 | 3,31 | ||||
| 2025-07-16 | 13F | Cahaba Wealth Management, Inc. | 26 912 | 2,81 | 195 | 5,98 | ||||
| 2025-07-24 | 13F | MFA Wealth Services | 21 513 | 1,48 | 156 | 4,70 | ||||
| 2025-08-13 | 13F | Transce3nd, LLC | 8 679 | −72,29 | 63 | −71,36 | ||||
| 2025-08-15 | 13F | Morgan Stanley | 1 104 687 | −13,69 | 8 020 | −11,12 | ||||
| 2025-07-29 | 13F | Stratos Wealth Partners, LTD. | 351 440 | 4,20 | 2 551 | 7,32 | ||||
| 2025-07-31 | 13F | Optimum Investment Advisors | 2 200 | 0,00 | 16 | 0,00 | ||||
| 2025-07-17 | 13F | Sound Income Strategies, LLC | 1 581 | 0,00 | 11 | 0,00 | ||||
| 2025-08-01 | 13F | Delta Investment Management, LLC | 256 063 | 38,27 | 1 859 | 42,45 | ||||
| 2025-07-25 | 13F | Sequoia Financial Advisors, LLC | 73 989 | −10,36 | 537 | −7,57 | ||||
| 2025-07-21 | 13F | Curran Financial Partners, LLC | 11 112 | 0,00 | 81 | 2,56 | ||||
| 2025-07-17 | 13F | Wagner Wealth Management, Llc | 2 070 702 | −7,10 | 15 033 | −4,33 | ||||
| 2025-07-16 | 13F | Maridea Wealth Management LLC | 74 623 | 4,29 | 542 | 7,34 | ||||
| 2025-08-04 | 13F | Spire Wealth Management | 5 670 | 0,00 | 41 | 5,13 | ||||
| 2025-07-30 | NP | HYIN - WisdomTree Alternative Income Fund N/A | 253 966 | 189,55 | 1 834 | 232,67 | ||||
| 2025-08-04 | 13F | IFG Advisory, LLC | 72 260 | 3,73 | 525 | 6,72 | ||||
| 2025-08-01 | 13F | Envestnet Asset Management Inc | 2 000 253 | 4,74 | 14 522 | 7,86 | ||||
| 2025-08-14 | 13F | Harwood Advisory Group, LLC | 1 657 | 0,00 | 12 | 9,09 | ||||
| 2025-08-14 | 13F | Blackstone Group Inc | 1 662 945 | 0,00 | 12 073 | 2,98 | ||||
| 2025-07-18 | 13F | Consolidated Portfolio Review Corp | 87 215 | −0,91 | 633 | 2,10 | ||||
| 2025-08-13 | 13F | Continuum Advisory, LLC | 0 | −100,00 | 0 | |||||
| 2025-08-04 | 13F | Saxony Capital Management, LLC | 0 | −100,00 | 0 | |||||
| 2025-08-12 | 13F | Advisors Asset Management, Inc. | 708 043 | 15,05 | 5 140 | 18,49 | ||||
| 2025-07-30 | 13F | Avidian Wealth Solutions, LLC | 15 075 | 0,00 | 109 | 2,83 | ||||
| 2025-08-13 | 13F | Summit Wealth Group Llc / Co | 233 846 | 1 698 | ||||||
| 2025-04-25 | 13F | Smallwood Wealth Investment Management, LLC | 65 720 | 0,00 | 463 | 3,35 | ||||
| 2025-07-09 | 13F | Presidio Capital Management, LLC | 27 963 | −19,24 | 203 | −16,80 | ||||
| 2025-08-08 | 13F | Hartland & Co., LLC | 3 987 | 0,00 | 29 | 0,00 | ||||
| 2025-08-11 | 13F | Inspire Advisors, LLC | 43 424 | 0,00 | 315 | 2,94 | ||||
| 2025-05-12 | 13F | Richard W. Paul & Associates, LLC | 0 | −100,00 | 0 | |||||
| 2025-08-05 | 13F | Carolinas Wealth Consulting Llc | 0 | −100,00 | 0 | −100,00 | ||||
| 2025-08-06 | 13F | Souders Financial Advisors | 15 617 | 0,00 | 113 | 2,73 | ||||
| 2025-07-15 | 13F | Norden Group Llc | 14 757 | 0,00 | 107 | 2,88 | ||||
| 2025-08-07 | 13F | Aspen Wealth Strategies, LLC | 0 | −100,00 | 0 | |||||
| 2025-07-11 | 13F | Seacrest Wealth Management, Llc | 70 494 | 11,91 | 512 | 15,09 | ||||
| 2025-08-06 | 13F | Golden State Wealth Management, LLC | 55 064 | 31,42 | 400 | 35,25 | ||||
| 2025-07-25 | 13F | Apollon Wealth Management, LLC | 248 213 | 5,40 | 1 802 | 8,55 | ||||
| 2025-08-07 | 13F | Allworth Financial LP | 50 691 | 3,05 | 368 | 12,54 | ||||
| 2025-08-12 | 13F | LPL Financial LLC | 2 493 616 | −8,66 | 18 104 | −5,94 | ||||
| 2025-07-25 | 13F | Endowment Wealth Management, Inc. | 10 317 | −80,79 | 75 | −80,42 | ||||
| 2025-07-30 | 13F/A | Divergent Planning, LLC | 11 030 | 0,00 | 81 | 3,90 | ||||
| 2025-08-11 | 13F | Anfield Capital Management, LLC | 37 956 | 0,00 | 276 | 3,00 | ||||
| 2025-08-13 | 13F | Denver Wealth Management, Inc. | 25 201 | 0,15 | 183 | 2,82 | ||||
| 2025-08-06 | 13F | AE Wealth Management LLC | 21 821 | 38,79 | 158 | 43,64 | ||||
| 2025-08-08 | 13F | Creative Planning | 111 707 | −2,77 | 811 | 0,12 | ||||
| 2025-07-07 | 13F | Capital Asset Advisory Services LLC | 30 538 | 0,00 | 223 | 3,74 | ||||
| 2025-07-15 | 13F | Mather Group, Llc. | 0 | −100,00 | 0 | |||||
| 2025-08-08 | 13F | Kingsview Wealth Management, LLC | 37 128 | −57,81 | 270 | −56,61 | ||||
| 2025-05-14 | 13F | CIBC Private Wealth Group, LLC | 0 | −100,00 | 0 | |||||
| 2025-07-10 | 13F | Exchange Traded Concepts, Llc | 946 | 7 | ||||||
| 2025-05-14 | 13F | CI Private Wealth, LLC | 0 | −100,00 | 0 | |||||
| 2025-07-16 | 13F/A | CX Institutional | 5 382 | 0,00 | 0 | |||||
| 2025-04-15 | 13F | Noble Wealth Management PBC | 188 956 | −60,41 | 1 332 | −59,07 | ||||
| 2025-07-29 | 13F | Vista Finance, Llc | 2 054 723 | 5,06 | 14 917 | 8,19 | ||||
| 2025-08-14 | 13F | Abound Financial, Llc | 0 | −100,00 | 0 | |||||
| 2025-09-12 | 13F/A | Valeo Financial Advisors, LLC | 15 045 | 0,00 | 109 | 2,83 | ||||
| 2025-07-29 | 13F | Mattson Financial Services, LLC | 0 | −100,00 | 0 | |||||
| 2025-08-13 | 13F | Thomas J. Herzfeld Advisors, Inc. | 3 223 806 | 2,51 | 23 405 | 5,56 | ||||
| 2025-08-01 | 13F | Clark Asset Management, LLC | 29 974 | 218 | ||||||
| 2025-05-15 | 13F | Concorde Asset Management, LLC | 146 789 | 4,41 | 979 | 2,19 | ||||
| 2025-07-09 | 13F | Fiduciary Alliance LLC | 27 691 | −25,55 | 201 | −23,28 | ||||
| 2025-08-08 | 13F | Avantax Advisory Services, Inc. | 1 677 372 | −12,73 | 12 178 | −10,13 | ||||
| 2025-07-10 | 13F | Wealth Enhancement Advisory Services, Llc | 227 737 | 100,08 | 1 649 | 105,49 | ||||
| 2025-08-05 | 13F | Bank of New York Mellon Corp | 233 038 | −13,03 | 1 692 | −10,43 | ||||
| 2025-08-07 | 13F | Apeiron RIA LLC | 71 225 | 2,89 | 517 | 5,94 | ||||
| 2025-07-16 | 13F | Vestia Personal Wealth Advisors | 21 797 | 2,80 | 158 | 6,04 | ||||
| 2025-07-21 | 13F | Catalina Capital Group, LLC | 66 098 | 0,00 | 480 | 3,01 | ||||
| 2025-08-11 | 13F | Mill Creek Capital Advisors, LLC | 21 423 | 156 | ||||||
| 2025-08-04 | 13F | Whalen Wealth Management Inc. | 158 256 | 1 149 | ||||||
| 2025-07-17 | 13F | Venture Visionary Partners LLC | 15 771 | −9,14 | 114 | −6,56 | ||||
| 2025-07-22 | 13F | Merit Financial Group, LLC | 147 340 | 8,44 | 1 070 | 11,70 | ||||
| 2025-08-14 | 13F | Investmark Advisory Group LLC | 85 537 | −25,53 | 621 | −23,24 | ||||
| 2025-07-22 | 13F | Steele Capital Management, Inc. | 60 000 | 0,00 | 436 | 2,84 | ||||
| 2025-08-08 | 13F | Larson Financial Group LLC | 4 722 | 0,00 | 34 | 3,03 | ||||
| 2025-07-15 | 13F | Financial Partners Group, Inc | 19 216 | −6,24 | 140 | −3,47 | ||||
| 2025-08-12 | 13F | Jpmorgan Chase & Co | 6 702 | −20,75 | 49 | −18,64 | ||||
| 2025-07-15 | 13F | Oregon Pacific Wealth Management, LLC | 32 201 | −1,83 | 234 | 0,87 | ||||
| 2025-08-14 | 13F | CoreCap Advisors, LLC | 12 553 | 57,23 | 91 | 62,50 | ||||
| 2025-07-17 | 13F | Paradigm Financial Partners, Llc | 148 486 | −0,98 | 1 078 | 1,99 | ||||
| 2025-07-25 | 13F | Atria Wealth Solutions, Inc. | 0 | −100,00 | 0 | |||||
| 2025-07-28 | 13F | Axxcess Wealth Management, Llc | 30 538 | 0,00 | 222 | 2,79 | ||||
| 2025-08-14 | 13F | Citadel Advisors Llc | 16 286 | 118 | ||||||
| 2025-08-06 | 13F | Moors & Cabot, Inc. | 38 849 | 15,65 | 282 | 19,49 | ||||
| 2025-07-10 | 13F | Signal Advisors Wealth, LLC | 69 900 | 507 | ||||||
| 2025-08-14 | 13F | LaSalle St. Investment Advisors, LLC | 32 748 | 0 | ||||||
| 2025-08-15 | 13F | First Heartland Consultants, Inc. | 12 219 | 0,00 | 89 | 2,33 | ||||
| 2025-07-16 | 13F | Signaturefd, Llc | 0 | −100,00 | 0 | |||||
| 2025-08-11 | 13F | Blue Bell Private Wealth Management, Llc | 4 892 | 0,00 | 36 | 2,94 | ||||
| 2025-08-14 | 13F | Arete Wealth Advisors, LLC | 196 946 | −4,68 | 1 | 0,00 | ||||
| 2025-07-30 | 13F | Townsend & Associates, Inc | 14 999 | 0,00 | 111 | 13,27 | ||||
| 2025-05-05 | 13F | Lindbrook Capital, Llc | 0 | −100,00 | 0 | |||||
| 2025-08-11 | 13F | Aptus Capital Advisors, LLC | 11 473 | 83 | ||||||
| 2025-08-27 | 13F/A | Brinker Capital Investments, LLC | 561 636 | 5,80 | 4 077 | 8,95 | ||||
| 2025-07-08 | 13F | Adamsbrown Wealth Consultants Llc | 18 684 | 0,00 | 136 | 3,05 | ||||
| 2025-08-12 | 13F | Gladstone Institutional Advisory LLC | 10 505 | −29,92 | 76 | −27,62 | ||||
| 2025-08-15 | 13F | Kestra Advisory Services, LLC | 687 604 | 2,39 | 4 992 | 5,45 | ||||
| 2025-08-12 | 13F | PSI Advisors, LLC | 0 | −100,00 | 0 | |||||
| 2025-08-04 | 13F | Keybank National Association/oh | 26 363 | 0,00 | 191 | 3,24 | ||||
| 2025-08-11 | 13F | Private Advisor Group, LLC | 245 600 | 4,97 | 1 783 | 8,13 | ||||
| 2025-08-12 | 13F | Global Retirement Partners, LLC | 16 753 | −90,12 | 122 | −89,53 | ||||
| 2025-07-28 | 13F | Acorn Financial Advisory Services Inc /adv | 42 221 | −11,55 | 307 | −8,93 | ||||
| 2025-07-11 | 13F | Compass Ion Advisors, LLC | 12 806 | 0,00 | 93 | 2,22 | ||||
| 2025-08-14 | 13F | Jane Street Group, Llc | 42 680 | 310 | ||||||
| 2025-08-11 | 13F | WPG Advisers, LLC | 10 893 | −8,43 | 79 | −4,82 | ||||
| 2025-08-13 | 13F | First Trust Advisors Lp | 411 026 | 1,63 | 2 984 | 4,67 | ||||
| 2025-07-23 | 13F | Tyche Wealth Partners LLC | 12 096 | 88 | ||||||
| 2025-07-18 | 13F | PFG Investments, LLC | 158 353 | −3,56 | 1 150 | −0,69 | ||||
| 2025-07-16 | 13F | BOS Asset Management, LLC | 33 537 | 0,00 | 243 | 2,97 | ||||
| 2025-08-05 | 13F | Atlas Private Wealth Advisors | 48 678 | 13,71 | 353 | 17,28 | ||||
| 2025-08-13 | 13F | Invesco Ltd. | 309 787 | 40,54 | 2 249 | 44,82 | ||||
| 2025-08-14 | 13F | Atomi Financial Group, Inc. | 81 341 | 0,45 | 591 | 3,51 | ||||
| 2025-07-14 | 13F | AdvisorNet Financial, Inc | 50 481 | 6,32 | 366 | 9,58 | ||||
| 2025-05-15 | 13F/A | Orion Portfolio Solutions, LLC | 530 841 | 13,42 | 3 742 | 17,27 | ||||
| 2025-07-30 | 13F | Bleakley Financial Group, LLC | 62 306 | 2,82 | 452 | 5,85 | ||||
| 2025-08-13 | 13F | Legacy Capital Wealth Partners, LLC | 28 800 | 0,00 | 209 | 2,96 | ||||
| 2025-07-25 | NP | FCEF - First Trust CEF Income Opportunity ETF This fund is a listed as child fund of First Trust Advisors Lp and if that institution has disclosed ownership in this security, then these positions will not be double counted when calculating total shares and total value | 192 125 | 1,05 | 1 387 | 4,52 | ||||
| 2025-08-14 | 13F | Mml Investors Services, Llc | 0 | −100,00 | 0 | |||||
| 2025-08-14 | 13F | Gen-Wealth Partners Inc | 23 066 | 0,00 | 167 | 3,09 | ||||
| 2025-05-16 | 13F/A | Kestra Investment Management, LLC | 0 | −100,00 | 0 | −100,00 | ||||
| 2025-08-04 | 13F | Creative Financial Designs Inc /adv | 110 701 | 2,30 | 804 | 5,38 | ||||
| 2025-08-13 | 13F | Quadrature Capital Ltd | 10 844 | −3,69 | 79 | −1,27 | ||||
| 2025-07-21 | 13F | Precedent Wealth Partners, Llc | 18 363 | 133 | ||||||
| 2025-08-18 | 13F | Hollencrest Capital Management | 1 599 | 2,76 | 12 | 10,00 | ||||
| 2025-07-16 | 13F | Castleview Partners, Llc | 82 186 | 32,35 | 597 | 36,38 | ||||
| 2025-07-22 | 13F | Ergawealth Advisors, Inc. | 17 818 | 129 | ||||||
| 2025-08-08 | 13F | Good Life Advisors, LLC | 66 888 | −1,45 | 486 | 1,46 | ||||
| 2025-07-17 | 13F | LexAurum Advisors, LLC | 38 778 | 17,21 | 282 | 20,60 | ||||
| 2025-05-12 | 13F | True North Advisors, LLC | 0 | −100,00 | 0 | −100,00 | ||||
| 2025-08-06 | 13F | Prospera Financial Services Inc | 44 989 | 327 | ||||||
| 2025-08-12 | 13F | J.w. Cole Advisors, Inc. | 145 511 | 2,34 | 1 056 | 5,39 | ||||
| 2025-07-08 | 13F | Strategic Advocates LLC | 33 117 | 0,00 | 240 | 3,00 | ||||
| 2025-08-12 | 13F | Cadence Wealth Management LLC | 17 205 | 0,00 | 125 | 2,48 | ||||
| 2025-07-14 | 13F | Park Avenue Securities Llc | 17 470 | 0 | ||||||
| 2025-07-30 | 13F | Rehmann Capital Advisory Group | 13 840 | 2,80 | 100 | 6,38 | ||||
| 2025-05-29 | NP | MCTOX - Modern Capital Tactical Opportunities Fund Class A Shares | 109 201 | −53,01 | 770 | −51,45 | ||||
| 2025-08-04 | 13F | Arkadios Wealth Advisors | 98 864 | 38,58 | 718 | 42,83 | ||||
| 2025-07-16 | 13F | Independent Wealth Network Inc. | 54 039 | −2,60 | 392 | 0,26 | ||||
| 2025-07-22 | 13F | BridgePort Financial Solutions, LLC | 14 407 | 0,00 | 105 | 2,97 |