Grundläggande statistik
| Institutionella ägare | 177 total, 177 long only, 0 short only, 0 long/short - change of 5,99% MRQ |
| Genomsnittlig portföljallokering | 0.1197 % - change of −2,56% MRQ |
| Institutionella aktier (lång) | 3 147 225 (ex 13D/G) - change of −0,07MM shares −2,21% MRQ |
| Institutionellt värde (lång) | $ 420 773 USD ($1000) |
Institutionellt ägande och aktieägare
First Trust Exchange-Traded Fund - First Trust US Equity Opportunities ETF (US:FPX) har 177 Institutionella ägare och aktieägare som har lämnat in 13D/G- eller 13F-formulär till Securities Exchange Commission (SEC). Dessa institut innehar totalt 3,147,225 aktier. Största aktieägare inkluderar Morgan Stanley, LPL Financial LLC, Wells Fargo & Company/mn, Raymond James Financial Inc, Bank Of America Corp /de/, Congress Wealth Management LLC / DE /, Cetera Investment Advisers, Commonwealth Equity Services, Llc, Cassia Capital Partners, LLC, and Cambridge Investment Research Advisors, Inc. .
First Trust Exchange-Traded Fund - First Trust US Equity Opportunities ETF (ARCA:FPX) Institutionell ägarstruktur visar institutioners och fonders nuvarande positioner i företaget, samt de senaste förändringarna i positionernas storlek. Större aktieägare kan vara enskilda investerare, fonder, hedgefonder eller institutioner. Bilaga 13D visar att investeraren äger (eller ägde) mer än 5% av företaget och avser (eller avsåg) att aktivt eftersträva en förändring av affärsstrategin. Schedule 13G indikerar en passiv investering på över 5%.
The share price as of September 11, 2025 is 158,76 / share. Previously, on September 12, 2024, the share price was 103,85 / share. This represents an increase of 52,87% over that period.

Fondsentimentets poäng
Fondsentimentet poängen(fka Ägarackumulation-poäng) visar vilka aktier som är mest köpta av fonder. Det är resultatet av en sofistikerad kvantitativ flerfaktormodell som identifierar företag med de högsta nivåerna av institutionell ackumulering. Poängsättningsmodellen använder en kombination av den totala ökningen av redovisade ägare, förändringarna i portföljallokeringarna för dessa ägare och andra mått. Siffran sträcker sig från 0 till 100, där högre siffror indikerar en högre nivå av ackumulering i förhållande till sina konkurrenter, och 50 är genomsnittet.
Uppdateringsfrekvens: Dagligen
Se Ownership Explorer, som innehåller en lista över de högst rankade företagen.
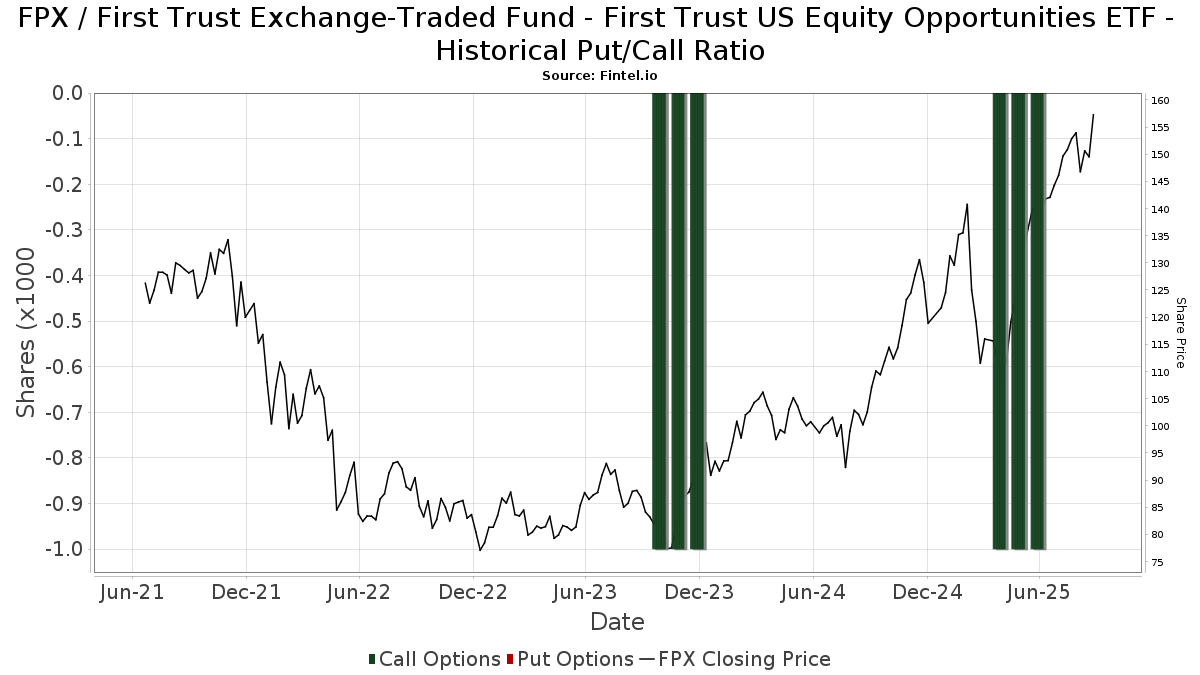
Institutionell sälj/köp-kvot
Förutom att rapportera vanliga eget kapital- och skuldemissioner måste institutioner med mer än 100MM tillgångar under förvaltning också avslöja sina innehav av sälj- och köpoptioner. Eftersom säljoptioner i allmänhet indikerar ett negativt sentiment och köpoptioner indikerar ett positivt sentiment, kan vi få en uppfattning om det övergripande institutionella sentimentet genom att plotta förhållandet mellan säljoptioner och köpoptioner. Diagrammet till höger visar det historiska förhållandet mellan sälj- och köpoptioner för detta instrument.
Genom att använda sälj/köp-kvoten som en indikator på aktieägarnas sentiment undviker man en av de största bristerna med att använda det totala institutionella ägandet, nämligen att en betydande del av de förvaltade tillgångarna investeras passivt för att följa index. Passivt förvaltade fonder köper vanligtvis inte optioner, så indikatorn för sälj/köp-kvoten ger en bättre bild av stämningen i aktivt förvaltade fonder.
13F- och NPORT-arkiveringar
Detaljer om 13F-arkiveringar är gratis. Detaljer om NP-arkiveringar kräver ett premiummedlemskap. Gröna rader indikerar nya positioner. Röda rader indikerar stängda positioner. Klicka på länk symbolen för att se hela transaktionshistoriken.
Uppgradera
för att låsa upp premiumdata och exportera till Excel ![]() .
.
| Fil Datum | Källa | Investerare | Typ | Genomsnittligt pris (beräknat) |
Aktier | Δ Aktier (%) |
Rapporterat värde (1000 USD) |
Δ Värde (%) |
Portföljallokering (%) |
|
|---|---|---|---|---|---|---|---|---|---|---|
| 2025-05-06 | 13F | VSM Wealth Advisory, LLC | 0 | −100,00 | 0 | |||||
| 2025-08-12 | 13F | Cornerstone Wealth Management, LLC | 4 223 | −2,47 | 612 | 26,50 | ||||
| 2025-07-28 | 13F | RFG Advisory, LLC | 3 806 | 2,62 | 552 | 33,09 | ||||
| 2025-08-08 | 13F | Smithfield Trust Co | 1 067 | 0,00 | 0 | |||||
| 2025-08-11 | 13F | Core Wealth Partners LLC | 0 | −100,00 | 0 | |||||
| 2025-08-14 | 13F | SWAN Capital LLC | 27 | 0,00 | 4 | 0,00 | ||||
| 2025-08-04 | 13F | Kovack Advisors, Inc. | 5 258 | −0,57 | 762 | 28,98 | ||||
| 2025-07-14 | 13F | GAMMA Investing LLC | 100 | 0,00 | 14 | 27,27 | ||||
| 2025-08-01 | 13F | Rossby Financial, LCC | 3 | 0,00 | 0 | |||||
| 2025-08-06 | 13F | Wedbush Securities Inc | 2 651 | 30,27 | 0 | |||||
| 2025-08-14 | 13F | Comerica Bank | 33 | 0,00 | 5 | 33,33 | ||||
| 2025-07-29 | 13F | Kraft, Davis & Associates, LLC | 5 933 | −8,96 | 893 | 27,07 | ||||
| 2025-04-23 | 13F | B.O.S.S. Retirement Advisors, LLC | 0 | −100,00 | 0 | −100,00 | ||||
| 2025-04-21 | 13F | ORG Partners LLC | 0 | −100,00 | 0 | |||||
| 2025-08-14 | 13F | Jane Street Group, Llc | 0 | −100,00 | 0 | |||||
| 2025-05-15 | 13F | FSA Wealth Management LLC | 0 | −100,00 | 0 | |||||
| 2025-07-09 | 13F | Triumph Capital Management | 2 089 | 303 | ||||||
| 2025-07-30 | 13F | Paul Damon & Associates, Inc. | 2 327 | 0,00 | 337 | 29,62 | ||||
| 2025-07-21 | 13F | Ntv Asset Management Llc | 23 961 | 297,36 | 3 472 | 415,90 | ||||
| 2025-04-23 | 13F | Continuum Advisory, LLC | 0 | −100,00 | 0 | −100,00 | ||||
| 2025-08-11 | 13F | Cannon Advisors, Inc. | 1 501 | 218 | ||||||
| 2025-08-14 | 13F | IHT Wealth Management, LLC | 6 834 | 0,03 | 990 | 29,75 | ||||
| 2025-07-22 | 13F | Legacy Trust | 0 | −100,00 | 0 | |||||
| 2025-07-17 | 13F | Janney Montgomery Scott LLC | 48 132 | 2,30 | 7 | 20,00 | ||||
| 2025-08-11 | 13F | Citigroup Inc | 758 | 0,00 | 110 | 29,76 | ||||
| 2025-05-15 | 13F | Banque Transatlantique SA | 0 | −100,00 | 0 | |||||
| 2025-07-24 | 13F | Trust Co Of Toledo Na /oh/ | 200 | 29 | ||||||
| 2025-09-04 | 13F/A | Advisor Group Holdings, Inc. | 30 441 | 10,37 | 4 409 | 43,02 | ||||
| 2025-08-06 | 13F | First Horizon Advisors, Inc. | 300 | 43 | ||||||
| 2025-08-12 | 13F | LPL Financial LLC | 470 048 | 20,49 | 68 115 | 56,26 | ||||
| 2025-08-04 | 13F | Pensionmark Financial Group, Llc | 2 337 | 0,00 | 339 | 29,50 | ||||
| 2025-08-08 | 13F | Pnc Financial Services Group, Inc. | 965 | −21,99 | 140 | 0,72 | ||||
| 2025-08-13 | 13F | VestGen Advisors, LLC | 5 681 | 12,07 | 823 | 45,41 | ||||
| 2025-04-25 | 13F | New Millennium Group LLC | 0 | −100,00 | 0 | |||||
| 2025-08-12 | 13F | Global Retirement Partners, LLC | 230 | −54,64 | 33 | −45,00 | ||||
| 2025-07-10 | 13F | Capital Advisory Group Advisory Services, LLC | 3 108 | 0,00 | 450 | 29,68 | ||||
| 2025-08-06 | 13F | Commonwealth Equity Services, Llc | 86 521 | −2,49 | 13 | 33,33 | ||||
| 2025-08-01 | 13F | Belvedere Trading LLC | Call | 1 500 | 217 | |||||
| 2025-08-12 | 13F | Steward Partners Investment Advisory, Llc | 11 626 | −14,15 | 1 685 | 11,30 | ||||
| 2025-07-15 | 13F | Cassia Capital Partners, LLC | 64 269 | −3,14 | 9 313 | 25,61 | ||||
| 2025-08-15 | 13F | Puff Wealth Management, Llc | 7 054 | 283,16 | 268 | 30,24 | ||||
| 2025-07-22 | 13F | Luken Investment Analytics, LLC | 565 | 0,00 | 82 | 28,57 | ||||
| 2025-07-29 | 13F | Signature Estate & Investment Advisors Llc | 11 556 | −1,97 | 1 675 | 27,11 | ||||
| 2025-08-12 | 13F | SRS Capital Advisors, Inc. | 4 240 | −5,90 | 614 | 22,07 | ||||
| 2025-08-12 | 13F | Insigneo Advisory Services, Llc | 1 577 | 229 | ||||||
| 2025-08-14 | 13F | Mariner, LLC | 17 029 | −10,37 | 2 468 | 16,20 | ||||
| 2025-07-21 | 13F | Ameritas Advisory Services, LLC | 6 747 | 978 | ||||||
| 2025-05-15 | 13F | Citadel Advisors Llc | 0 | −100,00 | 0 | |||||
| 2025-07-23 | 13F | Integris Wealth Management, LLC | 1 772 | 257 | ||||||
| 2025-07-17 | 13F | City Holding Co | 900 | 0,00 | 130 | 30,00 | ||||
| 2025-08-11 | 13F | October Effect Ltd | 2 736 | 396 | ||||||
| 2025-05-01 | 13F | Quest 10 Wealth Builders, Inc. | 0 | −100,00 | 0 | |||||
| 2025-05-05 | 13F | Transce3nd, LLC | 0 | −100,00 | 0 | |||||
| 2025-07-17 | 13F | Wolff Wiese Magana Llc | 8 | 0,00 | 1 | |||||
| 2025-08-08 | 13F | Wiser Advisor Group LLC | 0 | −100,00 | 0 | |||||
| 2025-05-29 | 13F | Apeiron RIA LLC | 0 | −100,00 | 0 | |||||
| 2025-08-13 | 13F | Northwestern Mutual Wealth Management Co | 1 044 | 36,29 | 151 | 77,65 | ||||
| 2025-08-01 | 13F | Envestnet Asset Management Inc | 45 506 | −38,50 | 6 594 | −20,24 | ||||
| 2025-08-05 | 13F | GPS Wealth Strategies Group, LLC | 384 | 0,00 | 56 | 30,95 | ||||
| 2025-08-12 | 13F | Calton & Associates, Inc. | 13 503 | −7,85 | 1 957 | 19,49 | ||||
| 2025-08-08 | 13F | Intrua Financial, LLC | 2 271 | −1,09 | 329 | 28,52 | ||||
| 2025-08-11 | 13F | Western Wealth Management, LLC | 20 569 | −1,41 | 2 981 | 27,84 | ||||
| 2025-08-19 | 13F | Newbridge Financial Services Group, Inc. | 150 | 22 | ||||||
| 2025-08-14 | 13F | Royal Bank Of Canada | 46 696 | −9,04 | 6 766 | 17,96 | ||||
| 2025-08-11 | 13F/A | Purus Wealth Management, LLC | 2 117 | 0,00 | 307 | 29,66 | ||||
| 2025-05-09 | 13F | GeoWealth Management, LLC | 0 | −100,00 | 0 | |||||
| 2025-08-19 | 13F | Advisory Services Network, LLC | 6 076 | −5,75 | 925 | 28,33 | ||||
| 2025-08-13 | 13F | Smith, Moore & Co. | 2 637 | −5,11 | 382 | 23,23 | ||||
| 2025-07-09 | 13F | Clarus Wealth Advisors | 1 474 | 211 | ||||||
| 2025-08-14 | 13F | Fmr Llc | 3 552 | 3,35 | 515 | 33,85 | ||||
| 2025-08-06 | 13F | AE Wealth Management LLC | 7 809 | 196,58 | 1 132 | 284,69 | ||||
| 2025-04-17 | 13F | Sound Income Strategies, LLC | 0 | −100,00 | 0 | |||||
| 2025-08-05 | 13F | Simplex Trading, Llc | 71 | 0 | ||||||
| 2025-08-08 | 13F | Larson Financial Group LLC | 367 | 53 | ||||||
| 2025-08-15 | 13F | Kestra Advisory Services, LLC | 22 103 | 18,01 | 3 203 | 53,06 | ||||
| 2025-08-05 | 13F | Carolinas Wealth Consulting Llc | 0 | −100,00 | 0 | −100,00 | ||||
| 2025-08-14 | 13F | Stifel Financial Corp | 8 464 | 6,94 | 1 227 | 38,69 | ||||
| 2025-08-14 | 13F | CIBC World Markets Inc. | 2 413 | 0,00 | 350 | 29,74 | ||||
| 2025-07-25 | 13F | Cascade Investment Advisors, Inc. | 6 791 | 0,30 | 984 | 30,16 | ||||
| 2025-08-04 | 13F | Spire Wealth Management | 638 | 0,00 | 92 | 29,58 | ||||
| 2025-05-15 | 13F | Pinnacle Family Advisors, LLC | 0 | −100,00 | 0 | |||||
| 2025-05-15 | 13F | Two Sigma Securities, Llc | 0 | −100,00 | 0 | −100,00 | ||||
| 2025-08-14 | 13F | GWM Advisors LLC | 42 669 | 387,92 | 6 183 | 532,86 | ||||
| 2025-07-31 | 13F | Richards, Merrill & Peterson, Inc. | 0 | −100,00 | 0 | |||||
| 2025-07-29 | 13F | Cottonwood Capital Advisors, Llc | 2 351 | 0,00 | 341 | 29,77 | ||||
| 2025-07-28 | 13F | Smart Portfolios, LLC | 2 120 | −0,70 | 307 | 28,99 | ||||
| 2025-08-13 | 13F | Cresset Asset Management, LLC | 2 844 | 0,00 | 412 | 29,97 | ||||
| 2025-08-14 | 13F | Snowden Capital Advisors LLC | 1 916 | −9,71 | 278 | 16,88 | ||||
| 2025-08-07 | 13F | Allworth Financial LP | 2 749 | 0,00 | 398 | 24,76 | ||||
| 2025-07-29 | 13F | Stratos Wealth Partners, LTD. | 2 972 | −10,32 | 431 | 16,22 | ||||
| 2025-07-17 | 13F | Eclectic Associates Inc /adv | 10 977 | −13,48 | 1 590 | 12,14 | ||||
| 2025-05-06 | 13F | Alpha Omega Group, Inc. | 0 | −100,00 | 0 | |||||
| 2025-07-31 | 13F | Cambridge Investment Research Advisors, Inc. | 60 332 | 2,44 | 9 | 33,33 | ||||
| 2025-08-08 | 13F | SBI Securities Co., Ltd. | 75 | 1,35 | 11 | 25,00 | ||||
| 2025-07-25 | 13F | Hazlett, Burt & Watson, Inc. | 227 | 238,81 | 0 | |||||
| 2025-08-13 | 13F | Kayne Anderson Rudnick Investment Management Llc | 2 050 | 0,00 | 297 | 29,26 | ||||
| 2025-07-31 | 13F | Oppenheimer & Co Inc | 2 072 | 0,00 | 300 | 29,87 | ||||
| 2025-08-05 | 13F | Sigma Planning Corp | 4 738 | 687 | ||||||
| 2025-08-15 | 13F | Captrust Financial Advisors | 7 953 | 103,04 | 1 153 | 163,62 | ||||
| 2025-08-12 | 13F | Country Trust Bank | 27 | 0,00 | 4 | 0,00 | ||||
| 2025-07-21 | 13F | Keystone Financial Group, Inc. | 18 | −28,00 | 3 | −33,33 | ||||
| 2025-08-12 | 13F | O'shaughnessy Asset Management, Llc | 236 | −6,72 | 34 | 21,43 | ||||
| 2025-08-12 | 13F | Jpmorgan Chase & Co | 1 | −99,98 | 0 | −100,00 | ||||
| 2025-08-11 | 13F | Hexagon Capital Partners LLC | 0 | −100,00 | 0 | |||||
| 2025-08-18 | 13F | Tyler-Stone Wealth Management | 2 973 | 0,03 | 431 | 29,52 | ||||
| 2025-07-23 | 13F | Indiana Trust & Investment Management CO | 99 | 0,00 | 14 | 27,27 | ||||
| 2025-08-14 | 13F | Hrt Financial Lp | 7 082 | 231,09 | 1 | |||||
| 2025-07-10 | 13F | Kozak & Associates, Inc. | 63 | 0,00 | 9 | 50,00 | ||||
| 2025-08-13 | 13F | Twin Peaks Wealth Advisors, LLC | 37 326 | −3,72 | 5 802 | 35,22 | ||||
| 2025-07-08 | 13F | Nbc Securities, Inc. | 3 265 | 172,31 | 0 | |||||
| 2025-07-11 | 13F | Kapstone Financial Advisors LLC | 1 616 | 234 | ||||||
| 2025-07-28 | 13F | Harbour Investments, Inc. | 28 684 | 1,02 | 4 157 | 31,02 | ||||
| 2025-07-22 | 13F | Accel Wealth Management | 1 698 | 246 | ||||||
| 2025-08-04 | 13F | Atria Investments Llc | 11 927 | −8,82 | 1 728 | 18,28 | ||||
| 2025-08-08 | 13F | Creative Planning | 7 363 | 4,54 | 1 067 | 35,45 | ||||
| 2025-08-14 | 13F | UBS Group AG | 46 057 | −22,26 | 6 674 | 0,82 | ||||
| 2025-08-08 | 13F | Cetera Investment Advisers | 88 347 | −10,42 | 12 802 | 16,18 | ||||
| 2025-08-12 | 13F | Jaffetilchin Investment Partners, LLC | 4 091 | 0,02 | 593 | 29,54 | ||||
| 2025-08-04 | 13F | Integrity Alliance, Llc. | 2 836 | −73,04 | 411 | −65,11 | ||||
| 2025-08-07 | 13F | Commerce Bank | 2 200 | 0,00 | 319 | 29,80 | ||||
| 2025-07-29 | 13F | Private Trust Co Na | 544 | 4,41 | 79 | 34,48 | ||||
| 2025-08-14 | 13F | CoreCap Advisors, LLC | 192 | 0,00 | 28 | 28,57 | ||||
| 2025-04-24 | 13F | Decker Retirement Planning Inc. | 0 | −100,00 | 0 | |||||
| 2025-08-15 | 13F | Tower Research Capital LLC (TRC) | 1 | 0,00 | 0 | |||||
| 2025-07-22 | 13F | Appleton Partners Inc/ma | 1 716 | 0 | ||||||
| 2025-08-15 | 13F | CI Private Wealth, LLC | 2 786 | 7,98 | 404 | 39,93 | ||||
| 2025-07-30 | 13F | Pacific Sun Financial Corp | 8 049 | 0,00 | 1 166 | 29,70 | ||||
| 2025-08-14 | 13F | Prestige Wealth Management Group LLC | 177 | 0,00 | 26 | 31,58 | ||||
| 2025-05-14 | 13F | Flow Traders U.s. Llc | 0 | −100,00 | 0 | |||||
| 2025-07-23 | 13F | Morey & Quinn Wealth Partners, LLC | 4 159 | −10,69 | 603 | 15,77 | ||||
| 2025-07-18 | 13F | Truist Financial Corp | 31 752 | −46,61 | 4 601 | −30,76 | ||||
| 2025-08-14 | 13F | Wells Fargo & Company/mn | 313 831 | 9,35 | 45 477 | 41,81 | ||||
| 2025-08-12 | 13F | Putnam Fl Investment Management Co | 1 642 | 238 | ||||||
| 2025-08-14 | 13F | Ancora Advisors, LLC | 7 813 | 0,00 | 1 132 | 29,67 | ||||
| 2025-07-29 | 13F | Chicago Partners Investment Group LLC | 19 207 | −1,22 | 2 874 | 20,00 | ||||
| 2025-07-15 | 13F | tru Independence LLC | 1 424 | 206 | ||||||
| 2025-08-06 | 13F | Golden State Wealth Management, LLC | 19 380 | −7,94 | 2 808 | 19,39 | ||||
| 2025-07-30 | 13F | D.a. Davidson & Co. | 26 357 | −8,00 | 3 820 | 19,31 | ||||
| 2025-08-13 | 13F | Proactive Wealth Strategies LLC | 20 231 | −6,92 | 3 | 0,00 | ||||
| 2025-04-14 | 13F | Lloyd Advisory Services, LLC. | 0 | −100,00 | 0 | |||||
| 2025-07-24 | 13F | IFP Advisors, Inc | 355 | 0,00 | 51 | 30,77 | ||||
| 2025-08-13 | 13F | Bernardo Wealth Planning LLC | 0 | −100,00 | 0 | |||||
| 2025-08-14 | 13F | Raymond James Financial Inc | 145 503 | 19,54 | 21 085 | 55,03 | ||||
| 2025-08-14 | 13F | Beaird Harris Wealth Management, LLC | 274 | 0,00 | 40 | 30,00 | ||||
| 2025-07-24 | 13F | Blair William & Co/il | 440 | −72,12 | 64 | −64,20 | ||||
| 2025-08-14 | 13F/A | Perritt Capital Management Inc | 0 | −100,00 | 0 | −100,00 | ||||
| 2025-07-28 | 13F | Rosenberg Matthew Hamilton | 86 | 0,00 | 12 | 33,33 | ||||
| 2025-07-30 | 13F | Patten Group, Inc. | 3 011 | −4,87 | 436 | 23,51 | ||||
| 2025-08-08 | 13F | Avantax Advisory Services, Inc. | 2 279 | −12,65 | 330 | 13,40 | ||||
| 2025-08-07 | 13F | Brio Consultants, LLC | 0 | −100,00 | 0 | −100,00 | ||||
| 2025-08-13 | 13F | Capital Analysts, Inc. | 70 | 0,00 | 0 | |||||
| 2025-08-04 | 13F | IFG Advisory, LLC | 8 263 | 42,34 | 1 197 | 84,72 | ||||
| 2025-08-12 | 13F | Spectrum Wealth Advisory Group, LLC | 11 684 | −0,49 | 1 693 | 29,04 | ||||
| 2025-08-14 | 13F | Financial Engines Advisors L.L.C. | 1 783 | 258 | ||||||
| 2025-07-24 | 13F | Costello Asset Management, INC | 543 | 0,00 | 79 | 30,00 | ||||
| 2025-07-30 | 13F | Onyx Bridge Wealth Group LLC | 16 047 | −0,11 | 2 325 | 29,53 | ||||
| 2025-07-15 | 13F | FLP Wealth Management, LLC | 0 | −100,00 | 0 | |||||
| 2025-04-23 | 13F | Atala Financial Inc | 0 | −100,00 | 0 | |||||
| 2025-08-14 | 13F | Susquehanna International Group, Llp | 29 188 | 103,40 | 4 230 | 163,82 | ||||
| 2025-04-17 | 13F | Grove Bank & Trust | 0 | −100,00 | 0 | |||||
| 2025-07-15 | 13F | Mather Group, Llc. | 0 | −100,00 | 0 | |||||
| 2025-08-07 | 13F | PCG Wealth Advisors, LLC | 7 995 | −1,32 | 1 159 | 27,96 | ||||
| 2025-08-05 | 13F | Bank of New York Mellon Corp | 2 060 | −0,05 | 299 | 29,57 | ||||
| 2025-08-14 | 13F | Benjamin Edwards Inc | 4 653 | 3,03 | 674 | 33,73 | ||||
| 2025-08-19 | 13F | National Asset Management, Inc. | 1 930 | −38,52 | 280 | −25,60 | ||||
| 2025-07-10 | 13F | Wealth Enhancement Advisory Services, Llc | 26 087 | −1,63 | 3 753 | 26,63 | ||||
| 2025-07-23 | 13F | Tcfg Wealth Management, Llc | 3 472 | −2,44 | 503 | 26,70 | ||||
| 2025-08-14 | 13F | Moneta Group Investment Advisors Llc | 1 403 | 203 | ||||||
| 2025-07-28 | 13F | BRYN MAWR TRUST Co | 350 | 0,00 | 51 | 28,21 | ||||
| 2025-08-14 | 13F | Goldman Sachs Group Inc | 0 | −100,00 | 0 | |||||
| 2025-08-18 | 13F | Hershey Financial Advisers, LLC | 3 082 | 447 | ||||||
| 2025-08-14 | 13F | Mml Investors Services, Llc | 7 949 | 64,07 | 1 | |||||
| 2025-08-14 | 13F | Two Sigma Investments, Lp | 4 070 | 590 | ||||||
| 2025-08-08 | 13F | Accredited Investors Inc. | 2 649 | 0,00 | 384 | 29,83 | ||||
| 2025-07-25 | 13F | Cwm, Llc | 2 189 | −0,36 | 0 | |||||
| 2025-05-12 | 13F | Sandy Spring Bank | 400 | 0,00 | 45 | −6,38 | ||||
| 2025-08-13 | 13F | StoneX Group Inc. | 2 308 | −10,99 | 334 | 15,57 | ||||
| 2025-05-07 | 13F | Bellwether Advisors, LLC | 0 | −100,00 | 0 | |||||
| 2025-05-12 | 13F | Independent Advisor Alliance | 0 | −100,00 | 0 | |||||
| 2025-08-04 | 13F | Impact Partnership Wealth, LLC | 7 030 | −36,95 | 1 019 | −18,23 | ||||
| 2025-08-12 | 13F | Concentrum Wealth Management | 5 507 | 0,00 | 798 | 29,76 | ||||
| 2025-08-04 | 13F | Assetmark, Inc | 410 | −14,41 | 59 | 11,32 | ||||
| 2025-08-12 | 13F | Ameritas Investment Partners, Inc. | 95 | 0,00 | 14 | 30,00 | ||||
| 2025-08-14 | 13F | Ameriprise Financial Inc | 36 558 | −9,56 | 5 299 | 16,62 | ||||
| 2025-08-14 | 13F | Money Concepts Capital Corp | 2 395 | 0,00 | 347 | 29,96 | ||||
| 2025-08-14 | 13F | Bnp Paribas Arbitrage, Sa | 0 | −100,00 | 0 | |||||
| 2025-07-07 | 13F | Investors Research Corp | 6 100 | 0,00 | 884 | 29,66 | ||||
| 2025-08-12 | 13F | Proequities, Inc. | 0 | 0 | ||||||
| 2025-04-21 | 13F | Ronald Blue Trust, Inc. | 0 | −100,00 | 0 | |||||
| 2025-07-07 | 13F | Global Wealth Strategies & Associates | 1 | 0,00 | 0 | |||||
| 2025-08-08 | 13F | Comprehensive Financial Planning, Inc./PA | 6 849 | 993 | ||||||
| 2025-07-11 | 13F | Farther Finance Advisors, LLC | 831 | 0,00 | 120 | 27,66 | ||||
| 2025-07-21 | 13F | DHJJ Financial Advisors, Ltd. | 6 | 0,00 | 1 | |||||
| 2025-08-07 | 13F | Midwest Trust Co | 1 427 | 207 | ||||||
| 2025-08-14 | 13F | Colony Group, LLC | 4 215 | 4,98 | 611 | 36,16 | ||||
| 2025-08-05 | 13F | Arrowroot Family Office, LLC | 1 855 | 0,00 | 269 | 21,27 | ||||
| 2025-08-13 | 13F | Baird Financial Group, Inc. | 10 457 | 6,35 | 1 515 | 37,98 | ||||
| 2025-08-06 | 13F | Prospera Financial Services Inc | 5 062 | 3,14 | 734 | 33,70 | ||||
| 2025-07-07 | 13F | RDA Financial Network | 5 237 | 0,00 | 759 | 29,57 | ||||
| 2025-08-14 | 13F | Bank Of America Corp /de/ | 113 370 | −18,29 | 16 428 | 5,97 | ||||
| 2025-08-14 | 13F | Diversify Advisory Services, LLC | 0 | −100,00 | 0 | |||||
| 2025-08-11 | 13F | Principal Securities, Inc. | 216 | −33,13 | 31 | −18,42 | ||||
| 2025-04-21 | 13F | Envestnet Portfolio Solutions, Inc. | 0 | −100,00 | 0 | |||||
| 2025-07-18 | 13F | Pure Financial Advisors, Inc. | 2 580 | 2,79 | 374 | 33,21 | ||||
| 2025-08-07 | 13F | Private Advisory Group LLC | 0 | −100,00 | 0 | |||||
| 2025-08-14 | 13F | Synovus Financial Corp | 2 003 | 0,00 | 290 | 30,04 | ||||
| 2025-05-14 | 13F | Caitlin John, LLC | 0 | −100,00 | 0 | |||||
| 2025-08-13 | 13F | Congress Wealth Management LLC / DE / | 98 905 | 0,27 | 14 332 | 30,01 | ||||
| 2025-08-15 | 13F | Equitable Holdings, Inc. | 2 567 | −4,93 | 372 | 23,26 | ||||
| 2025-08-06 | 13F | Atlantic Union Bankshares Corp | 400 | 58 | ||||||
| 2025-08-15 | 13F | Morgan Stanley | 580 027 | −1,28 | 84 052 | 28,03 | ||||
| 2025-08-11 | 13F | HighTower Advisors, LLC | 27 945 | −1,16 | 4 049 | 28,17 | ||||
| 2025-08-05 | 13F | Atlas Private Wealth Advisors | 5 469 | −1,92 | 792 | 27,13 | ||||
| 2025-08-05 | 13F | Bank Of Montreal /can/ | 950 | 0,00 | 138 | 29,25 | ||||
| 2025-07-25 | 13F | Concurrent Investment Advisors, LLC | 5 681 | 13,87 | 823 | 47,76 | ||||
| 2025-08-12 | 13F | MAI Capital Management | 70 | −14,63 | 10 | 11,11 | ||||
| 2025-05-13 | 13F | EverSource Wealth Advisors, LLC | 0 | −100,00 | 0 | |||||
| 2025-07-09 | 13F | Dynamic Advisor Solutions LLC | 1 412 | 205 | ||||||
| 2025-07-15 | 13F | BKA Wealth Consulting, Inc. | 3 538 | 0,74 | 513 | 30,61 | ||||
| 2025-08-08 | 13F | Good Life Advisors, LLC | 17 642 | −22,32 | 2 556 | 0,75 | ||||
| 2025-04-30 | 13F | Pineridge Advisors LLC | 0 | −100,00 | 0 | |||||
| 2025-08-11 | 13F | Private Advisor Group, LLC | 15 829 | 0,44 | 2 294 | 30,28 | ||||
| 2025-04-23 | 13F | Valmark Advisers, Inc. | 0 | −100,00 | 0 | |||||
| 2025-05-09 | 13F | Pathway Financial Advisers, LLC | 0 | −100,00 | 0 |
Other Listings
| MX:FPX |