Grundläggande statistik
| Institutionella ägare | 201 total, 201 long only, 0 short only, 0 long/short - change of 26,42% MRQ |
| Genomsnittlig portföljallokering | 0.5236 % - change of −2,17% MRQ |
| Institutionella aktier (lång) | 40 220 365 (ex 13D/G) - change of 15,77MM shares 64,48% MRQ |
| Institutionellt värde (lång) | $ 1 319 887 USD ($1000) |
Institutionellt ägande och aktieägare
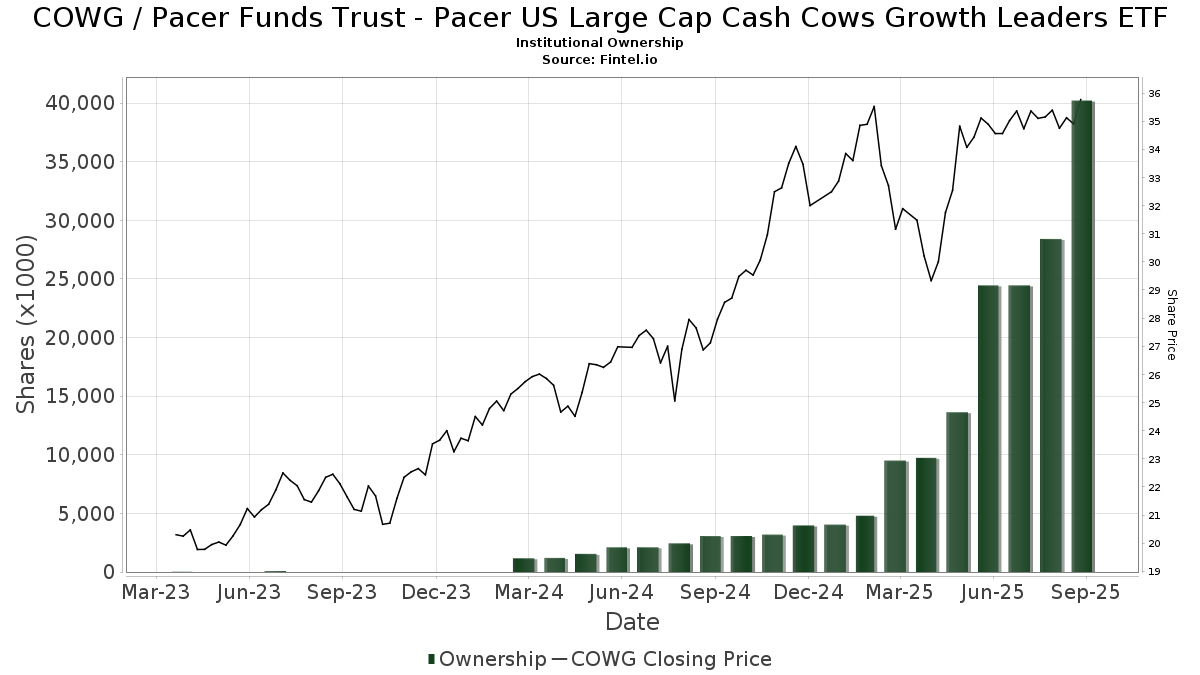
Pacer Funds Trust - Pacer US Large Cap Cash Cows Growth Leaders ETF (US:COWG) har 201 Institutionella ägare och aktieägare som har lämnat in 13D/G- eller 13F-formulär till Securities Exchange Commission (SEC). Dessa institut innehar totalt 40,220,365 aktier. Största aktieägare inkluderar Bank Of America Corp /de/, LPL Financial LLC, Morgan Stanley, Wells Fargo & Company/mn, Raymond James Financial Inc, Traphagen Investment Advisors Llc, Envestnet Asset Management Inc, Jones Financial Companies Lllp, Mml Investors Services, Llc, and Cambridge Investment Research Advisors, Inc. .
Pacer Funds Trust - Pacer US Large Cap Cash Cows Growth Leaders ETF (NasdaqGM:COWG) Institutionell ägarstruktur visar institutioners och fonders nuvarande positioner i företaget, samt de senaste förändringarna i positionernas storlek. Större aktieägare kan vara enskilda investerare, fonder, hedgefonder eller institutioner. Bilaga 13D visar att investeraren äger (eller ägde) mer än 5% av företaget och avser (eller avsåg) att aktivt eftersträva en förändring av affärsstrategin. Schedule 13G indikerar en passiv investering på över 5%.
The share price as of September 17, 2025 is 36,09 / share. Previously, on September 18, 2024, the share price was 27,96 / share. This represents an increase of 29,08% over that period.
Fondsentimentets poäng
Fondsentimentet poängen(fka Ägarackumulation-poäng) visar vilka aktier som är mest köpta av fonder. Det är resultatet av en sofistikerad kvantitativ flerfaktormodell som identifierar företag med de högsta nivåerna av institutionell ackumulering. Poängsättningsmodellen använder en kombination av den totala ökningen av redovisade ägare, förändringarna i portföljallokeringarna för dessa ägare och andra mått. Siffran sträcker sig från 0 till 100, där högre siffror indikerar en högre nivå av ackumulering i förhållande till sina konkurrenter, och 50 är genomsnittet.
Uppdateringsfrekvens: Dagligen
Se Ownership Explorer, som innehåller en lista över de högst rankade företagen.
Institutionell sälj/köp-kvot
Förutom att rapportera vanliga eget kapital- och skuldemissioner måste institutioner med mer än 100MM tillgångar under förvaltning också avslöja sina innehav av sälj- och köpoptioner. Eftersom säljoptioner i allmänhet indikerar ett negativt sentiment och köpoptioner indikerar ett positivt sentiment, kan vi få en uppfattning om det övergripande institutionella sentimentet genom att plotta förhållandet mellan säljoptioner och köpoptioner. Diagrammet till höger visar det historiska förhållandet mellan sälj- och köpoptioner för detta instrument.
Genom att använda sälj/köp-kvoten som en indikator på aktieägarnas sentiment undviker man en av de största bristerna med att använda det totala institutionella ägandet, nämligen att en betydande del av de förvaltade tillgångarna investeras passivt för att följa index. Passivt förvaltade fonder köper vanligtvis inte optioner, så indikatorn för sälj/köp-kvoten ger en bättre bild av stämningen i aktivt förvaltade fonder.
13F- och NPORT-arkiveringar
Detaljer om 13F-arkiveringar är gratis. Detaljer om NP-arkiveringar kräver ett premiummedlemskap. Gröna rader indikerar nya positioner. Röda rader indikerar stängda positioner. Klicka på länk symbolen för att se hela transaktionshistoriken.
Uppgradera
för att låsa upp premiumdata och exportera till Excel ![]() .
.
| Fil Datum | Källa | Investerare | Typ | Genomsnittligt pris (beräknat) |
Aktier | Δ Aktier (%) |
Rapporterat värde (1000 USD) |
Δ Värde (%) |
Portföljallokering (%) |
|
|---|---|---|---|---|---|---|---|---|---|---|
| 2025-08-13 | 13F | Mount Yale Investment Advisors, LLC | 3 939 | 138 | ||||||
| 2025-05-15 | 13F | Newbridge Financial Services Group, Inc. | 0 | −100,00 | 0 | |||||
| 2025-07-23 | 13F | Tcfg Wealth Management, Llc | 10 806 | 1,66 | 379 | 15,90 | ||||
| 2025-08-07 | 13F | Runnymede Capital Advisors, Inc. | 23 601 | 94 304,00 | 829 | |||||
| 2025-08-04 | 13F | Pensionmark Financial Group, Llc | 107 703 | −30,85 | 3 781 | −21,15 | ||||
| 2025-08-06 | 13F | Csenge Advisory Group | 8 048 | −0,57 | 277 | 16,88 | ||||
| 2025-07-25 | 13F | Hazlett, Burt & Watson, Inc. | 301 | −3,22 | 0 | |||||
| 2025-05-14 | 13F | Napa Wealth Management | 0 | −100,00 | 0 | |||||
| 2025-07-10 | 13F | Atticus Wealth Management, Llc | 2 447 | 86 | ||||||
| 2025-08-14 | 13F | Comerica Bank | 15 273 | 134,86 | 536 | 168,00 | ||||
| 2025-08-11 | 13F | Principal Securities, Inc. | 96 100 | 4 268,18 | 3 374 | 4 720,00 | ||||
| 2025-08-14 | 13F | Qube Research & Technologies Ltd | 15 447 | 606,63 | 542 | 708,96 | ||||
| 2025-07-22 | 13F | Belpointe Asset Management LLC | 35 561 | 0,43 | 1 249 | 14,50 | ||||
| 2025-08-13 | 13F | EverSource Wealth Advisors, LLC | 52 664 | 32,35 | 1 849 | 50,94 | ||||
| 2025-08-06 | 13F | ZEGA Investments, LLC | 53 971 | 1 895 | ||||||
| 2025-08-14 | 13F | Clg Llc | 87 752 | −6,39 | 3 081 | 6,72 | ||||
| 2025-08-20 | 13F/A | Coppell Advisory Solutions LLC | 31 922 | 1 111 | ||||||
| 2025-08-11 | 13F | Advisor Resource Council | 0 | −100,00 | 0 | |||||
| 2025-08-15 | 13F | Kestra Advisory Services, LLC | 580 921 | 37,05 | 20 396 | 56,28 | ||||
| 2025-07-25 | 13F | Concord Wealth Partners | 143 | 0,00 | 5 | 25,00 | ||||
| 2025-05-01 | 13F | Lane & Associates LLC | 10 651 | 51,88 | 328 | 37,97 | ||||
| 2025-07-25 | 13F | Total Clarity Wealth Management, Inc. | 8 821 | 310 | ||||||
| 2025-08-04 | 13F | Wealth Management Associates, Inc. | 7 200 | 5,88 | 253 | 20,57 | ||||
| 2025-07-10 | 13F | Focus Financial Network, Inc. | 7 621 | 268 | ||||||
| 2025-07-15 | 13F | StoneCrest Wealth Management, Inc. | 71 442 | 2 508 | ||||||
| 2025-08-13 | 13F | Baird Financial Group, Inc. | 173 538 | 13,08 | 6 093 | 28,93 | ||||
| 2025-07-18 | 13F | Consolidated Planning Corp | 99 992 | −1,75 | 3 511 | 12,03 | ||||
| 2025-08-08 | 13F | Laurel Wealth Planning LLC | 172 848 | 6,14 | 6 069 | 21,05 | ||||
| 2025-08-11 | 13F | Insight 2811, Inc. | 0 | −100,00 | 0 | |||||
| 2025-07-30 | 13F | Brookstone Capital Management | 19 679 | 691 | ||||||
| 2025-07-31 | 13F | Trademark Financial Management, LLC | 106 581 | 48,59 | 3 742 | 69,47 | ||||
| 2025-08-11 | 13F | Cornerstone Planning Group LLC | 71 | 2 | ||||||
| 2025-08-14 | 13F | Win Advisors, Inc | 0 | −100,00 | 0 | |||||
| 2025-07-25 | 13F | Muirfield Wealth Advisors Llc | 21 659 | 760 | ||||||
| 2025-08-13 | 13F | Ofc Financial Planning, Llc | 33 462 | 0,17 | 1 175 | 14,20 | ||||
| 2025-08-14 | 13F | D. E. Shaw & Co., Inc. | 16 652 | 585 | ||||||
| 2025-08-13 | 13F | StoneX Group Inc. | 182 385 | −7,83 | 6 404 | 5,11 | ||||
| 2025-08-18 | 13F | Tactive Advisors, LLC | 40 391 | 1 418 | ||||||
| 2025-07-07 | 13F | Thurston, Springer, Miller, Herd & Titak, Inc. | 1 100 | 37,50 | 39 | 58,33 | ||||
| 2025-08-12 | 13F/A | Cozad Asset Management Inc | 16 281 | 56,77 | 572 | 79,00 | ||||
| 2025-07-11 | 13F | Farther Finance Advisors, LLC | 9 081 | 319 | ||||||
| 2025-08-01 | 13F | Pasadena Private Wealth, LLC | 11 914 | 7,32 | 418 | 22,58 | ||||
| 2025-08-05 | 13F | Atlas Private Wealth Advisors | 80 461 | 15,75 | 2 825 | 32,01 | ||||
| 2025-08-14 | 13F | Mariner, LLC | 134 530 | 101,42 | 4 723 | 129,72 | ||||
| 2025-08-13 | 13F | CMC Financial Group | 337 992 | −1,02 | 11 867 | 12,87 | ||||
| 2025-08-13 | 13F | Brown Advisory Inc | 30 865 | 22,17 | 1 084 | 39,38 | ||||
| 2025-07-14 | 13F | Park Avenue Securities Llc | 50 357 | 2 | ||||||
| 2025-07-10 | 13F | Vista Investment Partners Llc | 30 241 | 7,29 | 1 062 | 22,38 | ||||
| 2025-08-14 | 13F | Mml Investors Services, Llc | 885 317 | 205,31 | 31 | 287,50 | ||||
| 2025-08-08 | 13F | Capital Investment Advisory Services, LLC | 39 572 | 6,65 | 1 389 | 21,63 | ||||
| 2025-08-14 | 13F | Susquehanna International Group, Llp | 21 888 | −76,28 | 768 | −72,97 | ||||
| 2025-08-14 | 13F | Wiley Bros.-aintree Capital, Llc | 35 235 | 91,25 | 1 237 | 117,78 | ||||
| 2025-08-13 | 13F | Fort Sheridan Advisors Llc | 16 081 | 92,93 | 565 | 120,31 | ||||
| 2025-08-05 | 13F | Sigma Planning Corp | 29 617 | −5,05 | 1 040 | 8,23 | ||||
| 2025-08-14 | 13F | Glen Eagle Advisors, LLC | 4 381 | −5,32 | 154 | 7,75 | ||||
| 2025-07-24 | 13F | IFP Advisors, Inc | 15 651 | 53,86 | 550 | 75,40 | ||||
| 2025-08-12 | 13F | Global Retirement Partners, LLC | 10 414 | 366 | ||||||
| 2025-08-06 | 13F | First Horizon Advisors, Inc. | 1 016 | 36 | ||||||
| 2025-05-14 | 13F | Walleye Capital LLC | 0 | −100,00 | 0 | |||||
| 2025-07-17 | 13F | Janney Montgomery Scott LLC | 18 863 | −34,62 | 1 | |||||
| 2025-07-03 | 13F | City Center Advisors, LLC | 6 313 | 222 | ||||||
| 2025-07-31 | 13F | Cambridge Investment Research Advisors, Inc. | 876 219 | 68,29 | 31 | 87,50 | ||||
| 2025-08-25 | 13F | Fulcrum Equity Management | 6 313 | 222 | ||||||
| 2025-08-07 | 13F | Verus Capital Partners, Llc | 153 207 | −8,23 | 5 379 | 4,65 | ||||
| 2025-08-01 | 13F | Envestnet Asset Management Inc | 1 377 238 | 321,29 | 48 355 | 380,42 | ||||
| 2025-08-12 | 13F | Proequities, Inc. | 0 | 0 | ||||||
| 2025-08-11 | 13F | Summit Wealth Partners, LLC | 11 711 | 411 | ||||||
| 2025-08-18 | 13F | Geneos Wealth Management Inc. | 19 556 | 233,55 | 687 | 281,11 | ||||
| 2025-04-21 | 13F | Trivant Custom Portfolio Group, LLC | 0 | −100,00 | 0 | |||||
| 2025-07-09 | 13F | Post Resch Tallon Group Inc. | 24 240 | 851 | ||||||
| 2025-08-04 | 13F | Arkadios Wealth Advisors | 87 332 | 33,02 | 3 066 | 51,71 | ||||
| 2025-08-19 | 13F | National Asset Management, Inc. | 0 | −100,00 | 0 | |||||
| 2025-08-14 | 13F | Diversify Advisory Services, LLC | 9 395 | 6,46 | 330 | 17,50 | ||||
| 2025-08-27 | 13F/A | Brinker Capital Investments, LLC | 447 093 | 142,80 | 15 697 | 176,89 | ||||
| 2025-08-04 | 13F | Atria Investments Llc | 46 330 | −59,53 | 1 627 | −53,86 | ||||
| 2025-08-12 | 13F | Jpmorgan Chase & Co | 460 | 7,48 | 16 | 23,08 | ||||
| 2025-08-14 | 13F/A | Rockefeller Capital Management L.P. | 120 045 | 229,23 | 4 215 | 275,58 | ||||
| 2025-08-07 | 13F | Kestra Private Wealth Services, Llc | 106 607 | 2,11 | 3 743 | 16,43 | ||||
| 2025-08-08 | 13F | Kingsview Wealth Management, LLC | 151 983 | 4,52 | 5 336 | 19,19 | ||||
| 2025-08-12 | 13F | Seeds Investor Llc | 9 106 | 320 | ||||||
| 2025-09-04 | 13F/A | Advisor Group Holdings, Inc. | 774 164 | 95,78 | 27 181 | 123,25 | ||||
| 2025-08-13 | 13F | Flow Traders U.s. Llc | 0 | −100,00 | 0 | |||||
| 2025-08-13 | 13F | Renaissance Technologies Llc | 69 100 | 2 426 | ||||||
| 2025-08-05 | 13F | Bank Of Montreal /can/ | 103 | 4 | ||||||
| 2025-07-07 | 13F | Nova Wealth Management, Inc. | 1 525 | −29,76 | 54 | −19,70 | ||||
| 2025-08-13 | 13F | Per Stirling Capital Management, LLC. | 142 072 | 33,14 | 4 988 | 51,84 | ||||
| 2025-08-13 | 13F | Level Four Advisory Services, Llc | 59 396 | 2 085 | ||||||
| 2025-08-12 | 13F | LPL Financial LLC | 3 917 855 | 49,79 | 137 556 | 70,80 | ||||
| 2025-08-08 | 13F | Thoroughbred Financial Services, Llc | 65 713 | 41,34 | 2 | 100,00 | ||||
| 2025-07-18 | 13F | Cooper Financial Group | 15 508 | −0,05 | 544 | 14,05 | ||||
| 2025-07-25 | 13F | Lion Street Advisors, LLC | 30 647 | 0,44 | 1 076 | 14,59 | ||||
| 2025-08-14 | 13F | Goldman Sachs Group Inc | 176 506 | 6 197 | ||||||
| 2025-08-12 | 13F | Steward Partners Investment Advisory, Llc | 297 350 | 3,41 | 10 440 | 17,91 | ||||
| 2025-08-15 | 13F | Equitable Holdings, Inc. | 65 820 | 62,01 | 2 311 | 94,61 | ||||
| 2025-07-01 | 13F | Private Client Services, Llc | 18 000 | 0,00 | 632 | 13,90 | ||||
| 2025-07-21 | 13F | Ameritas Advisory Services, LLC | 12 406 | −28,61 | 436 | −20,33 | ||||
| 2025-07-17 | 13F | Clay Northam Wealth Management, LLC | 6 325 | 222 | ||||||
| 2025-07-11 | 13F | SILVER OAK SECURITIES, Inc | 6 618 | 232 | ||||||
| 2025-08-08 | 13F | Emerald Investment Partners, Llc | 253 | 9 | ||||||
| 2025-08-13 | 13F | GeoWealth Management, LLC | 75 531 | 2 652 | ||||||
| 2025-07-31 | 13F | Glass Jacobson Investment Advisors llc | 25 | 1 | ||||||
| 2025-07-22 | 13F | DAVENPORT & Co LLC | 27 452 | 33,69 | 964 | 52,37 | ||||
| 2025-08-14 | 13F | GWM Advisors LLC | 173 159 | 517,39 | 6 080 | 604,40 | ||||
| 2025-07-10 | 13F | Wealth Enhancement Advisory Services, Llc | 426 460 | −1,96 | 15 118 | 12,89 | ||||
| 2025-08-12 | 13F | Atlantic Family Wealth, Llc | 43 933 | 137,71 | 1 542 | 171,00 | ||||
| 2025-07-22 | 13F | Comprehensive Financial Consultants Institutional, Inc. | 7 888 | 1,77 | 277 | 15,97 | ||||
| 2025-08-11 | 13F | HHM Wealth Advisors, LLC | 531 | 11,79 | 19 | 28,57 | ||||
| 2025-08-14 | 13F | Fmr Llc | 606 | 0,00 | 21 | 16,67 | ||||
| 2025-08-06 | 13F | Ethos Financial Group, LLC | 225 303 | 7 910 | ||||||
| 2025-08-14 | 13F | Bank Of America Corp /de/ | 6 335 858 | 67,16 | 222 452 | 90,61 | ||||
| 2025-08-15 | 13F | Morgan Stanley | 2 201 632 | 67 310,66 | 77 299 | 77 199,00 | ||||
| 2025-07-09 | 13F | GSG Advisors LLC | 5 933 | 208 | ||||||
| 2025-07-28 | 13F | Harbour Investments, Inc. | 340 758 | 36,07 | 11 964 | 55,16 | ||||
| 2025-07-07 | 13F | Teamwork Financial Advisors, LLC | 568 102 | 19 946 | ||||||
| 2025-08-07 | 13F | PFG Advisors | 21 140 | −2,94 | 742 | 10,75 | ||||
| 2025-08-11 | 13F | Nations Financial Group Inc, /ia/ /adv | 23 868 | 43,30 | 838 | 63,67 | ||||
| 2025-07-29 | 13F | Stratos Wealth Partners, LTD. | 58 138 | 243,34 | 2 041 | 291,75 | ||||
| 2025-08-11 | 13F/A | Purus Wealth Management, LLC | 13 560 | 476 | ||||||
| 2025-07-28 | 13F | Copia Wealth Management | 35 762 | 32,75 | 1 256 | 51,39 | ||||
| 2025-08-05 | 13F | Optivise Advisory Services LLC | 35 579 | 1 249 | ||||||
| 2025-08-12 | 13F | Cornerstone Wealth Management, LLC | 225 864 | 9,80 | 7 930 | 25,22 | ||||
| 2025-08-14 | 13F | Cascades Capital Asset Management, LLC | 0 | −100,00 | 0 | |||||
| 2025-08-08 | 13F | Avantax Advisory Services, Inc. | 169 800 | 23,99 | 5 962 | 41,39 | ||||
| 2025-08-13 | 13F | Capital Analysts, Inc. | 6 865 | 76,43 | 0 | |||||
| 2025-08-14 | 13F | Clark Capital Management Group, Inc. | 435 467 | 15 289 | ||||||
| 2025-08-14 | 13F | Wells Fargo & Company/mn | 2 092 759 | 68,24 | 73 477 | 91,85 | ||||
| 2025-08-07 | 13F | Nwam Llc | 5 913 | 208 | ||||||
| 2025-08-11 | 13F | One Capital Management, LLC | 72 687 | −40,46 | 2 552 | −32,09 | ||||
| 2025-08-14 | 13F | Fwl Investment Management, Llc | 357 | 13 | ||||||
| 2025-04-30 | 13F | Stratos Wealth Advisors, LLC | 0 | −100,00 | 0 | |||||
| 2025-08-06 | 13F | Rps Advisory Solutions Llc | 29 819 | 34,25 | 1 047 | 53,15 | ||||
| 2025-08-14 | 13F | Royal Bank Of Canada | 314 004 | 11,74 | 11 024 | 27,42 | ||||
| 2025-07-14 | 13F | Iams Wealth Management, Llc | 6 701 | 235 | ||||||
| 2025-07-23 | 13F | Kingswood Wealth Advisors, Llc | 6 605 | 232 | ||||||
| 2025-08-06 | 13F | Commonwealth Equity Services, Llc | 678 031 | 84,45 | 24 | 109,09 | ||||
| 2025-08-27 | NP | XNAV - FundX Aggressive ETF | 34 028 | 9,77 | 1 195 | 25,16 | ||||
| 2025-07-30 | 13F | D.a. Davidson & Co. | 10 667 | 375 | ||||||
| 2025-08-06 | 13F | Capasso Planning Partners LLC | 17 466 | −48,70 | 613 | −41,51 | ||||
| 2025-07-22 | 13F | IVC Wealth Advisors LLC | 8 600 | 22,86 | 302 | 40,00 | ||||
| 2025-04-08 | 13F | Lowe Wealth Advisors, LLC | 0 | −100,00 | 0 | |||||
| 2025-08-18 | 13F | Front Row Advisors LLC | 900 | 32 | ||||||
| 2025-08-04 | 13F | Creative Financial Designs Inc /adv | 29 152 | 3,13 | 1 024 | 17,59 | ||||
| 2025-07-29 | 13F | Private Trust Co Na | 8 049 | 5,02 | 283 | 20,00 | ||||
| 2025-07-10 | 13F | Sovran Advisors, LLC | 21 741 | −62,74 | 765 | −55,32 | ||||
| 2025-08-13 | 13F | Empire Financial Management Company, LLC | 33 111 | −6,70 | 1 163 | 6,41 | ||||
| 2025-08-04 | 13F | Bay Colony Advisory Group, Inc d/b/a Bay Colony Advisors | 42 876 | 15,10 | 1 505 | 30,98 | ||||
| 2025-07-14 | 13F | Lighthouse Wealth Management Inc. | 29 652 | 203,75 | 1 041 | 247,00 | ||||
| 2025-07-15 | 13F | Aspire Capital Advisors LLC | 430 271 | 3,62 | 15 107 | 18,16 | ||||
| 2025-05-15 | 13F/A | Orion Portfolio Solutions, LLC | 184 138 | 500,64 | 5 670 | 477,29 | ||||
| 2025-08-12 | 13F | Long Island Wealth Management, Inc. | 38 499 | −2,88 | 1 352 | 10,74 | ||||
| 2025-08-14 | 13F | Jane Street Group, Llc | 39 576 | −61,26 | 1 390 | −55,83 | ||||
| 2025-07-24 | 13F | Bey-Douglas LLC | 22 373 | 15,09 | 786 | 31,27 | ||||
| 2025-07-28 | 13F | Axxcess Wealth Management, Llc | 0 | −100,00 | 0 | |||||
| 2025-08-18 | 13F | Tyler-Stone Wealth Management | 8 274 | 0,29 | 291 | 14,17 | ||||
| 2025-08-14 | 13F | White Knight Strategic Wealth Advisors, LLC | 7 710 | 271 | ||||||
| 2025-08-14 | 13F | Benjamin Edwards Inc | 34 250 | 4,58 | 1 203 | 19,25 | ||||
| 2025-08-14 | 13F | Arete Wealth Advisors, LLC | 11 387 | 18,95 | 0 | |||||
| 2025-07-08 | 13F | GK Wealth Management LLC | 11 610 | 27,40 | 408 | 45,36 | ||||
| 2025-08-12 | 13F | Calton & Associates, Inc. | 18 970 | 666 | ||||||
| 2025-07-18 | 13F | PFG Investments, LLC | 21 966 | 771 | ||||||
| 2025-07-07 | 13F | Centurion Wealth Management LLC | 68 743 | 4,93 | 2 414 | 14,96 | ||||
| 2025-07-18 | 13F | Truist Financial Corp | 607 398 | 63,92 | 21 326 | 86,91 | ||||
| 2025-07-25 | 13F | Envestnet Portfolio Solutions, Inc. | 0 | −100,00 | 0 | |||||
| 2025-07-14 | 13F | Cathy Pareto & Associates, Inc | 12 044 | 2,97 | 423 | 17,22 | ||||
| 2025-08-08 | 13F | Cetera Investment Advisers | 734 509 | 109,87 | 25 789 | 139,33 | ||||
| 2025-08-14 | 13F | CoreCap Advisors, LLC | 1 029 | 78,34 | 36 | 111,76 | ||||
| 2025-07-23 | 13F | Clear Creek Financial Management, LLC | 8 105 | 285 | ||||||
| 2025-07-15 | 13F | Armis Advisers, LLC | 5 868 | 206 | ||||||
| 2025-08-11 | 13F | Wbi Investments, Inc. | 21 957 | 3,65 | 771 | 18,10 | ||||
| 2025-07-17 | 13F | XML Financial, LLC | 34 709 | 90,46 | 1 219 | 117,11 | ||||
| 2025-08-13 | 13F | JBR Co Financial Management Inc | 59 938 | 45,27 | 2 104 | 65,67 | ||||
| 2025-08-12 | 13F | PSI Advisors, LLC | 0 | −100,00 | 0 | |||||
| 2025-08-01 | 13F | Delta Investment Management, LLC | 560 871 | 223,26 | 19 692 | 268,63 | ||||
| 2025-07-25 | 13F | Atria Wealth Solutions, Inc. | 49 541 | −48,52 | 1 740 | −41,26 | ||||
| 2025-07-16 | 13F | Sylvest Advisors, LLC | 302 796 | 13,81 | 10 631 | 29,79 | ||||
| 2025-07-31 | 13F | Perissos Private Wealth Management, LLC | 0 | −100,00 | 0 | |||||
| 2025-08-14 | 13F | Stifel Financial Corp | 111 980 | 18,09 | 3 932 | 34,67 | ||||
| 2025-08-14 | 13F | Warren Averett Asset Management, LLC | 13 885 | 488 | ||||||
| 2025-08-15 | 13F | First Heartland Consultants, Inc. | 37 707 | 1 324 | ||||||
| 2025-07-28 | 13F | Compass Advisory Group LLC | 26 510 | −9,23 | 931 | 3,45 | ||||
| 2025-08-06 | 13F | AE Wealth Management LLC | 7 228 | 153,08 | 254 | 190,80 | ||||
| 2025-08-11 | 13F | HighTower Advisors, LLC | 391 098 | 25,44 | 13 731 | 43,03 | ||||
| 2025-08-15 | 13F | Tower Research Capital LLC (TRC) | 0 | −100,00 | 0 | |||||
| 2025-07-21 | 13F | Yeomans Consulting Group, Inc. | 345 853 | −3,57 | 12 081 | 9,39 | ||||
| 2025-07-31 | 13F | B & T Capital Management DBA Alpha Capital Management | 19 558 | 69,77 | 687 | 93,79 | ||||
| 2025-08-14 | 13F | Raymond James Financial Inc | 1 981 634 | 21,35 | 69 575 | 38,38 | ||||
| 2025-08-11 | 13F | Private Advisor Group, LLC | 37 036 | 18,98 | 1 300 | 35,70 | ||||
| 2025-08-12 | 13F | SRS Capital Advisors, Inc. | 162 | 0,00 | 6 | 25,00 | ||||
| 2025-07-25 | 13F | Ellis Investment Partners, LLC | 24 595 | 6,74 | 864 | 21,72 | ||||
| 2025-08-14 | 13F | Ausdal Financial Partners, Inc. | 0 | −100,00 | 0 | |||||
| 2025-07-22 | 13F | Team Financial Group, LLC | 207 678 | 12,55 | 7 292 | 28,34 | ||||
| 2025-08-14 | 13F | Vienna Asset Management LLC | 0 | −100,00 | 0 | |||||
| 2025-07-21 | 13F | Patriot Financial Group Insurance Agency, LLC | 99 827 | 3 505 | ||||||
| 2025-08-06 | 13F | Prospera Financial Services Inc | 22 021 | 33,36 | 773 | 52,17 | ||||
| 2025-08-14 | 13F | UBS Group AG | 22 894 | 592,92 | 804 | 695,05 | ||||
| 2025-07-16 | 13F | Perigon Wealth Management, LLC | 5 900 | 207 | ||||||
| 2025-08-12 | 13F | Financial Advocates Investment Management | 60 117 | 5,20 | 2 111 | 19,95 | ||||
| 2025-08-13 | 13F | Plan Group Financial, LLC | 122 156 | 33,68 | 4 289 | 52,44 | ||||
| 2025-08-13 | 13F | Northwestern Mutual Wealth Management Co | 687 409 | 117,29 | 24 135 | 147,78 | ||||
| 2025-08-11 | 13F | Western Wealth Management, LLC | 39 285 | 57,60 | 1 379 | 79,79 | ||||
| 2025-08-04 | 13F | Assetmark, Inc | 299 | 10 | ||||||
| 2025-07-11 | 13F | Pinnacle Bancorp, Inc. | 275 | 35,47 | 10 | 50,00 | ||||
| 2025-08-05 | 13F | Lifeworks Advisors, LLC | 47 351 | 1,44 | 1 662 | 15,66 | ||||
| 2025-07-15 | 13F | RVW Wealth, LLC | 80 040 | 2 810 | ||||||
| 2025-08-08 | 13F | Schwarz Dygos Wheeler Investment Advisors Llc | 19 650 | 4,52 | 690 | 19,20 | ||||
| 2025-07-31 | 13F | Nilsine Partners, LLC | 140 787 | 3,85 | 4 943 | 18,45 | ||||
| 2025-08-01 | 13F | Schmidt P J Investment Management Inc | 21 786 | 22,67 | 765 | 39,93 | ||||
| 2025-08-12 | 13F | J.w. Cole Advisors, Inc. | 27 515 | 19,14 | 966 | 35,86 | ||||
| 2025-07-23 | 13F | Traphagen Investment Advisors Llc | 1 943 554 | 26,48 | 68 238 | 44,22 | ||||
| 2025-08-14 | 13F | Citadel Advisors Llc | 16 467 | −58,18 | 578 | −52,31 | ||||
| 2025-07-28 | 13F | WJ Wealth Management, LLC | 169 320 | −22,65 | 5 945 | −11,80 | ||||
| 2025-08-04 | 13F | Flagship Harbor Advisors, Llc | 123 208 | 2,20 | 4 326 | 16,55 | ||||
| 2025-07-02 | 13F | HBW Advisory Services LLC | 76 432 | 674,62 | 2 684 | 785,48 | ||||
| 2025-08-19 | 13F | Advisory Services Network, LLC | 151 691 | 8,53 | 5 292 | 22,98 | ||||
| 2025-08-13 | 13F | Jones Financial Companies Lllp | 1 288 461 | 41,60 | 44 851 | 59,67 | ||||
| 2025-07-03 | 13F | TrueWealth Advisors, LLC | 33 431 | 29,77 | 1 174 | 47,92 | ||||
| 2025-08-13 | 13F | Smith, Moore & Co. | 194 977 | 1 387,81 | 6 846 | 1 598,51 | ||||
| 2025-08-14 | 13F | Tripletail Wealth Management, LLC | 36 870 | 1 288 | ||||||
| 2025-07-31 | 13F | Stegent Equity Advisors, Inc. | 18 705 | 2,02 | 657 | 16,31 | ||||
| 2025-08-07 | 13F | Allworth Financial LP | 492 | 143,56 | 17 | 183,33 | ||||
| 2025-07-23 | 13F | Heck Capital Advisors, LLC | 372 699 | 13 085 |