Grundläggande statistik
| Institutionella ägare | 187 total, 187 long only, 0 short only, 0 long/short - change of 11,98% MRQ |
| Genomsnittlig portföljallokering | 0.5930 % - change of −13,91% MRQ |
| Institutionella aktier (lång) | 89 947 598 (ex 13D/G) - change of 16,11MM shares 21,81% MRQ |
| Institutionellt värde (lång) | $ 2 273 915 USD ($1000) |
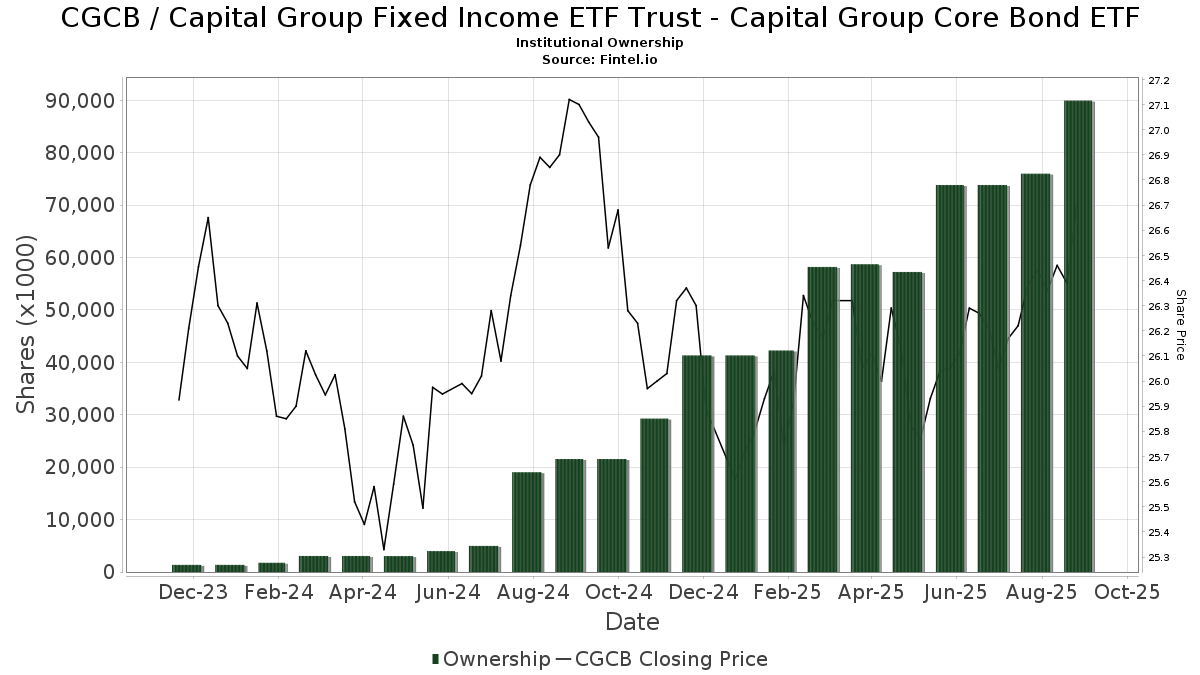
Institutionellt ägande och aktieägare
Capital Group Fixed Income ETF Trust - Capital Group Core Bond ETF (US:CGCB) har 187 Institutionella ägare och aktieägare som har lämnat in 13D/G- eller 13F-formulär till Securities Exchange Commission (SEC). Dessa institut innehar totalt 89,947,598 aktier. Största aktieägare inkluderar LPL Financial LLC, Advance Capital Management, Inc., Capital International Investors, CGBL - Capital Group Core Balanced ETF Share Class, Morgan Stanley, Envestnet Asset Management Inc, Northwestern Mutual Wealth Management Co, Raymond James Financial Inc, Cetera Investment Advisers, and Advisor Group Holdings, Inc. .
Capital Group Fixed Income ETF Trust - Capital Group Core Bond ETF (ARCA:CGCB) Institutionell ägarstruktur visar institutioners och fonders nuvarande positioner i företaget, samt de senaste förändringarna i positionernas storlek. Större aktieägare kan vara enskilda investerare, fonder, hedgefonder eller institutioner. Bilaga 13D visar att investeraren äger (eller ägde) mer än 5% av företaget och avser (eller avsåg) att aktivt eftersträva en förändring av affärsstrategin. Schedule 13G indikerar en passiv investering på över 5%.
The share price as of September 10, 2025 is 26,70 / share. Previously, on September 11, 2024, the share price was 27,12 / share. This represents a decline of 1,55% over that period.
Fondsentimentets poäng
Fondsentimentet poängen(fka Ägarackumulation-poäng) visar vilka aktier som är mest köpta av fonder. Det är resultatet av en sofistikerad kvantitativ flerfaktormodell som identifierar företag med de högsta nivåerna av institutionell ackumulering. Poängsättningsmodellen använder en kombination av den totala ökningen av redovisade ägare, förändringarna i portföljallokeringarna för dessa ägare och andra mått. Siffran sträcker sig från 0 till 100, där högre siffror indikerar en högre nivå av ackumulering i förhållande till sina konkurrenter, och 50 är genomsnittet.
Uppdateringsfrekvens: Dagligen
Se Ownership Explorer, som innehåller en lista över de högst rankade företagen.
Institutionell sälj/köp-kvot
Förutom att rapportera vanliga eget kapital- och skuldemissioner måste institutioner med mer än 100MM tillgångar under förvaltning också avslöja sina innehav av sälj- och köpoptioner. Eftersom säljoptioner i allmänhet indikerar ett negativt sentiment och köpoptioner indikerar ett positivt sentiment, kan vi få en uppfattning om det övergripande institutionella sentimentet genom att plotta förhållandet mellan säljoptioner och köpoptioner. Diagrammet till höger visar det historiska förhållandet mellan sälj- och köpoptioner för detta instrument.
Genom att använda sälj/köp-kvoten som en indikator på aktieägarnas sentiment undviker man en av de största bristerna med att använda det totala institutionella ägandet, nämligen att en betydande del av de förvaltade tillgångarna investeras passivt för att följa index. Passivt förvaltade fonder köper vanligtvis inte optioner, så indikatorn för sälj/köp-kvoten ger en bättre bild av stämningen i aktivt förvaltade fonder.
13F- och NPORT-arkiveringar
Detaljer om 13F-arkiveringar är gratis. Detaljer om NP-arkiveringar kräver ett premiummedlemskap. Gröna rader indikerar nya positioner. Röda rader indikerar stängda positioner. Klicka på länk symbolen för att se hela transaktionshistoriken.
Uppgradera
för att låsa upp premiumdata och exportera till Excel ![]() .
.
| Fil Datum | Källa | Investerare | Typ | Genomsnittligt pris (beräknat) |
Aktier | Δ Aktier (%) |
Rapporterat värde (1000 USD) |
Δ Värde (%) |
Portföljallokering (%) |
|
|---|---|---|---|---|---|---|---|---|---|---|
| 2025-08-12 | 13F | Rather & Kittrell, Inc. | 9 455 | 0,00 | 249 | 0,00 | ||||
| 2025-08-14 | 13F | UBS Group AG | 137 621 | 13,40 | 3 619 | 13,48 | ||||
| 2025-07-23 | 13F | Cannon Wealth Management Services, LLC | 215 420 | 2,95 | 5 666 | 3,62 | ||||
| 2025-07-29 | 13F | Signature Estate & Investment Advisors Llc | 158 200 | −5,75 | 4 161 | −5,69 | ||||
| 2025-08-12 | 13F | XTX Topco Ltd | 7 724 | 203 | ||||||
| 2025-08-11 | 13F | Private Advisor Group, LLC | 406 758 | −7,54 | 10 698 | −7,47 | ||||
| 2025-07-25 | 13F | Envestnet Portfolio Solutions, Inc. | 97 364 | −22,99 | 2 561 | −22,94 | ||||
| 2025-08-11 | 13F | Principal Securities, Inc. | 1 264 | 33 | ||||||
| 2025-08-12 | 13F | Lodestone Wealth Management LLC | 87 073 | −0,49 | 2 290 | −0,39 | ||||
| 2025-08-12 | 13F | Jpmorgan Chase & Co | 197 988 | 3,00 | 5 207 | 3,09 | ||||
| 2025-05-02 | 13F | Capital A Wealth Management, LLC | 885 | −6,84 | 23 | −4,17 | ||||
| 2025-07-28 | 13F | Holistic Planning, LLC | 42 325 | 80,43 | 1 113 | 80,68 | ||||
| 2025-08-12 | 13F | Summit Global Investments | 8 273 | 0 | ||||||
| 2025-07-22 | 13F | Merit Financial Group, LLC | 115 220 | 135,22 | 3 030 | 135,43 | ||||
| 2025-07-29 | 13F | Balboa Wealth Partners | 10 047 | 264 | ||||||
| 2025-08-11 | 13F | Perennial Investment Advisors, LLC | 20 855 | 12,41 | 548 | 12,53 | ||||
| 2025-07-28 | 13F | Sagespring Wealth Partners, Llc | 11 161 | 17,73 | 294 | 17,67 | ||||
| 2025-08-14 | 13F | GWM Advisors LLC | 170 961 | 31,27 | 4 496 | 31,39 | ||||
| 2025-08-14 | 13F | Wiley Bros.-aintree Capital, Llc | 282 268 | 40,25 | 7 441 | 40,38 | ||||
| 2025-08-12 | 13F | AlphaCore Capital LLC | 19 558 | 0,05 | 514 | 0,19 | ||||
| 2025-08-14 | 13F | Royal Bank Of Canada | 1 287 571 | 6,84 | 33 863 | 6,92 | ||||
| 2025-07-25 | 13F | Cwm, Llc | 4 417 | 30,45 | 0 | |||||
| 2025-08-08 | 13F | Kingsview Wealth Management, LLC | 235 612 | 22,85 | 6 197 | 22,94 | ||||
| 2025-08-14 | 13F | Full Sail Capital, LLC | 0 | −100,00 | 0 | |||||
| 2025-08-06 | 13F | Golden State Wealth Management, LLC | 0 | −100,00 | 0 | −100,00 | ||||
| 2025-08-08 | 13F | CWS Financial Advisors, LLC | 30 204 | 8,02 | 794 | 8,17 | ||||
| 2025-07-24 | 13F | Cyndeo Wealth Partners, LLC | 14 094 | 0,37 | 371 | 0,27 | ||||
| 2025-07-25 | 13F | Atria Wealth Solutions, Inc. | 251 920 | −16,03 | 6 626 | −16,25 | ||||
| 2025-08-04 | 13F | Bay Colony Advisory Group, Inc d/b/a Bay Colony Advisors | 16 488 | −21,87 | 434 | −21,70 | ||||
| 2025-08-11 | 13F | Aptus Capital Advisors, LLC | 2 000 | 0,00 | 53 | 0,00 | ||||
| 2025-07-17 | 13F | Leverty Financial Group, LLC | 1 427 371 | 5,17 | 37 538 | 5,25 | ||||
| 2025-08-14 | 13F | Benjamin Edwards Inc | 76 292 | 24,30 | 2 006 | 24,36 | ||||
| 2025-08-14 | 13F | Great Valley Advisor Group, Inc. | 76 923 | 11,90 | 2 023 | 12,02 | ||||
| 2025-07-02 | 13F | Dentgroup LLC | 214 207 | 8,07 | 5 634 | 8,14 | ||||
| 2025-08-13 | 13F | Baird Financial Group, Inc. | 75 595 | −0,12 | 1 988 | −0,05 | ||||
| 2025-08-14 | 13F | IHT Wealth Management, LLC | 8 707 | 229 | ||||||
| 2025-08-11 | 13F | United Advisor Group, LLC | 85 895 | 22,20 | 2 259 | 22,31 | ||||
| 2025-08-12 | 13F | Global Retirement Partners, LLC | 82 963 | 1 031,52 | 2 182 | 1 053,97 | ||||
| 2025-08-04 | 13F | Saxony Capital Management, LLC | 72 711 | 2,25 | 1 912 | 2,36 | ||||
| 2025-08-05 | 13F | Hunter Associates Investment Management Llc | 8 730 | 0 | ||||||
| 2025-07-08 | 13F | Advance Capital Management, Inc. | 11 517 435 | 6,86 | 302 909 | 6,94 | ||||
| 2025-07-29 | 13F | Madison Wealth Partners, Inc | 10 971 | 289 | ||||||
| 2025-08-12 | 13F | Steward Partners Investment Advisory, Llc | 8 915 | 422,87 | 234 | 431,82 | ||||
| 2025-07-21 | 13F | Capital Planning LLC | 0 | −100,00 | 0 | |||||
| 2025-07-24 | 13F | IFP Advisors, Inc | 186 | 2,76 | 5 | 0,00 | ||||
| 2025-08-11 | 13F | Western Wealth Management, LLC | 107 262 | 4,28 | 2 821 | 4,33 | ||||
| 2025-08-12 | 13F | Titleist Asset Management, Llc | 9 000 | 237 | ||||||
| 2025-07-24 | 13F | MSH Capital Advisors LLC | 17 947 | 24,48 | 472 | 24,87 | ||||
| 2025-08-12 | 13F | Marshall & Sterling Wealth Advisors Inc. | 2 466 | 18,79 | 65 | 18,52 | ||||
| 2025-08-14 | 13F | Raymond James Financial Inc | 2 153 628 | 35,49 | 56 640 | 35,59 | ||||
| 2025-04-30 | 13F | Allworth Financial LP | 0 | −100,00 | 0 | |||||
| 2025-08-05 | 13F | Mission Wealth Management, Lp | 64 183 | 2,15 | 1 688 | 2,24 | ||||
| 2025-08-14 | 13F | Jane Street Group, Llc | 639 046 | 82,74 | 16 807 | 82,89 | ||||
| 2025-08-13 | 13F | Congress Wealth Management LLC / DE / | 70 156 | 5,59 | 1 845 | 5,85 | ||||
| 2025-08-12 | 13F | J.w. Cole Advisors, Inc. | 8 157 | 0,65 | 215 | 0,94 | ||||
| 2025-07-10 | 13F | Wealth Enhancement Advisory Services, Llc | 356 869 | −4,31 | 9 343 | −4,68 | ||||
| 2025-08-12 | 13F | Wood Tarver Financial Group, LLC | 67 610 | 23,39 | 2 | −99,93 | ||||
| 2025-05-08 | 13F | HHM Wealth Advisors, LLC | 0 | −100,00 | 0 | |||||
| 2025-07-18 | 13F | Trilogy Capital Inc. | 12 060 | 0,00 | 317 | 0,32 | ||||
| 2025-08-08 | 13F | Cetera Investment Advisers | 1 549 123 | 36,76 | 40 742 | 36,87 | ||||
| 2025-08-14 | 13F | Citadel Advisors Llc | 0 | −100,00 | 0 | |||||
| 2025-07-16 | 13F | Freestate Advisors LLC | 12 913 | 340 | ||||||
| 2025-08-13 | 13F | Continuum Advisory, LLC | 742 923 | 11,84 | 19 539 | 11,93 | ||||
| 2025-07-24 | 13F | Drucker Wealth 3.0, LLC | 0 | −100,00 | 0 | |||||
| 2025-07-22 | 13F | Berger Financial Group, Inc | 71 444 | 14,66 | 1 879 | 14,72 | ||||
| 2025-08-12 | 13F | SRS Capital Advisors, Inc. | 392 | 10 | ||||||
| 2025-08-15 | 13F | Captrust Financial Advisors | 658 661 | 77,47 | 17 323 | 77,61 | ||||
| 2025-08-13 | 13F | Flow Traders U.s. Llc | 0 | −100,00 | 0 | |||||
| 2025-07-25 | 13F | Bill Few Associates, Inc. | 47 071 | 0,91 | 1 238 | 0,98 | ||||
| 2025-08-14 | 13F | Old Mission Capital Llc | 8 647 | −64,84 | 227 | −64,86 | ||||
| 2025-07-21 | 13F | Ameritas Advisory Services, LLC | 12 516 | 32,25 | 329 | 32,66 | ||||
| 2025-08-06 | 13F | Prospera Financial Services Inc | 30 329 | 40,87 | 798 | 41,06 | ||||
| 2025-07-30 | 13F | Smith Thornton Advisors LLC | 192 687 | −0,01 | 5 068 | 0,06 | ||||
| 2025-08-04 | 13F | Kovack Advisors, Inc. | 0 | −100,00 | 0 | |||||
| 2025-07-11 | 13F | Farther Finance Advisors, LLC | 308 | 8 | ||||||
| 2025-08-05 | 13F | Aurdan Capital Management, LLC | 30 786 | 0,06 | 810 | 0,12 | ||||
| 2025-08-14 | 13F | Sei Investments Co | 505 722 | 1 552,31 | 13 300 | 1 554,23 | ||||
| 2025-08-18 | 13F | Geneos Wealth Management Inc. | 376 695 | 173,42 | 9 907 | 173,67 | ||||
| 2025-08-13 | 13F | Capital Group Private Client Services, Inc. | 18 827 | 20,58 | 495 | 20,73 | ||||
| 2025-08-15 | 13F | Equitable Holdings, Inc. | 128 855 | 41,88 | 3 389 | 41,99 | ||||
| 2025-08-13 | 13F | Capital Analysts, Inc. | 9 813 | 139,11 | 0 | |||||
| 2025-08-14 | 13F | Wells Fargo & Company/mn | 326 252 | 217 401,33 | 8 580 | 285 900,00 | ||||
| 2025-08-04 | 13F | Creekmur Asset Management LLC | 344 870 | 9 070 | ||||||
| 2025-07-30 | 13F | Strategic Blueprint, LLC | 210 070 | 19,89 | 5 525 | 19,98 | ||||
| 2025-07-09 | 13F | Pines Wealth Management, LLC | 37 032 | 18,82 | 969 | 19,48 | ||||
| 2025-07-17 | 13F | Janney Montgomery Scott LLC | 30 315 | 73,99 | 1 | |||||
| 2025-08-08 | 13F | Meridian Wealth Management, LLC | 56 897 | −3,21 | 1 496 | −3,11 | ||||
| 2025-08-14 | 13F | Integrated Wealth Concepts LLC | 46 793 | 32,03 | 1 231 | 32,12 | ||||
| 2025-08-12 | 13F | LPL Financial LLC | 12 296 282 | 31,09 | 323 392 | 31,19 | ||||
| 2025-07-31 | 13F | Cambridge Investment Research Advisors, Inc. | 1 192 570 | 7,88 | 31 | 6,90 | ||||
| 2025-07-18 | 13F | Panoramic Capital Partners, LLC | 586 898 | 15 365 | ||||||
| 2025-08-04 | 13F | IFG Advisory, LLC | 43 320 | 91,23 | 1 139 | 91,43 | ||||
| 2025-07-29 | 13F | Werba Rubin Papier Wealth Management | 9 243 | 243 | ||||||
| 2025-07-25 | 13F | Concurrent Investment Advisors, LLC | 130 444 | 2,18 | 3 431 | 2,27 | ||||
| 2025-08-14 | 13F | Freedom Financial Partners LLC | 232 886 | 1,76 | 6 125 | 1,83 | ||||
| 2025-07-14 | 13F | U.S. Capital Wealth Advisors, LLC | 40 497 | 13,51 | 1 065 | 13,66 | ||||
| 2025-08-12 | 13F | Proequities, Inc. | 0 | 0 | ||||||
| 2025-07-21 | 13F | Barrett & Company, Inc. | 3 050 | 0,00 | 80 | 0,00 | ||||
| 2025-08-14 | 13F | Ancora Advisors, LLC | 121 231 | −8,88 | 3 188 | −8,81 | ||||
| 2025-07-10 | 13F | American Financial Advisors, LLC | 878 099 | −2,90 | 23 094 | −2,83 | ||||
| 2025-05-09 | 13F | Delta Financial Group, Inc. | 33 195 | −3,92 | 1 | |||||
| 2025-07-30 | 13F | Financial Perspectives, Inc | 6 004 | 17,73 | 158 | 17,16 | ||||
| 2025-07-16 | 13F | ORG Partners LLC | 6 819 | 19 955,88 | 179 | |||||
| 2025-07-29 | 13F | Stephens Inc /ar/ | 584 325 | 7,84 | 15 368 | 7,92 | ||||
| 2025-07-16 | 13F | Spinnaker Investment Group, LLC | 773 624 | 10,78 | 20 346 | 10,87 | ||||
| 2025-08-14 | 13F/A | Rockefeller Capital Management L.P. | 189 609 | −1,36 | 4 987 | −1,29 | ||||
| 2025-07-17 | 13F | Venture Visionary Partners LLC | 11 434 | 301 | ||||||
| 2025-07-11 | 13F | AA Financial Advisors, LLC | 24 616 | 647 | ||||||
| 2025-07-29 | 13F | Morgan Dempsey Capital Management Llc | 5 622 | 15,80 | 148 | 15,75 | ||||
| 2025-07-30 | 13F | Cullen/frost Bankers, Inc. | 89 177 | 36,33 | 2 345 | 36,42 | ||||
| 2025-09-04 | 13F/A | Advisor Group Holdings, Inc. | 1 504 689 | −0,82 | 39 578 | −0,74 | ||||
| 2025-05-15 | 13F | Smith, Moore & Co. | 0 | −100,00 | 0 | |||||
| 2025-08-12 | 13F | Richmond Investment Services, LLC | 24 508 | 645 | ||||||
| 2025-08-15 | 13F | Kestra Advisory Services, LLC | 338 811 | 14,93 | 8 911 | 15,01 | ||||
| 2025-07-09 | 13F | Sunpointe, LLC | 13 764 | 362 | ||||||
| 2025-08-13 | 13F | M Holdings Securities, Inc. | 24 124 | 1 | ||||||
| 2025-07-28 | 13F | Eq Wealth Advisors, Llc | 11 138 | 18,44 | 293 | 18,22 | ||||
| 2025-08-13 | 13F | Townsquare Capital Llc | 0 | −100,00 | 0 | |||||
| 2025-08-13 | 13F | Colonial Trust Co / SC | 2 375 | 39,71 | 62 | 40,91 | ||||
| 2025-07-11 | 13F | LongView Wealth Management | 53 120 | 30,10 | 1 397 | 30,32 | ||||
| 2025-07-17 | 13F | Johnson Bixby & Associates, LLC | 8 272 | 0,00 | 218 | 0,00 | ||||
| 2025-08-25 | 13F | Silverlake Wealth Management Llc | 7 909 | 208 | ||||||
| 2025-08-14 | 13F | Evergreen Wealth Solutions, LLC | 73 025 | 61,97 | 1 921 | 62,16 | ||||
| 2025-08-15 | 13F | Lantern Wealth Advisors, LLC | 8 679 | 228 | ||||||
| 2025-08-11 | 13F | Rothschild Investment Llc | 99 188 | 26,58 | 2 609 | 26,66 | ||||
| 2025-07-15 | 13F | Hartmann Taylor Wealth Management, LLC | 12 546 | 58,55 | 330 | 58,94 | ||||
| 2025-07-21 | 13F | Ameriflex Group, Inc. | 340 | 0,29 | 9 | 0,00 | ||||
| 2025-07-09 | 13F | Dynamic Advisor Solutions LLC | 195 948 | 13,63 | 5 153 | 13,73 | ||||
| 2025-08-06 | 13F | Cannon Financial Strategists, Inc. | 464 593 | 0,96 | 12 219 | 1,04 | ||||
| 2025-07-17 | 13F | Tempus Wealth Planning, LLC | 26 583 | 2,91 | 699 | 3,10 | ||||
| 2025-08-11 | 13F | Synergy Investment Management, LLC | 0 | −100,00 | 0 | |||||
| 2025-07-25 | 13F | Apollon Wealth Management, LLC | 28 298 | 744 | ||||||
| 2025-08-07 | 13F | Kestra Private Wealth Services, Llc | 9 731 | 256 | ||||||
| 2025-07-15 | 13F | Regatta Capital Group, Llc | 718 467 | 1,76 | 18 896 | 1,83 | ||||
| 2025-08-14 | 13F | Guardian Wealth Advisors, Llc / Nc | 2 000 | 0,00 | 53 | 0,00 | ||||
| 2025-07-14 | 13F | Armstrong Advisory Group, Inc | 0 | −100,00 | 0 | |||||
| 2025-07-23 | 13F | Valmark Advisers, Inc. | 876 546 | 2,36 | 23 053 | 2,44 | ||||
| 2025-08-11 | 13F | HighTower Advisors, LLC | 37 981 | 999 | ||||||
| 2025-08-07 | 13F | PFG Advisors | 12 967 | −7,92 | 341 | −7,84 | ||||
| 2025-08-15 | 13F | Morgan Stanley | 6 013 104 | 8,34 | 158 145 | 8,42 | ||||
| 2025-07-28 | 13F | Keeler & Nadler Financial Planning & Wealth Management | 128 648 | −30,26 | 3 383 | −30,07 | ||||
| 2025-08-13 | 13F | Strategic Family Wealth Counselors, L.L.C. | 172 022 | 7,08 | 4 524 | 7,18 | ||||
| 2025-07-28 | 13F | RFG Advisory, LLC | 208 523 | −2,22 | 5 484 | −2,14 | ||||
| 2025-07-28 | 13F | Harbour Investments, Inc. | 75 910 | 8,31 | 1 996 | 8,42 | ||||
| 2025-08-08 | 13F | Good Life Advisors, LLC | 0 | −100,00 | 0 | |||||
| 2025-08-04 | 13F | Pensionmark Financial Group, Llc | 18 393 | 118,39 | 484 | 118,55 | ||||
| 2025-08-19 | 13F | Advisory Services Network, LLC | 11 497 | 0,21 | 300 | −0,33 | ||||
| 2025-08-05 | 13F | Tsfg, Llc | 257 051 | 7 | ||||||
| 2025-08-14 | 13F | Comerica Bank | 17 099 | 22,00 | 450 | 22,01 | ||||
| 2025-08-13 | 13F | Capital International Investors | 9 883 029 | 27,71 | 259 924 | 27,81 | ||||
| 2025-08-15 | 13F | WFA of San Diego, LLC | 500 | 13 | ||||||
| 2025-08-14 | 13F | Bank Of America Corp /de/ | 1 203 357 | 269,76 | 31 648 | 270,07 | ||||
| 2025-07-22 | 13F | Orca Wealth Management, LLC | 9 735 | 0,85 | 256 | 1,19 | ||||
| 2025-08-14 | 13F | Keystone Financial Services, LLC | 162 251 | 6,12 | 4 267 | 6,22 | ||||
| 2025-08-27 | 13F/A | Brinker Capital Investments, LLC | 32 320 | 83,24 | 850 | 83,59 | ||||
| 2025-07-03 | 13F | Arvest Investments, Inc. | 976 | 0,00 | 26 | 0,00 | ||||
| 2025-08-14 | 13F | Smartleaf Asset Management LLC | 282 228 | 10,05 | 7 394 | 9,93 | ||||
| 2025-07-14 | 13F | AdvisorNet Financial, Inc | 25 878 | 9,57 | 681 | 9,68 | ||||
| 2025-08-06 | 13F | Commonwealth Equity Services, Llc | 796 700 | 33,48 | 21 | 33,33 | ||||
| 2025-07-08 | 13F | Nbc Securities, Inc. | 365 | 0,00 | 0 | |||||
| 2025-08-05 | 13F | Bank Of Montreal /can/ | 5 300 | 23,26 | 139 | 23,01 | ||||
| 2025-08-04 | 13F | Creative Financial Designs Inc /adv | 14 635 | 116,40 | 385 | 116,95 | ||||
| 2025-08-14 | 13F | Mml Investors Services, Llc | 1 044 671 | 50,44 | 27 | 50,00 | ||||
| 2025-07-31 | 13F | Future You Wealth Llc | 255 289 | 13,96 | 6 714 | 14,05 | ||||
| 2025-07-17 | 13F | Greenbush Financial Group, LLC | 351 514 | 7,32 | 9 245 | 7,40 | ||||
| 2025-07-23 | 13F | InTrack Investment Management Inc | 85 025 | 2 236 | ||||||
| 2025-07-10 | 13F | Sovran Advisors, LLC | 275 159 | 2 040,48 | 7 176 | 2 048,50 | ||||
| 2025-08-01 | 13F | Rossby Financial, LCC | 161 | 4 | ||||||
| 2025-05-15 | 13F/A | Orion Portfolio Solutions, LLC | 17 638 | 464 | ||||||
| 2025-07-31 | 13F | Richards, Merrill & Peterson, Inc. | 66 720 | 33,24 | 1 755 | 33,38 | ||||
| 2025-08-14 | 13F | Herold Advisors, Inc. | 8 679 | 228 | ||||||
| 2025-08-04 | 13F | Assetmark, Inc | 9 359 | 246 | ||||||
| 2025-07-18 | 13F | Truist Financial Corp | 61 167 | 35,88 | 1 609 | 36,04 | ||||
| 2025-07-30 | 13F/A | KPP Advisory Services LLC | 65 349 | −3,55 | 1 719 | −3,48 | ||||
| 2025-08-13 | 13F | Jones Financial Companies Lllp | 347 328 | 65,16 | 9 100 | 64,97 | ||||
| 2025-08-13 | 13F | VestGen Advisors, LLC | 188 202 | 8,53 | 4 950 | 8,60 | ||||
| 2025-08-14 | 13F | Stifel Financial Corp | 1 268 037 | 0,25 | 33 349 | 0,32 | ||||
| 2025-08-05 | 13F | Sigma Planning Corp | 28 069 | −0,00 | 738 | 0,14 | ||||
| 2025-07-28 | 13F | Mutual Advisors, LLC | 103 067 | 31,98 | 2 699 | 31,72 | ||||
| 2025-07-30 | 13F | D.a. Davidson & Co. | 580 897 | −31,15 | 15 278 | −31,10 | ||||
| 2025-07-29 | 13F | Private Trust Co Na | 3 964 | 133,18 | 104 | 136,36 | ||||
| 2025-07-22 | 13F | Confluence Wealth Services, Inc. | 62 377 | 6,84 | 1 641 | 8,11 | ||||
| 2025-08-13 | 13F | Vermillion & White Wealth Management Group, LLC | 3 952 | 5,56 | 104 | 5,10 | ||||
| 2025-08-20 | NP | CGBL - Capital Group Core Balanced ETF Share Class | 9 798 204 | 28,17 | 257 693 | 28,27 | ||||
| 2025-07-29 | 13F | Stratos Wealth Partners, LTD. | 55 369 | 480,33 | 1 456 | 482,40 | ||||
| 2025-08-14 | 13F | Sunbelt Securities, Inc. | 10 927 | 16,12 | 282 | 13,77 | ||||
| 2025-08-13 | 13F | Gateway Wealth Partners, LLC | 22 246 | 31,15 | 585 | 31,46 | ||||
| 2025-07-07 | 13F | Peterson Wealth Advisors, LLC | 7 614 | 200 | ||||||
| 2025-07-30 | 13F | Brookstone Capital Management | 21 382 | −50,24 | 562 | −50,22 | ||||
| 2025-08-12 | 13F | Jacobi Capital Management LLC | 20 904 | 2,30 | 550 | 2,43 | ||||
| 2025-07-24 | 13F | Endeavor Private Wealth, Inc. | 114 217 | 27,62 | 3 004 | 27,73 | ||||
| 2025-08-14 | 13F | Mariner, LLC | 67 940 | −3,76 | 1 787 | −3,72 | ||||
| 2025-07-09 | 13F | Fiduciary Alliance LLC | 122 871 | 3 232 | ||||||
| 2025-08-07 | 13F | Resources Investment Advisors, LLC. | 10 847 | 32,73 | 285 | 33,18 | ||||
| 2025-08-08 | 13F | Avantax Advisory Services, Inc. | 98 394 | 38,10 | 2 588 | 38,19 | ||||
| 2025-07-09 | 13F | Southern Style Financial, Inc. | 0 | −100,00 | 0 | |||||
| 2025-08-05 | 13F | GPS Wealth Strategies Group, LLC | 34 112 | 18,05 | 897 | 18,18 | ||||
| 2025-08-01 | 13F | Envestnet Asset Management Inc | 3 576 899 | 28,00 | 94 072 | 28,10 | ||||
| 2025-08-13 | 13F | Northwestern Mutual Wealth Management Co | 3 504 539 | 32,04 | 92 169 | 32,14 | ||||
| 2025-08-12 | 13F | Cornerstone Wealth Management, LLC | 23 496 | −0,99 | 618 | −0,96 | ||||
| 2025-08-08 | 13F | Capital Investment Advisory Services, LLC | 1 085 | 0,00 | 29 | 0,00 | ||||
| 2025-07-01 | 13F | Harbor Investment Advisory, Llc | 16 213 | 13,46 | 426 | 13,60 | ||||
| 2025-08-14 | 13F | Snowden Capital Advisors LLC | 11 695 | 0,78 | 308 | 0,99 |