Grundläggande statistik
| Institutionella ägare | 242 total, 242 long only, 0 short only, 0 long/short - change of 11,52% MRQ |
| Genomsnittlig portföljallokering | 0.3505 % - change of 3,61% MRQ |
| Institutionella aktier (lång) | 51 850 474 (ex 13D/G) - change of 11,79MM shares 29,42% MRQ |
| Institutionellt värde (lång) | $ 1 502 591 USD ($1000) |
Institutionellt ägande och aktieägare
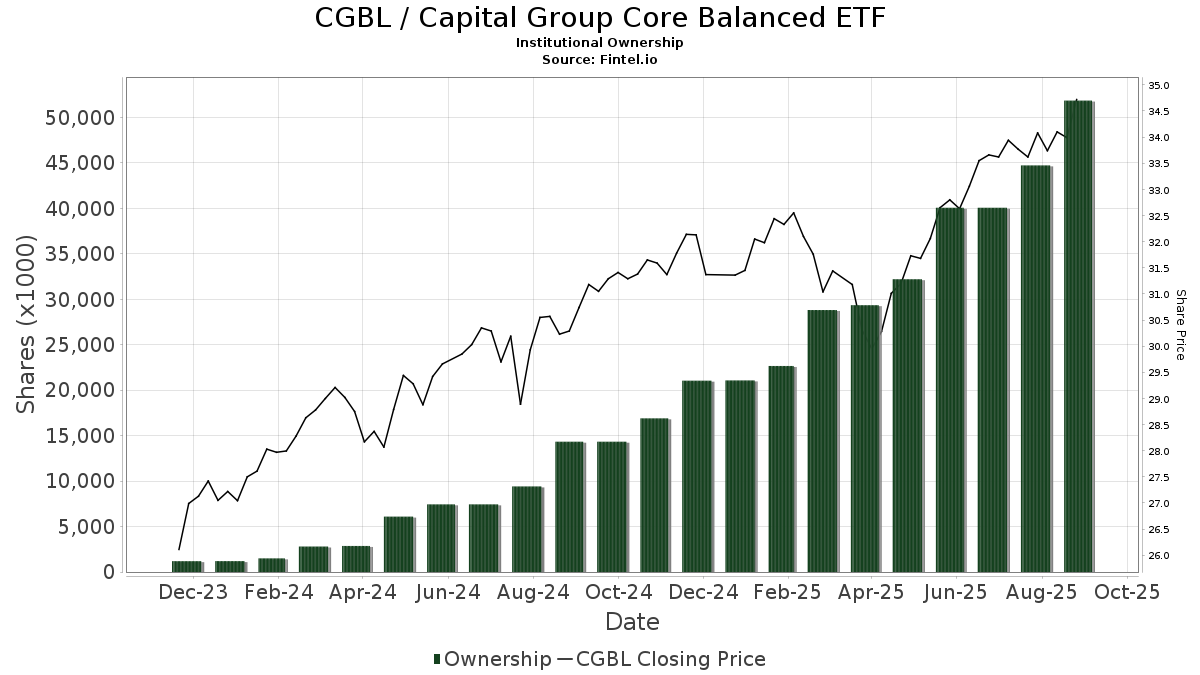
Capital Group Core Balanced ETF (US:CGBL) har 242 Institutionella ägare och aktieägare som har lämnat in 13D/G- eller 13F-formulär till Securities Exchange Commission (SEC). Dessa institut innehar totalt 51,850,474 aktier. Största aktieägare inkluderar LPL Financial LLC, Envestnet Asset Management Inc, Advance Capital Management, Inc., Morgan Stanley, Cwm, Llc, Raymond James Financial Inc, Commonwealth Equity Services, Llc, Wealth Enhancement Advisory Services, Llc, Cetera Investment Advisers, and Cambridge Investment Research Advisors, Inc. .
Capital Group Core Balanced ETF (ARCA:CGBL) Institutionell ägarstruktur visar institutioners och fonders nuvarande positioner i företaget, samt de senaste förändringarna i positionernas storlek. Större aktieägare kan vara enskilda investerare, fonder, hedgefonder eller institutioner. Bilaga 13D visar att investeraren äger (eller ägde) mer än 5% av företaget och avser (eller avsåg) att aktivt eftersträva en förändring av affärsstrategin. Schedule 13G indikerar en passiv investering på över 5%.
The share price as of September 12, 2025 is 34,78 / share. Previously, on September 16, 2024, the share price was 30,84 / share. This represents an increase of 12,78% over that period.
Fondsentimentets poäng
Fondsentimentet poängen(fka Ägarackumulation-poäng) visar vilka aktier som är mest köpta av fonder. Det är resultatet av en sofistikerad kvantitativ flerfaktormodell som identifierar företag med de högsta nivåerna av institutionell ackumulering. Poängsättningsmodellen använder en kombination av den totala ökningen av redovisade ägare, förändringarna i portföljallokeringarna för dessa ägare och andra mått. Siffran sträcker sig från 0 till 100, där högre siffror indikerar en högre nivå av ackumulering i förhållande till sina konkurrenter, och 50 är genomsnittet.
Uppdateringsfrekvens: Dagligen
Se Ownership Explorer, som innehåller en lista över de högst rankade företagen.
Institutionell sälj/köp-kvot
Förutom att rapportera vanliga eget kapital- och skuldemissioner måste institutioner med mer än 100MM tillgångar under förvaltning också avslöja sina innehav av sälj- och köpoptioner. Eftersom säljoptioner i allmänhet indikerar ett negativt sentiment och köpoptioner indikerar ett positivt sentiment, kan vi få en uppfattning om det övergripande institutionella sentimentet genom att plotta förhållandet mellan säljoptioner och köpoptioner. Diagrammet till höger visar det historiska förhållandet mellan sälj- och köpoptioner för detta instrument.
Genom att använda sälj/köp-kvoten som en indikator på aktieägarnas sentiment undviker man en av de största bristerna med att använda det totala institutionella ägandet, nämligen att en betydande del av de förvaltade tillgångarna investeras passivt för att följa index. Passivt förvaltade fonder köper vanligtvis inte optioner, så indikatorn för sälj/köp-kvoten ger en bättre bild av stämningen i aktivt förvaltade fonder.
13F- och NPORT-arkiveringar
Detaljer om 13F-arkiveringar är gratis. Detaljer om NP-arkiveringar kräver ett premiummedlemskap. Gröna rader indikerar nya positioner. Röda rader indikerar stängda positioner. Klicka på länk symbolen för att se hela transaktionshistoriken.
Uppgradera
för att låsa upp premiumdata och exportera till Excel ![]() .
.
| Fil Datum | Källa | Investerare | Typ | Genomsnittligt pris (beräknat) |
Aktier | Δ Aktier (%) |
Rapporterat värde (1000 USD) |
Δ Värde (%) |
Portföljallokering (%) |
|
|---|---|---|---|---|---|---|---|---|---|---|
| 2025-07-29 | 13F | Burford Brothers, Inc. | 38 845 | 18,69 | 1 299 | 28,13 | ||||
| 2025-08-15 | 13F | First Heartland Consultants, Inc. | 56 571 | 59,51 | 1 892 | 72,22 | ||||
| 2025-07-22 | 13F | Merit Financial Group, LLC | 156 348 | 119,34 | 5 228 | 136,78 | ||||
| 2025-07-29 | 13F | Stratos Wealth Advisors, LLC | 40 162 | 40,47 | 1 343 | 51,75 | ||||
| 2025-08-13 | 13F | Certior Financial Group, Llc | 13 308 | 9,51 | 445 | 18,35 | ||||
| 2025-08-14 | 13F | UBS Group AG | 113 689 | 24,39 | 3 802 | 34,26 | ||||
| 2025-08-19 | 13F | National Asset Management, Inc. | 384 074 | 514,41 | 12 843 | 557,27 | ||||
| 2025-08-14 | 13F | TCG Advisory Services, LLC | 35 093 | −52,27 | 1 173 | −48,48 | ||||
| 2025-08-12 | 13F | Financial Advocates Investment Management | 34 722 | −8,52 | 1 161 | −1,19 | ||||
| 2025-07-29 | 13F | Signature Estate & Investment Advisors Llc | 89 976 | 13,75 | 3 009 | 22,78 | ||||
| 2025-07-14 | 13F | Sweeney & Michel, Llc | 6 437 | 216 | ||||||
| 2025-07-16 | 13F | Kiley Juergens Wealth Management, Llc | 15 061 | 32,73 | 504 | 43,30 | ||||
| 2025-07-09 | 13F | Keystone Wealth Services, LLC | 30 000 | −16,86 | 1 003 | −10,21 | ||||
| 2025-08-11 | 13F | Bell Investment Advisors, Inc | 46 | 0,00 | 2 | 0,00 | ||||
| 2025-08-08 | 13F | Gts Securities Llc | 15 693 | 525 | ||||||
| 2025-08-14 | 13F | Diversify Wealth Management, Llc | 11 911 | 14,05 | 405 | 25,39 | ||||
| 2025-08-11 | 13F | Private Advisor Group, LLC | 444 601 | 20,12 | 14 867 | 29,66 | ||||
| 2025-07-29 | 13F | Koshinski Asset Management, Inc. | 64 610 | 4,76 | 2 161 | 13,09 | ||||
| 2025-07-29 | 13F | Balboa Wealth Partners | 14 723 | 492 | ||||||
| 2025-07-29 | 13F | Private Trust Co Na | 9 866 | 0,00 | 330 | 7,87 | ||||
| 2025-07-28 | 13F | Sagespring Wealth Partners, Llc | 119 313 | 27,27 | 3 990 | 37,36 | ||||
| 2025-08-12 | 13F | Lodestone Wealth Management LLC | 12 927 | 0,32 | 432 | 8,27 | ||||
| 2025-08-07 | 13F | Cvfg Llc | 103 662 | 17,84 | 3 466 | 27,19 | ||||
| 2025-08-06 | 13F | Vantage Financial Partners, LLC | 33 821 | 1 131 | ||||||
| 2025-08-11 | 13F | Principal Securities, Inc. | 1 985 | 66 | ||||||
| 2025-05-02 | 13F | Capital A Wealth Management, LLC | 1 858 | −8,92 | 58 | −9,52 | ||||
| 2025-07-22 | 13F | Simplicity Wealth,LLC | 6 402 | 214 | ||||||
| 2025-08-12 | 13F | Jpmorgan Chase & Co | 8 040 | 269 | ||||||
| 2025-08-18 | 13F | Tyler-Stone Wealth Management | 20 990 | 15,20 | 702 | 24,29 | ||||
| 2025-07-10 | 13F | Financial Management Network Inc | 7 614 | −8,78 | 257 | 6,22 | ||||
| 2025-08-04 | 13F | Mesirow Financial Investment Management, Inc. | 289 500 | 10,40 | 9 681 | 19,15 | ||||
| 2025-08-12 | 13F | SRS Capital Advisors, Inc. | 4 453 | 85,08 | 149 | 100,00 | ||||
| 2025-07-25 | 13F | McNamara Financial Services, Inc. | 10 271 | −54,94 | 343 | −51,42 | ||||
| 2025-08-14 | 13F | Wells Fargo & Company/mn | 612 948 | 369 145,78 | 20 497 | 409 820,00 | ||||
| 2025-08-14 | 13F | GWM Advisors LLC | 133 638 | 293,72 | 4 469 | 325,12 | ||||
| 2025-08-14 | 13F | IHT Wealth Management, LLC | 15 668 | 77,92 | 524 | 92,28 | ||||
| 2025-08-13 | 13F | Bare Financial Services, Inc | 36 522 | 22,55 | 1 221 | 32,29 | ||||
| 2025-07-22 | 13F | DAVENPORT & Co LLC | 47 186 | 74,80 | 1 578 | 88,64 | ||||
| 2025-08-14 | 13F | Wiley Bros.-aintree Capital, Llc | 164 127 | 46,97 | 5 527 | 58,59 | ||||
| 2025-07-17 | 13F | KWB Wealth | 232 371 | 68,01 | 7 199 | 66,47 | ||||
| 2025-07-28 | 13F | Holistic Planning, LLC | 6 398 | −39,56 | 214 | −34,86 | ||||
| 2025-07-25 | 13F | Atria Wealth Solutions, Inc. | 60 108 | −59,28 | 2 020 | −56,00 | ||||
| 2025-08-14 | 13F | Great Valley Advisor Group, Inc. | 344 272 | 25,35 | 11 513 | 35,31 | ||||
| 2025-07-25 | 13F | Cwm, Llc | 2 207 565 | 208,62 | 74 | 231,82 | ||||
| 2025-05-08 | 13F | Plante Moran Financial Advisors, LLC | 0 | −100,00 | 0 | |||||
| 2025-08-15 | 13F | High Falls Advisors, Inc | 9 635 | 0,00 | 322 | 8,05 | ||||
| 2025-08-14 | 13F | Tudor Financial Inc. | 11 394 | 50,75 | 381 | 62,82 | ||||
| 2025-08-08 | 13F | Kingsview Wealth Management, LLC | 27 787 | −12,25 | 929 | −5,30 | ||||
| 2025-08-08 | 13F | Creative Planning | 6 530 | 218 | ||||||
| 2025-08-14 | 13F | Clg Llc | 92 348 | 125,22 | 3 088 | 143,15 | ||||
| 2025-07-21 | 13F | Patriot Financial Group Insurance Agency, LLC | 55 705 | 27,74 | 1 863 | 37,93 | ||||
| 2025-08-08 | 13F | CWS Financial Advisors, LLC | 93 389 | 32,24 | 3 123 | 42,75 | ||||
| 2025-08-14 | 13F | Mpwm Advisory Solutions, Llc | 444 | 1,83 | 15 | 7,69 | ||||
| 2025-08-04 | 13F | Bridgewealth Advisory Group, LLC | 16 631 | 5,96 | 556 | 14,40 | ||||
| 2025-08-14 | 13F | Benjamin Edwards Inc | 265 893 | 40,89 | 8 891 | 52,09 | ||||
| 2025-08-13 | 13F | Baird Financial Group, Inc. | 203 993 | 3,58 | 6 822 | 11,80 | ||||
| 2025-08-01 | 13F | Gwn Securities Inc. | 0 | −100,00 | 0 | |||||
| 2025-08-11 | 13F | United Advisor Group, LLC | 28 694 | 69,85 | 960 | 83,37 | ||||
| 2025-08-11 | 13F | Regal Investment Advisors LLC | 9 166 | 307 | ||||||
| 2025-07-24 | 13F | IFP Advisors, Inc | 210 471 | 16,47 | 7 038 | 25,72 | ||||
| 2025-07-08 | 13F | Advance Capital Management, Inc. | 2 707 404 | 24,39 | 90 536 | 34,27 | ||||
| 2025-07-29 | 13F | Latitude Advisors, LLC | 16 433 | 7,70 | 550 | 16,31 | ||||
| 2025-08-12 | 13F | Steward Partners Investment Advisory, Llc | 51 829 | 14,97 | 1 733 | 24,14 | ||||
| 2025-07-23 | 13F | Clear Creek Financial Management, LLC | 89 959 | 6,48 | 3 008 | 14,94 | ||||
| 2025-08-14 | 13F | Royal Bank Of Canada | 1 533 507 | 1,59 | 51 281 | 9,66 | ||||
| 2025-07-10 | 13F | High Net Worth Advisory Group LLC | 164 745 | 18,93 | 5 509 | 28,38 | ||||
| 2025-08-04 | 13F | Flagship Harbor Advisors, Llc | 194 959 | 6 519 | ||||||
| 2025-08-15 | 13F | Morgan Stanley | 2 402 025 | 9,23 | 80 324 | 17,91 | ||||
| 2025-08-12 | 13F | Proequities, Inc. | 0 | 0 | ||||||
| 2025-07-30 | 13F | Financial Perspectives, Inc | 5 821 | 225,92 | 195 | 252,73 | ||||
| 2025-08-14 | 13F | Visionary Wealth Advisors | 18 078 | 6,66 | 605 | 15,05 | ||||
| 2025-07-23 | 13F | Capital Management Associates, Inc | 186 189 | −40,48 | 6 226 | −35,75 | ||||
| 2025-08-14 | 13F | Susquehanna International Group, Llp | 304 914 | 10 196 | ||||||
| 2025-08-08 | 13F | Thoroughbred Financial Services, Llc | 112 179 | 27,12 | 4 | 50,00 | ||||
| 2025-08-12 | 13F | Franklin Resources Inc | 61 621 | 2 061 | ||||||
| 2025-07-15 | 13F | Colonial River Wealth Management, LLC | 12 173 | 22,00 | 411 | 32,69 | ||||
| 2025-08-13 | 13F | Continuum Advisory, LLC | 24 225 | 23,00 | 810 | 32,79 | ||||
| 2025-07-10 | 13F | Wealth Enhancement Advisory Services, Llc | 1 796 522 | 3,42 | 60 543 | 12,50 | ||||
| 2025-08-08 | 13F | Security Financial Services, INC. | 23 733 | 794 | ||||||
| 2025-07-24 | 13F | MSH Capital Advisors LLC | 0 | −100,00 | 0 | |||||
| 2025-08-12 | 13F | J.w. Cole Advisors, Inc. | 22 544 | 61,09 | 754 | 73,90 | ||||
| 2025-08-14 | 13F | Challenger Wealth Management | 109 258 | −6,08 | 3 654 | 1,39 | ||||
| 2025-07-07 | 13F | Thurston, Springer, Miller, Herd & Titak, Inc. | 9 916 | 110,58 | 332 | 128,28 | ||||
| 2025-07-16 | 13F | Strategic Investment Solutions, Inc. /IL | 2 437 | 0,00 | 81 | 8,00 | ||||
| 2025-07-30 | 13F | Smith Thornton Advisors LLC | 20 073 | 50,45 | 671 | 62,47 | ||||
| 2025-05-15 | 13F | Fft Wealth Management Llc | 0 | −100,00 | 0 | |||||
| 2025-07-09 | 13F | Pines Wealth Management, LLC | 19 984 | 11,18 | 673 | 30,93 | ||||
| 2025-08-15 | 13F | Captrust Financial Advisors | 81 796 | 20,32 | 2 735 | 29,87 | ||||
| 2025-08-26 | 13F | Nautilus Advisors LLC | 33 518 | −27,19 | 1 121 | −21,46 | ||||
| 2025-08-08 | 13F | Cetera Investment Advisers | 1 744 688 | 12,21 | 58 342 | 21,12 | ||||
| 2025-08-06 | 13F | Prospera Financial Services Inc | 87 584 | 42,44 | 2 929 | 53,75 | ||||
| 2025-07-21 | 13F | Ameritas Advisory Services, LLC | 33 764 | −39,72 | 1 129 | −35,26 | ||||
| 2025-08-14 | 13F | Old Mission Capital Llc | 261 722 | 563,04 | 8 752 | 616,12 | ||||
| 2025-08-11 | 13F | TD Waterhouse Canada Inc. | 5 645 | 0,00 | 188 | 7,43 | ||||
| 2025-08-07 | 13F | Allworth Financial LP | 4 666 | 9,12 | 156 | 19,08 | ||||
| 2025-08-12 | 13F | Leigh Baldwin & Co., Llc | 30 925 | 56,34 | 1 034 | 68,95 | ||||
| 2025-07-16 | 13F | Essex Financial Services, Inc. | 85 482 | 48,78 | 2 859 | 60,56 | ||||
| 2025-08-15 | 13F | Equitable Holdings, Inc. | 89 923 | 353,79 | 3 007 | 390,54 | ||||
| 2025-08-13 | 13F | Keystone Financial Group | 9 071 | 21,06 | 303 | 30,60 | ||||
| 2025-05-14 | 13F | Oarsman Capital, Inc. | 0 | −100,00 | 0 | |||||
| 2025-07-22 | 13F | Iron Horse Wealth Management, LLC | 1 000 | 0,00 | 33 | 10,00 | ||||
| 2025-07-28 | 13F | Axxcess Wealth Management, Llc | 12 173 | 22,00 | 407 | 31,72 | ||||
| 2025-04-14 | 13F | Strategic Wealth Designers | 0 | −100,00 | 0 | −100,00 | ||||
| 2025-07-21 | 13F | Warner Financial, Inc | 7 289 | −10,98 | 0 | |||||
| 2025-08-13 | 13F | Capital Group Private Client Services, Inc. | 173 825 | 9,23 | 5 813 | 17,89 | ||||
| 2025-07-30 | 13F | Strategic Blueprint, LLC | 131 834 | 316,20 | 4 409 | 349,34 | ||||
| 2025-08-05 | 13F | Dahring | Cusmano Llc | 49 786 | −6,38 | 1 665 | 1,03 | ||||
| 2025-08-06 | 13F | Mark Sheptoff Financial Planning, Llc | 2 088 | 0,00 | 70 | 7,81 | ||||
| 2025-07-17 | 13F | Janney Montgomery Scott LLC | 310 430 | 69,54 | 10 | 100,00 | ||||
| 2025-07-14 | 13F | Ai Financial Services Llc | 8 179 | 0,00 | 274 | 7,91 | ||||
| 2025-08-14 | 13F | Gerber Kawasaki Wealth & Investment Management | 91 327 | 23,10 | 3 054 | 32,90 | ||||
| 2025-07-31 | 13F | Cambridge Investment Research Advisors, Inc. | 1 636 062 | 5,62 | 55 | 14,89 | ||||
| 2025-08-14 | 13F | Integrated Wealth Concepts LLC | 106 710 | 32,59 | 3 568 | 43,12 | ||||
| 2025-08-13 | 13F | Cary Street Partners Financial Llc | 367 032 | 4 825,94 | 12 274 | 5 236,09 | ||||
| 2025-07-16 | 13F | St Germain D J Co Inc | 652 940 | −7,48 | 21 834 | −0,13 | ||||
| 2025-08-12 | 13F | LPL Financial LLC | 7 448 979 | 35,32 | 249 094 | 46,06 | ||||
| 2025-08-14 | 13F | Modern Wealth Management, LLC | 9 480 | −0,42 | 317 | 7,82 | ||||
| 2025-08-13 | 13F | Smith, Moore & Co. | 153 168 | 23,59 | 5 122 | 33,39 | ||||
| 2025-08-06 | 13F | Founders Financial Securities Llc | 182 165 | 11,98 | 6 092 | 21,31 | ||||
| 2025-08-14 | 13F | Tennessee Valley Asset Management Partners | 0 | −100,00 | 0 | |||||
| 2025-08-14 | 13F | Raymond James Financial Inc | 1 838 766 | 75,56 | 61 488 | 89,50 | ||||
| 2025-07-25 | 13F | Concurrent Investment Advisors, LLC | 355 793 | 78,57 | 11 898 | 92,76 | ||||
| 2025-07-29 | 13F | Stephens Inc /ar/ | 11 695 | 391 | ||||||
| 2025-07-31 | 13F | Buckingham Strategic Partners | 16 144 | 30,73 | 540 | 41,10 | ||||
| 2025-08-14 | 13F | Hilltop Holdings Inc. | 9 750 | 0,00 | 326 | 7,95 | ||||
| 2025-08-14 | 13F | Jane Street Group, Llc | 140 000 | −50,23 | 4 682 | −46,28 | ||||
| 2025-07-16 | 13F | ORG Partners LLC | 27 604 | 4 700,70 | 921 | 5 317,65 | ||||
| 2025-07-16 | 13F | Spinnaker Investment Group, LLC | 12 541 | 419 | ||||||
| 2025-08-11 | 13F | Advisor Resource Council | 6 533 | −96,04 | 218 | −95,73 | ||||
| 2025-05-14 | 13F | Orion Portfolio Solutions, LLC | 8 450 | 0,00 | 264 | 0,00 | ||||
| 2025-07-10 | 13F | Worth Asset Management, LLC | 161 429 | 70,43 | 5 398 | 83,98 | ||||
| 2025-07-11 | 13F | AA Financial Advisors, LLC | 57 599 | −2,21 | 1 926 | 5,59 | ||||
| 2025-07-28 | 13F | SFG Wealth Management, LLC. | 0 | −100,00 | 0 | |||||
| 2025-07-09 | 13F | Massmutual Trust Co Fsb/adv | 11 | 0,00 | 0 | |||||
| 2025-08-14 | 13F | Colony Group, LLC | 7 472 | 250 | ||||||
| 2025-07-24 | 13F | Us Bancorp \de\ | 540 | 0,00 | 18 | 12,50 | ||||
| 2025-09-04 | 13F/A | Advisor Group Holdings, Inc. | 1 432 969 | −12,18 | 47 923 | −5,20 | ||||
| 2025-07-23 | 13F | Seamount Financial Group Inc | 126 907 | 19,54 | 4 244 | 29,05 | ||||
| 2025-08-12 | 13F | Richmond Investment Services, LLC | 24 583 | 91,52 | 822 | 107,05 | ||||
| 2025-04-10 | 13F | Eclectic Associates Inc /adv | 0 | −100,00 | 0 | |||||
| 2025-07-17 | 13F | Venture Visionary Partners LLC | 85 405 | 52,55 | 2 856 | 64,65 | ||||
| 2025-08-04 | 13F | Northwest Financial Advisors | 13 195 | 441 | ||||||
| 2025-08-14 | 13F | Citadel Advisors Llc | 255 847 | 469,08 | 8 556 | 514,58 | ||||
| 2025-07-15 | 13F | tru Independence LLC | 8 370 | 7,85 | 280 | 16,25 | ||||
| 2025-07-15 | 13F | Hartmann Taylor Wealth Management, LLC | 287 133 | −1,53 | 9 602 | 6,29 | ||||
| 2025-05-14 | 13F | Capital Analysts, Inc. | 0 | −100,00 | 0 | |||||
| 2025-07-09 | 13F | Dynamic Advisor Solutions LLC | 8 107 | −3,57 | 271 | 4,23 | ||||
| 2025-05-12 | 13F | WealthPLAN Partners, LLC | 0 | −100,00 | 0 | |||||
| 2025-07-25 | 13F | Apollon Wealth Management, LLC | 57 599 | 1 926 | ||||||
| 2025-08-12 | 13F | Summit Global Investments | 13 015 | 10,13 | 0 | |||||
| 2025-05-15 | 13F | MAI Capital Management | 0 | −100,00 | 0 | |||||
| 2025-07-31 | 13F | Moloney Securities Asset Management, LLC | 28 516 | 9,02 | 954 | 17,65 | ||||
| 2025-08-01 | 13F | Taylor Financial Group, Inc. | 104 370 | 11,05 | 3 490 | 19,89 | ||||
| 2025-08-15 | 13F | Kestra Advisory Services, LLC | 807 188 | 19,99 | 26 992 | 29,51 | ||||
| 2025-07-28 | 13F | Eq Wealth Advisors, Llc | 280 | 0,36 | 9 | 12,50 | ||||
| 2025-08-13 | 13F | VestGen Advisors, LLC | 277 245 | 5,15 | 9 271 | 13,50 | ||||
| 2025-07-14 | 13F | Armstrong Advisory Group, Inc | 0 | −100,00 | 0 | |||||
| 2025-07-31 | 13F | Richards, Merrill & Peterson, Inc. | 0 | −100,00 | 0 | |||||
| 2025-04-30 | 13F | J Hagan Capital, Inc. | 120 264 | 3 761 | ||||||
| 2025-07-02 | 13F | HBW Advisory Services LLC | 18 755 | 134,53 | 627 | 153,85 | ||||
| 2025-08-15 | 13F | Lantern Wealth Advisors, LLC | 18 220 | 609 | ||||||
| 2025-07-25 | 13F | We Are One Seven, LLC | 31 293 | 6,46 | 1 046 | 14,95 | ||||
| 2025-07-17 | 13F | Prepared Retirement Institute LLC | 9 528 | 0,40 | 319 | 8,16 | ||||
| 2025-07-21 | 13F | Ashton Thomas Securities, Llc | 29 780 | 64,43 | 996 | 77,36 | ||||
| 2025-07-25 | 13F | Transcendent Capital Group LLC | 8 592 | −11,01 | 287 | −4,01 | ||||
| 2025-07-25 | 13F | Quantum Financial Planning Services, Inc. | 237 715 | 2 113,77 | 7 949 | 2 294,28 | ||||
| 2025-08-14 | 13F | Evergreen Wealth Solutions, LLC | 6 850 | 229 | ||||||
| 2025-07-17 | 13F | Tempus Wealth Planning, LLC | 134 649 | 2,51 | 4 503 | 10,64 | ||||
| 2025-08-05 | 13F | Claro Advisors LLC | 6 675 | 0,60 | 223 | 8,78 | ||||
| 2025-07-11 | 13F | LongView Wealth Management | 158 837 | 18,21 | 5 312 | 27,61 | ||||
| 2025-08-07 | 13F | Clarity Wealth Advisors, LLC | 106 568 | 19,67 | 3 564 | 29,19 | ||||
| 2025-08-13 | 13F | Renaissance Technologies Llc | 93 100 | 3 113 | ||||||
| 2025-07-17 | 13F | Johnson Bixby & Associates, LLC | 206 975 | −0,59 | 6 921 | 7,30 | ||||
| 2025-08-05 | 13F | Magnolia Capital Advisors Llc | 10 738 | 0,00 | 359 | 8,13 | ||||
| 2025-08-11 | 13F | Rothschild Investment Llc | 7 620 | 0,86 | 255 | 8,55 | ||||
| 2025-07-03 | 13F | Arvest Investments, Inc. | 1 765 | 0,00 | 59 | 9,26 | ||||
| 2025-07-22 | 13F | Beacon Financial Advisory LLC | 39 538 | 25,39 | 1 322 | 35,45 | ||||
| 2025-08-13 | 13F | RIA Advisory Group LLC | 30 785 | 3,83 | 1 029 | 12,09 | ||||
| 2025-07-23 | 13F | Valmark Advisers, Inc. | 64 442 | 35,59 | 2 155 | 46,33 | ||||
| 2025-07-28 | 13F | RFG Advisory, LLC | 82 545 | 76,79 | 2 760 | 90,87 | ||||
| 2025-08-04 | 13F | Spire Wealth Management | 4 845 | −43,87 | 162 | −39,33 | ||||
| 2025-08-07 | 13F | Kestra Private Wealth Services, Llc | 459 776 | 125,94 | 15 375 | 143,88 | ||||
| 2025-07-31 | 13F | Hobart Private Capital, LLC | 6 549 | −1,00 | 219 | 6,86 | ||||
| 2025-08-11 | 13F | HighTower Advisors, LLC | 184 414 | 8,68 | 6 167 | 17,29 | ||||
| 2025-08-01 | 13F | Brookwood Investment Group LLC | 20 367 | −2,61 | 681 | 5,26 | ||||
| 2025-08-11 | 13F | Synergy Investment Management, LLC | 0 | −100,00 | 0 | |||||
| 2025-07-28 | 13F | Harbour Investments, Inc. | 436 456 | 37,28 | 14 595 | 48,19 | ||||
| 2025-08-05 | 13F | Carson Advisory Inc. | 13 075 | 0,00 | 437 | 7,90 | ||||
| 2025-08-07 | 13F | PFG Advisors | 49 998 | 54,59 | 1 672 | 66,93 | ||||
| 2025-08-14 | 13F | Harmony Asset Management Llc | 5 993 | 200 | ||||||
| 2025-08-05 | 13F | Westside Investment Management, Inc. | 108 068 | 8,57 | 3 614 | 17,19 | ||||
| 2025-08-04 | 13F | WNY Asset Management, LLC | 42 077 | −12,17 | 1 407 | −5,19 | ||||
| 2025-08-14 | 13F | Comerica Bank | 56 672 | −9,92 | 1 895 | −2,72 | ||||
| 2025-07-14 | 13F | Golden State Equity Partners | 0 | −100,00 | 0 | |||||
| 2025-08-19 | 13F | Advisory Services Network, LLC | 121 134 | −34,49 | 4 074 | −28,89 | ||||
| 2025-07-14 | 13F | Opal Wealth Advisors, LLC | 1 372 | 106,94 | 46 | 125,00 | ||||
| 2025-08-29 | 13F | Centaurus Financial, Inc. | 93 507 | 28,06 | 3 | 50,00 | ||||
| 2025-08-14 | 13F | Bank Of America Corp /de/ | 1 | 0 | ||||||
| 2025-07-10 | 13F | Sovran Advisors, LLC | 75 663 | 1 024,26 | 2 529 | 1 158,21 | ||||
| 2025-08-01 | 13F | Envestnet Asset Management Inc | 4 140 219 | 31,55 | 138 449 | 42,00 | ||||
| 2025-08-13 | 13F | Capital International Investors | 21 704 | −31,43 | 726 | −26,02 | ||||
| 2025-07-30 | 13F | Bleakley Financial Group, LLC | 94 682 | 52,48 | 3 166 | 64,64 | ||||
| 2025-08-11 | 13F | Nations Financial Group Inc, /ia/ /adv | 15 490 | 101,14 | 518 | 117,65 | ||||
| 2025-09-09 | 13F | NWF Advisory Services Inc. | 18 124 | 1,73 | 606 | 9,98 | ||||
| 2025-08-27 | 13F/A | Brinker Capital Investments, LLC | 6 385 | 214 | ||||||
| 2025-08-04 | 13F | Pensionmark Financial Group, Llc | 132 554 | 25,74 | 4 433 | 35,74 | ||||
| 2025-07-29 | 13F | Creekside Partners | 12 456 | 417 | ||||||
| 2025-08-14 | 13F | Mml Investors Services, Llc | 706 202 | 24,75 | 24 | 35,29 | ||||
| 2025-08-14 | 13F | Smartleaf Asset Management LLC | 336 809 | 13,43 | 11 263 | 22,43 | ||||
| 2025-08-12 | 13F | Global Retirement Partners, LLC | 9 683 | 289,81 | 324 | 319,48 | ||||
| 2025-07-16 | 13F | Owen LaRue, LLC | 22 420 | −48,80 | 750 | −44,76 | ||||
| 2025-07-16 | 13F | Independent Wealth Network Inc. | 25 006 | 18,18 | 836 | 27,63 | ||||
| 2025-07-16 | 13F | Dakota Wealth Management | 23 184 | −6,69 | 779 | 0,78 | ||||
| 2025-08-14 | 13F | Herold Advisors, Inc. | 18 220 | 609 | ||||||
| 2025-08-04 | 13F | Creative Financial Designs Inc /adv | 1 300 | 0,00 | 43 | 7,50 | ||||
| 2025-07-30 | 13F | Cullen/frost Bankers, Inc. | 155 280 | 41,37 | 5 193 | 52,62 | ||||
| 2025-08-04 | 13F | Assetmark, Inc | 22 668 | 758 | ||||||
| 2025-08-01 | 13F | Rossby Financial, LCC | 29 | 1 | ||||||
| 2025-07-17 | 13F | Greenbush Financial Group, LLC | 435 176 | 30,55 | 14 552 | 40,93 | ||||
| 2025-08-05 | 13F | Strategic Financial Concepts, LLC | 9 602 | −23,58 | 321 | −17,48 | ||||
| 2025-08-07 | 13F | Midwest Trust Co | 9 783 | 327 | ||||||
| 2025-07-14 | 13F | AdvisorNet Financial, Inc | 26 163 | 26,27 | 875 | 36,35 | ||||
| 2025-07-29 | 13F | Uhlmann Price Securities, Llc | 16 032 | 18,81 | 536 | 28,23 | ||||
| 2025-07-21 | 13F | Ameriflex Group, Inc. | 0 | −100,00 | 0 | |||||
| 2025-08-06 | 13F | Commonwealth Equity Services, Llc | 1 818 806 | −0,16 | 61 | 7,14 | ||||
| 2025-08-18 | 13F | N.E.W. Advisory Services LLC | 4 287 | −49,80 | 143 | −45,83 | ||||
| 2025-08-14 | 13F | Stifel Financial Corp | 439 413 | 56,41 | 14 694 | 68,84 | ||||
| 2025-07-29 | 13F | Stratos Wealth Partners, LTD. | 83 082 | 237,25 | 2 778 | 264,09 | ||||
| 2025-08-13 | 13F | Rockport Wealth LLC | 0 | −100,00 | 0 | |||||
| 2025-07-23 | 13F | Armstrong, Fleming & Moore, Inc | 15 918 | 532 | ||||||
| 2025-08-14 | 13F | Ausdal Financial Partners, Inc. | 13 665 | 17,62 | 457 | 27,02 | ||||
| 2025-08-14 | 13F | Sunbelt Securities, Inc. | 156 919 | 0,29 | 4 907 | 1,22 | ||||
| 2025-08-18 | 13F | Geneos Wealth Management Inc. | 110 417 | 439,12 | 3 692 | 482,33 | ||||
| 2025-07-09 | 13F | Divergent Planning, LLC | 66 782 | 2 233 | ||||||
| 2025-07-30 | 13F/A | KPP Advisory Services LLC | 17 533 | 0,00 | 586 | 7,92 | ||||
| 2025-05-12 | 13F | Independent Advisor Alliance | 0 | −100,00 | 0 | |||||
| 2025-07-18 | 13F | Truist Financial Corp | 79 312 | 9,60 | 2 652 | 18,34 | ||||
| 2025-08-13 | 13F | Jones Financial Companies Lllp | 644 046 | 103,28 | 21 537 | 119,42 | ||||
| 2025-07-28 | 13F | Mutual Advisors, LLC | 32 788 | −11,04 | 1 113 | −1,85 | ||||
| 2025-08-14 | 13F | Acas, Llc | 127 742 | 9,35 | 4 353 | 19,92 | ||||
| 2025-08-08 | 13F | Davies Financial Advisors, Inc. | 55 223 | −2,11 | 1 847 | 5,67 | ||||
| 2025-08-13 | 13F | Gateway Wealth Partners, LLC | 24 810 | 28,40 | 830 | 38,63 | ||||
| 2025-08-13 | 13F | Vermillion & White Wealth Management Group, LLC | 8 120 | 4,09 | 272 | 12,45 | ||||
| 2025-08-14 | 13F | Advisor OS, LLC | 19 521 | 1,50 | 653 | 9,58 | ||||
| 2025-07-22 | 13F | Confluence Wealth Services, Inc. | 271 820 | 3,49 | 9 090 | 14,30 | ||||
| 2025-07-25 | 13F | Envestnet Portfolio Solutions, Inc. | 85 501 | −54,70 | 2 859 | −51,10 | ||||
| 2025-08-06 | 13F | Mascagni Wealth Management, Inc. | 67 080 | −12,85 | 2 243 | −5,91 | ||||
| 2025-07-30 | 13F | D.a. Davidson & Co. | 263 062 | 11,33 | 8 797 | 20,16 | ||||
| 2025-07-24 | 13F | Endeavor Private Wealth, Inc. | 183 381 | 24,83 | 6 162 | 34,87 | ||||
| 2025-07-09 | 13F | StrongBox Wealth, LLC | 66 782 | 4,39 | 2 233 | 12,72 | ||||
| 2025-08-04 | 13F | Savvy Advisors, Inc. | 6 069 | 203 | ||||||
| 2025-08-14 | 13F | Mariner, LLC | 560 777 | 6,75 | 18 752 | 15,22 | ||||
| 2025-07-29 | 13F | Nicholson Wealth Management Group, LLC | 6 392 | 214 | ||||||
| 2025-08-05 | 13F | Sigma Planning Corp | 100 967 | 35,03 | 3 376 | 45,77 | ||||
| 2025-08-13 | 13F | Fi3 FINANCIAL ADVISORS, LLC | 7 351 | 247 | ||||||
| 2025-08-13 | 13F | Northwestern Mutual Wealth Management Co | 22 545 | 194,24 | 754 | 217,72 | ||||
| 2025-07-18 | 13F | Vicus Capital | 16 578 | 61,47 | 554 | 74,21 | ||||
| 2025-08-05 | 13F | GPS Wealth Strategies Group, LLC | 49 010 | 26,71 | 1 639 | 36,73 | ||||
| 2025-08-08 | 13F | Capital Investment Advisory Services, LLC | 9 176 | 20,72 | 307 | 30,21 | ||||
| 2025-08-08 | 13F | Avantax Advisory Services, Inc. | 58 702 | 38,02 | 1 963 | 48,97 | ||||
| 2025-07-30 | 13F | Onyx Bridge Wealth Group LLC | 6 280 | 210 | ||||||
| 2025-08-07 | 13F | PCG Wealth Advisors, LLC | 0 | −100,00 | 0 | |||||
| 2025-08-12 | 13F | Wisconsin Wealth Advisors, LLC | 7 955 | 266 |