Grundläggande statistik
| Institutionella ägare | 117 total, 117 long only, 0 short only, 0 long/short - change of 11,43% MRQ |
| Genomsnittlig portföljallokering | 0.1730 % - change of −16,22% MRQ |
| Institutionella aktier (lång) | 10 594 764 (ex 13D/G) - change of 0,49MM shares 4,80% MRQ |
| Institutionellt värde (lång) | $ 221 789 USD ($1000) |
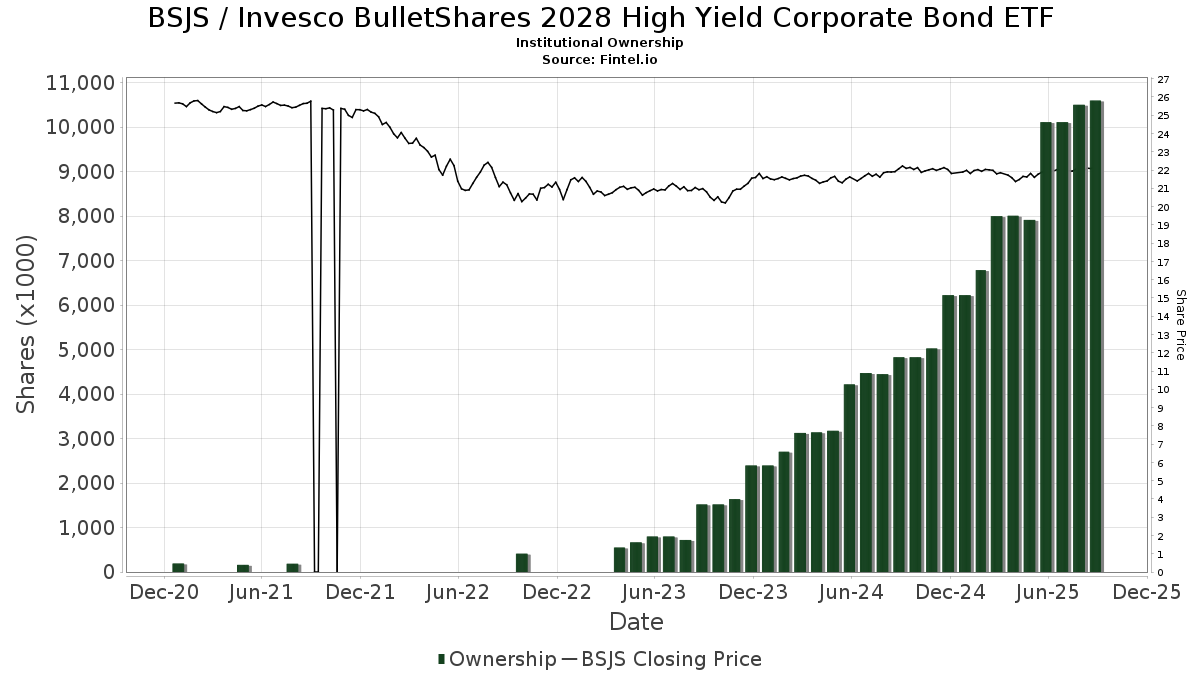
Institutionellt ägande och aktieägare
Invesco BulletShares 2028 High Yield Corporate Bond ETF (US:BSJS) har 117 Institutionella ägare och aktieägare som har lämnat in 13D/G- eller 13F-formulär till Securities Exchange Commission (SEC). Dessa institut innehar totalt 10,594,764 aktier. Största aktieägare inkluderar LPL Financial LLC, Wells Fargo & Company/mn, Morgan Stanley, Envestnet Asset Management Inc, Cetera Investment Advisers, UBS Group AG, SFE Investment Counsel, Equitable Holdings, Inc., Mercer Global Advisors Inc /adv, and Steward Partners Investment Advisory, Llc .
Invesco BulletShares 2028 High Yield Corporate Bond ETF (NasdaqGM:BSJS) Institutionell ägarstruktur visar institutioners och fonders nuvarande positioner i företaget, samt de senaste förändringarna i positionernas storlek. Större aktieägare kan vara enskilda investerare, fonder, hedgefonder eller institutioner. Bilaga 13D visar att investeraren äger (eller ägde) mer än 5% av företaget och avser (eller avsåg) att aktivt eftersträva en förändring av affärsstrategin. Schedule 13G indikerar en passiv investering på över 5%.
The share price as of September 9, 2025 is 22,14 / share. Previously, on September 10, 2024, the share price was 22,02 / share. This represents an increase of 0,54% over that period.
Fondsentimentets poäng
Fondsentimentet poängen(fka Ägarackumulation-poäng) visar vilka aktier som är mest köpta av fonder. Det är resultatet av en sofistikerad kvantitativ flerfaktormodell som identifierar företag med de högsta nivåerna av institutionell ackumulering. Poängsättningsmodellen använder en kombination av den totala ökningen av redovisade ägare, förändringarna i portföljallokeringarna för dessa ägare och andra mått. Siffran sträcker sig från 0 till 100, där högre siffror indikerar en högre nivå av ackumulering i förhållande till sina konkurrenter, och 50 är genomsnittet.
Uppdateringsfrekvens: Dagligen
Se Ownership Explorer, som innehåller en lista över de högst rankade företagen.
Institutionell sälj/köp-kvot
Förutom att rapportera vanliga eget kapital- och skuldemissioner måste institutioner med mer än 100MM tillgångar under förvaltning också avslöja sina innehav av sälj- och köpoptioner. Eftersom säljoptioner i allmänhet indikerar ett negativt sentiment och köpoptioner indikerar ett positivt sentiment, kan vi få en uppfattning om det övergripande institutionella sentimentet genom att plotta förhållandet mellan säljoptioner och köpoptioner. Diagrammet till höger visar det historiska förhållandet mellan sälj- och köpoptioner för detta instrument.
Genom att använda sälj/köp-kvoten som en indikator på aktieägarnas sentiment undviker man en av de största bristerna med att använda det totala institutionella ägandet, nämligen att en betydande del av de förvaltade tillgångarna investeras passivt för att följa index. Passivt förvaltade fonder köper vanligtvis inte optioner, så indikatorn för sälj/köp-kvoten ger en bättre bild av stämningen i aktivt förvaltade fonder.
13F- och NPORT-arkiveringar
Detaljer om 13F-arkiveringar är gratis. Detaljer om NP-arkiveringar kräver ett premiummedlemskap. Gröna rader indikerar nya positioner. Röda rader indikerar stängda positioner. Klicka på länk symbolen för att se hela transaktionshistoriken.
Uppgradera
för att låsa upp premiumdata och exportera till Excel ![]() .
.
| Fil Datum | Källa | Investerare | Typ | Genomsnittligt pris (beräknat) |
Aktier | Δ Aktier (%) |
Rapporterat värde (1000 USD) |
Δ Värde (%) |
Portföljallokering (%) |
|
|---|---|---|---|---|---|---|---|---|---|---|
| 2025-08-01 | 13F | Envestnet Asset Management Inc | 485 597 | 4,84 | 10 707 | 6,82 | ||||
| 2025-04-17 | 13F | Rebalance, Llc | 0 | −100,00 | 0 | |||||
| 2025-08-05 | 13F | Pacific Wealth Strategies Group, Inc. | 31 328 | 172,42 | 687 | 177,02 | ||||
| 2025-04-21 | 13F | Nelson, Van Denburg & Campbell Wealth Management Group, LLC | 0 | −100,00 | 0 | |||||
| 2025-08-12 | 13F | Proequities, Inc. | 0 | 0 | ||||||
| 2025-07-29 | 13F | Tradewinds Capital Management, LLC | 1 215 | 1,76 | 27 | 4,00 | ||||
| 2025-07-28 | 13F | Harbour Investments, Inc. | 48 227 | 2,12 | 1 063 | 4,11 | ||||
| 2025-07-22 | 13F | Net Worth Advisory Group | 17 403 | 21,52 | 384 | 23,95 | ||||
| 2025-07-24 | 13F | IFP Advisors, Inc | 0 | −100,00 | 0 | |||||
| 2025-08-14 | 13F | Arete Wealth Advisors, LLC | 13 923 | 0,00 | 0 | |||||
| 2025-04-22 | 13F | Tassel Capital Management, Inc. | 0 | −100,00 | 0 | |||||
| 2025-09-09 | 13F | Cambridge Financial Group, LLC | 18 942 | 418 | ||||||
| 2025-08-13 | 13F | VestGen Advisors, LLC | 20 337 | 35,48 | 448 | 37,96 | ||||
| 2025-07-25 | 13F | We Are One Seven, LLC | 9 228 | 203 | ||||||
| 2025-08-14 | 13F | Royal Bank Of Canada | 197 775 | 3,89 | 4 361 | 5,88 | ||||
| 2025-08-18 | 13F | Geneos Wealth Management Inc. | 9 751 | 3,32 | 215 | 5,39 | ||||
| 2025-08-19 | 13F | Anchor Investment Management, LLC | 1 425 | 235,29 | 31 | 244,44 | ||||
| 2025-08-12 | 13F | BlackRock, Inc. | 0 | −100,00 | 0 | |||||
| 2025-08-14 | 13F | Integrated Wealth Concepts LLC | 32 804 | 6,52 | 723 | 8,56 | ||||
| 2025-08-08 | 13F | Cetera Investment Advisers | 423 448 | −10,59 | 9 337 | −8,89 | ||||
| 2025-08-12 | 13F | Fca Corp /tx | 49 014 | 1,90 | 1 081 | 3,85 | ||||
| 2025-08-11 | 13F | Aptus Capital Advisors, LLC | 450 | 0,00 | 10 | 0,00 | ||||
| 2025-08-07 | 13F | Private Advisory Group LLC | 22 960 | −2,71 | 506 | −0,78 | ||||
| 2025-07-29 | 13F | BXM Wealth LLC | 10 025 | 221 | ||||||
| 2025-07-11 | 13F | Farther Finance Advisors, LLC | 8 423 | 186 | ||||||
| 2025-09-04 | 13F/A | Advisor Group Holdings, Inc. | 173 216 | 45,01 | 3 820 | 47,79 | ||||
| 2025-07-31 | 13F | Glass Jacobson Investment Advisors llc | 21 559 | 89,30 | 475 | 93,09 | ||||
| 2025-07-09 | 13F | Sarver Vrooman Wealth Advisors | 1 328 | 0,00 | 29 | 3,57 | ||||
| 2025-08-08 | 13F | Foundations Investment Advisors, LLC | 27 282 | 143,52 | 602 | 148,35 | ||||
| 2025-07-22 | 13F | Siligmueller & Norvid Wealth Advisors LLC | 22 520 | −5,74 | 495 | −4,26 | ||||
| 2025-08-06 | 13F | Valtinson Bruner Financial Planning LLC | 19 471 | 0,65 | 429 | 2,63 | ||||
| 2025-08-14 | 13F | Wells Fargo & Company/mn | 747 270 | 0,25 | 16 477 | 2,15 | ||||
| 2025-08-14 | 13F | TCG Advisory Services, LLC | 299 313 | 9,51 | 6 600 | 11,58 | ||||
| 2025-08-14 | 13F | Jane Street Group, Llc | 27 714 | −42,91 | 611 | −41,81 | ||||
| 2025-08-15 | 13F | WFA of San Diego, LLC | 2 294 | 51 | ||||||
| 2025-07-30 | 13F | Brookstone Capital Management | 27 104 | −5,29 | 598 | −3,55 | ||||
| 2025-07-31 | 13F | Oppenheimer & Co Inc | 12 006 | −2,78 | 265 | −1,12 | ||||
| 2025-05-12 | 13F | Fmr Llc | 0 | −100,00 | 0 | |||||
| 2025-08-01 | 13F | Advisory Alpha, LLC | 265 313 | 18,99 | 5 850 | 21,24 | ||||
| 2025-08-12 | 13F | Horizon Financial Services, Llc | 1 582 | −8,87 | 35 | −8,11 | ||||
| 2025-07-10 | 13F | Wealth Enhancement Advisory Services, Llc | 38 571 | −19,98 | 850 | −18,50 | ||||
| 2025-08-12 | 13F | Jpmorgan Chase & Co | 169 | −99,29 | 4 | −99,42 | ||||
| 2025-08-14 | 13F | Susquehanna International Group, Llp | 25 348 | 559 | ||||||
| 2025-08-12 | 13F | J.w. Cole Advisors, Inc. | 11 412 | 0,98 | 252 | 2,87 | ||||
| 2025-07-11 | 13F | AA Financial Advisors, LLC | 15 797 | 348 | ||||||
| 2025-08-07 | 13F | Hennion & Walsh Asset Management, Inc. | 72 463 | 3,98 | 1 598 | 5,90 | ||||
| 2025-08-12 | 13F | Steward Partners Investment Advisory, Llc | 307 039 | −5,26 | 6 770 | −3,46 | ||||
| 2025-07-31 | 13F | Topsail Wealth Management, LLC | 16 060 | 21,76 | 354 | 24,21 | ||||
| 2025-08-08 | 13F | IMA Wealth, Inc. | 32 491 | 0,75 | 716 | 2,73 | ||||
| 2025-07-22 | 13F | 4Thought Financial Group Inc. | 20 899 | −3,25 | 461 | −1,50 | ||||
| 2025-08-13 | 13F | Vermillion & White Wealth Management Group, LLC | 21 269 | −27,28 | 469 | −25,95 | ||||
| 2025-07-29 | 13F | Kraft, Davis & Associates, LLC | 24 925 | 7,57 | 547 | 10,30 | ||||
| 2025-07-24 | 13F | Leo Wealth, LLC | 217 208 | 4 789 | ||||||
| 2025-08-13 | 13F | Capital Analysts, Inc. | 14 703 | 1,15 | 0 | |||||
| 2025-08-15 | 13F | Morgan Stanley | 506 340 | −15,96 | 11 165 | −14,37 | ||||
| 2025-05-12 | 13F | Independent Advisor Alliance | 0 | −100,00 | 0 | |||||
| 2025-08-01 | 13F | MorganRosel Wealth Management, LLC | 5 911 | 0,00 | 130 | 2,36 | ||||
| 2025-08-06 | 13F | Prospera Financial Services Inc | 130 790 | 2,41 | 2 884 | 4,34 | ||||
| 2025-08-06 | 13F | Commonwealth Equity Services, Llc | 95 458 | 24,76 | 2 | 100,00 | ||||
| 2025-07-21 | 13F | Empirical Financial Services, LLC d.b.a. Empirical Wealth Management | 33 891 | 2,64 | 747 | 4,62 | ||||
| 2025-08-14 | 13F | Comerica Bank | 15 260 | −2,40 | 336 | −0,59 | ||||
| 2025-08-07 | 13F | SFE Investment Counsel | 355 613 | 2,05 | 7 841 | 3,99 | ||||
| 2025-07-11 | 13F | Meriwether Wealth & Planning, LLC | 23 005 | 3,93 | 507 | 5,85 | ||||
| 2025-08-05 | 13F | Key FInancial Inc | 18 835 | 41,88 | 415 | 44,60 | ||||
| 2025-07-14 | 13F | Sound Stewardship, LLC | 53 005 | 11,47 | 1 169 | 13,51 | ||||
| 2025-07-31 | 13F | Cambridge Investment Research Advisors, Inc. | 83 117 | 4,18 | 2 | 0,00 | ||||
| 2025-08-18 | 13F | Tyler-Stone Wealth Management | 38 707 | 3,65 | 853 | 5,57 | ||||
| 2025-04-17 | 13F | Missouri Trust & Investment Co | 0 | −100,00 | 0 | |||||
| 2025-04-25 | 13F | Albion Financial Group /ut | 0 | −100,00 | 0 | |||||
| 2025-07-08 | 13F | S.E.E.D. Planning Group LLC | 74 566 | 3,15 | 1 644 | 5,12 | ||||
| 2025-07-24 | 13F | Vantage Point Financial LLC | 46 375 | −1,98 | 1 023 | −0,10 | ||||
| 2025-08-15 | 13F | Captrust Financial Advisors | 259 885 | 6,03 | 5 730 | 8,03 | ||||
| 2025-07-14 | 13F | GAMMA Investing LLC | 4 311 | −92,30 | 95 | −92,15 | ||||
| 2025-08-05 | 13F | Summit Investment Advisory Services, LLC | 112 928 | 2 490 | ||||||
| 2025-08-14 | 13F | UBS Group AG | 391 338 | −15,19 | 8 629 | −13,57 | ||||
| 2025-08-01 | 13F | GPM Growth Investors, Inc. | 210 775 | 11,94 | 4 648 | 14,06 | ||||
| 2025-07-25 | 13F | Cwm, Llc | 0 | −100,00 | 0 | |||||
| 2025-08-01 | 13F | Koss-Olinger Consulting, LLC | 15 643 | −7,43 | 345 | −6,01 | ||||
| 2025-08-04 | 13F | IFG Advisory, LLC | 16 307 | 20,79 | 360 | 22,95 | ||||
| 2025-07-29 | 13F | Alaska Permanent Capital Management | 6 933 | 152 | ||||||
| 2025-08-11 | 13F | Principal Securities, Inc. | 2 926 | 58,76 | 65 | 64,10 | ||||
| 2025-08-14 | 13F | Old Mission Capital Llc | 0 | −100,00 | 0 | |||||
| 2025-08-14 | 13F | Mercer Global Advisors Inc /adv | 341 181 | −2,78 | 7 523 | −0,93 | ||||
| 2025-08-14 | 13F | GWM Advisors LLC | 61 387 | 0,15 | 1 354 | 2,04 | ||||
| 2025-07-23 | 13F | Ironwood Financial, llc | 88 704 | 0,00 | 1 920 | 0,00 | ||||
| 2025-08-04 | 13F | AlphaStar Capital Management, LLC | 16 836 | 1,21 | 371 | 3,34 | ||||
| 2025-07-08 | 13F | Ballew Advisors, Inc | 25 316 | 0,00 | 558 | 4,10 | ||||
| 2025-08-13 | 13F | Brown Advisory Inc | 29 062 | 0,00 | 641 | 1,91 | ||||
| 2025-07-14 | 13F | AdvisorNet Financial, Inc | 28 | 0,00 | 1 | |||||
| 2025-07-29 | 13F | APCM Wealth Management for Individuals | 9 114 | 201 | ||||||
| 2025-08-12 | 13F | SRS Capital Advisors, Inc. | 471 | 10 | ||||||
| 2025-08-13 | 13F | Jones Financial Companies Lllp | 138 195 | 23,01 | 3 035 | 24,70 | ||||
| 2025-08-14 | 13F | Atomi Financial Group, Inc. | 43 273 | 13,51 | 954 | 15,78 | ||||
| 2025-08-07 | 13F | Allworth Financial LP | 300 | 7 | ||||||
| 2025-07-21 | 13F | Ashton Thomas Securities, Llc | 57 764 | 0,38 | 1 274 | 2,25 | ||||
| 2025-08-12 | 13F | Kaye Capital Management | 0 | −100,00 | 0 | |||||
| 2025-08-14 | 13F | Ameriprise Financial Inc | 209 104 | 5,52 | 4 611 | 7,66 | ||||
| 2025-07-18 | 13F | Consolidated Portfolio Review Corp | 42 491 | 8,19 | 937 | 10,25 | ||||
| 2025-08-05 | 13F | Bank Of Montreal /can/ | 0 | −100,00 | 0 | |||||
| 2025-08-14 | 13F | Stifel Financial Corp | 83 155 | 15,18 | 1 834 | 17,35 | ||||
| 2025-07-11 | 13F | Quad-Cities Investment Group, LLC | 9 161 | 202 | ||||||
| 2025-08-14 | 13F | Bank Of America Corp /de/ | 91 342 | 34,77 | 2 014 | 37,38 | ||||
| 2025-07-29 | 13F | Stephens Inc /ar/ | 16 006 | −18,49 | 353 | −16,98 | ||||
| 2025-08-06 | 13F | Summit Investment Advisors, Inc. | 121 173 | 10,19 | 2 662 | 11,99 | ||||
| 2025-08-11 | 13F | Oder Investment Management, LLC | 29 059 | 5,54 | 641 | 7,56 | ||||
| 2025-08-19 | 13F | Asset Dedication, LLC | 4 350 | 96 | ||||||
| 2025-08-11 | 13F | Cornerstone Planning Group LLC | 93 | 2 | ||||||
| 2025-08-14 | 13F | Mml Investors Services, Llc | 124 541 | 18,26 | 3 | 0,00 | ||||
| 2025-08-11 | 13F | Private Advisor Group, LLC | 21 742 | 6,55 | 479 | 8,62 | ||||
| 2025-07-31 | 13F | Strait & Sound Wealth Management LLC | 65 231 | 33,61 | 1 438 | 36,17 | ||||
| 2025-07-31 | 13F | Turning Point Benefit Group, Inc. | 33 075 | 64,45 | 729 | 72,75 | ||||
| 2025-08-08 | 13F | Larson Financial Group LLC | 7 866 | 1,69 | 173 | 3,59 | ||||
| 2025-08-11 | 13F | Shufro Rose & Co Llc | 10 000 | 0,00 | 216 | 0,00 | ||||
| 2025-07-31 | 13F | Carnegie Capital Asset Management, LLC | 14 350 | 316 | ||||||
| 2025-08-06 | 13F | Altrius Capital Management Inc | 30 679 | 50,57 | 676 | 53,64 | ||||
| 2025-07-07 | 13F | Horizons Wealth Management | 3 069 | 0,00 | 68 | 1,52 | ||||
| 2025-07-21 | 13F | Segment Wealth Management, LLC | 52 060 | −1,42 | 1 148 | 0,44 | ||||
| 2025-08-14 | 13F | Raymond James Financial Inc | 156 154 | −47,81 | 3 443 | −46,82 | ||||
| 2025-07-17 | 13F | Wolff Wiese Magana Llc | 1 025 | 48,12 | 23 | 57,14 | ||||
| 2025-05-07 | 13F | Vista Private Wealth Partners. LLC | 0 | −100,00 | 0 | |||||
| 2025-08-11 | 13F | Howard Wealth Management, Llc | 97 735 | −0,53 | 2 155 | 1,36 | ||||
| 2025-08-13 | 13F | Invesco Ltd. | 124 113 | 29,12 | 2 737 | 31,54 | ||||
| 2025-07-15 | 13F | Legacy Financial Group LLC | 27 076 | 6,28 | 597 | 8,35 | ||||
| 2025-08-12 | 13F | LPL Financial LLC | 1 382 592 | 21,46 | 30 486 | 23,76 | ||||
| 2025-04-10 | 13F | Retireful, LLC | 0 | −100,00 | 0 | |||||
| 2025-08-15 | 13F | Equitable Holdings, Inc. | 343 562 | −4,26 | 7 576 | −2,45 | ||||
| 2025-07-29 | 13F | Latitude Advisors, LLC | 10 760 | 237 | ||||||
| 2025-07-18 | 13F | Ledgewood Wealth Advisors, LLC | 17 332 | 0,57 | 382 | 2,69 | ||||
| 2025-08-13 | 13F | MONECO Advisors, LLC | 25 499 | −26,02 | 562 | −24,56 | ||||
| 2025-05-15 | 13F | Ancora Advisors, LLC | 0 | −100,00 | 0 | −100,00 | ||||
| 2025-08-14 | 13F | Guardian Wealth Advisors, Llc / Nc | 450 | 0,00 | 10 | 0,00 | ||||
| 2025-07-25 | 13F | Astoria Portfolio Advisors LLC. | 57 742 | 1,26 | 1 268 | 3,59 | ||||
| 2025-08-06 | 13F | Financial Advisory Corp /ut/ /adv | 199 085 | −1,14 | 4 | 0,00 | ||||
| 2025-07-29 | 13F | Private Trust Co Na | 941 | 159,23 | 21 | 185,71 |