Grundläggande statistik
| Institutionella ägare | 323 total, 321 long only, 0 short only, 2 long/short - change of −6,10% MRQ |
| Genomsnittlig portföljallokering | 0.1123 % - change of −32,23% MRQ |
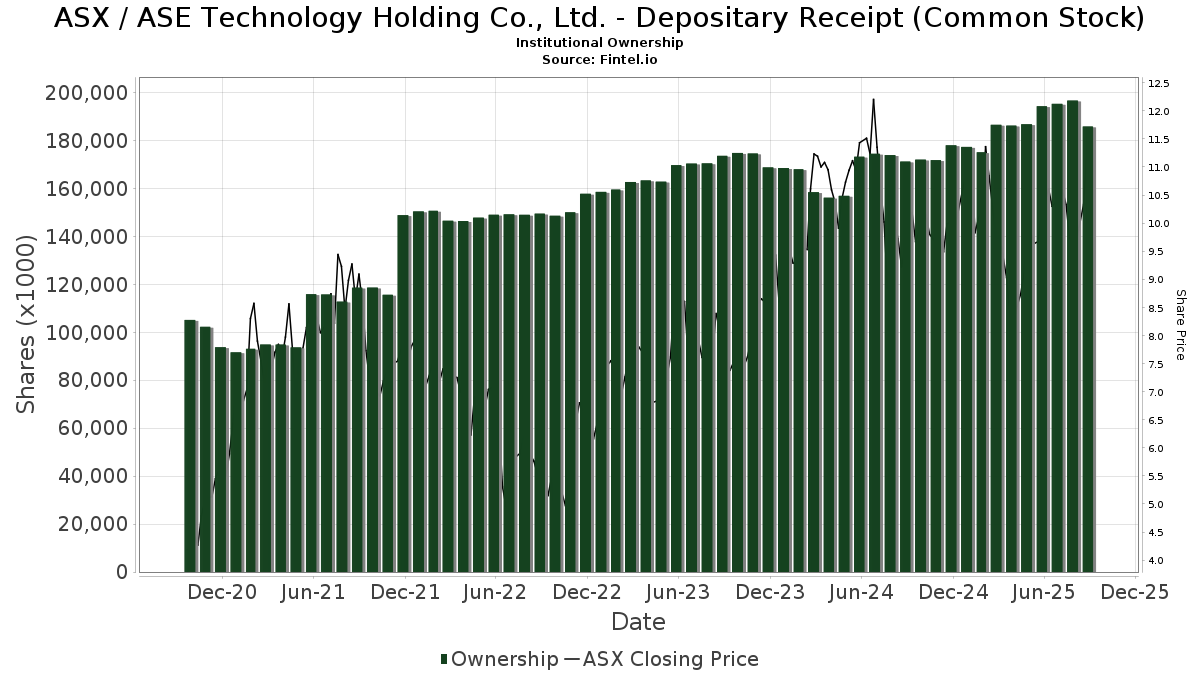
| Institutionella aktier (lång) | 185 802 084 (ex 13D/G) - change of −8,44MM shares −4,35% MRQ |
| Institutionellt värde (lång) | $ 1 579 716 USD ($1000) |
Institutionellt ägande och aktieägare
ASE Technology Holding Co., Ltd. - Depositary Receipt (Common Stock) (US:ASX) har 323 Institutionella ägare och aktieägare som har lämnat in 13D/G- eller 13F-formulär till Securities Exchange Commission (SEC). Dessa institut innehar totalt 185,802,084 aktier. Största aktieägare inkluderar BlackRock, Inc., Lazard Asset Management Llc, Goldman Sachs Group Inc, SOXX - iShares PHLX Semiconductor ETF, UBS Group AG, Morgan Stanley, Bank Of America Corp /de/, Rafferty Asset Management, LLC, SOXL - Direxion Daily Semiconductor Bull 3X Shares, and Schroder Investment Management Group .
ASE Technology Holding Co., Ltd. - Depositary Receipt (Common Stock) (NYSE:ASX) Institutionell ägarstruktur visar institutioners och fonders nuvarande positioner i företaget, samt de senaste förändringarna i positionernas storlek. Större aktieägare kan vara enskilda investerare, fonder, hedgefonder eller institutioner. Bilaga 13D visar att investeraren äger (eller ägde) mer än 5% av företaget och avser (eller avsåg) att aktivt eftersträva en förändring av affärsstrategin. Schedule 13G indikerar en passiv investering på över 5%.
The share price as of September 16, 2025 is 11,30 / share. Previously, on September 17, 2024, the share price was 9,77 / share. This represents an increase of 15,66% over that period.
Fondsentimentets poäng
Fondsentimentet poängen(fka Ägarackumulation-poäng) visar vilka aktier som är mest köpta av fonder. Det är resultatet av en sofistikerad kvantitativ flerfaktormodell som identifierar företag med de högsta nivåerna av institutionell ackumulering. Poängsättningsmodellen använder en kombination av den totala ökningen av redovisade ägare, förändringarna i portföljallokeringarna för dessa ägare och andra mått. Siffran sträcker sig från 0 till 100, där högre siffror indikerar en högre nivå av ackumulering i förhållande till sina konkurrenter, och 50 är genomsnittet.
Uppdateringsfrekvens: Dagligen
Se Ownership Explorer, som innehåller en lista över de högst rankade företagen.
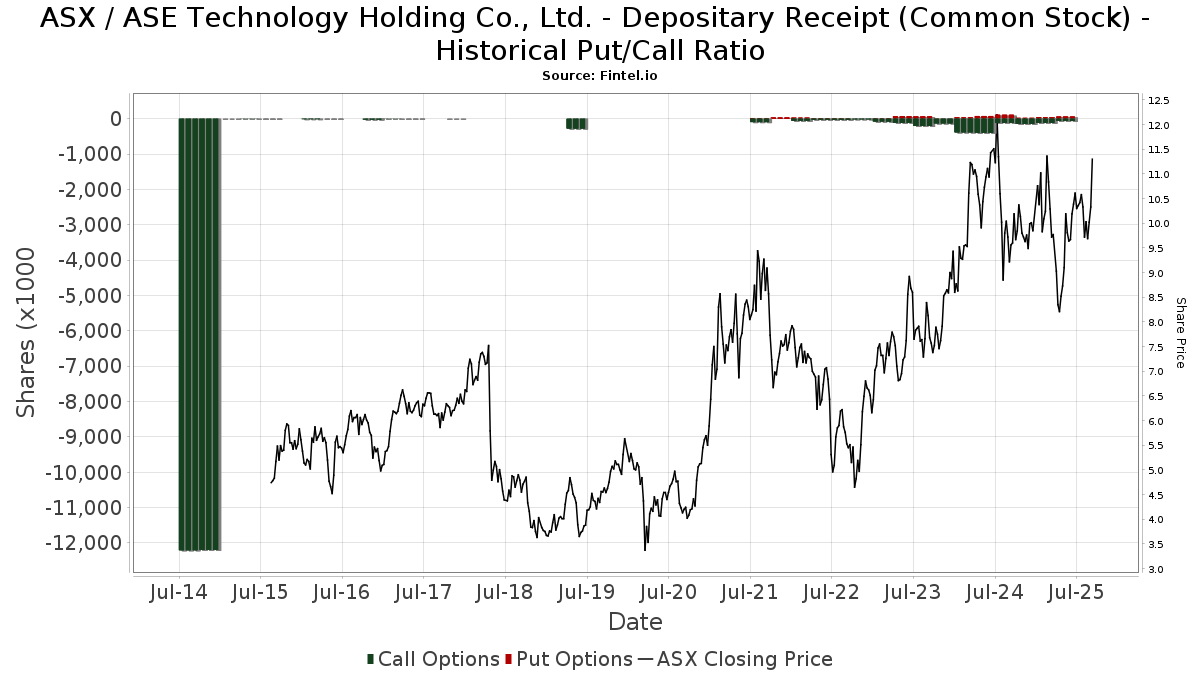
Institutionell sälj/köp-kvot
Förutom att rapportera vanliga eget kapital- och skuldemissioner måste institutioner med mer än 100MM tillgångar under förvaltning också avslöja sina innehav av sälj- och köpoptioner. Eftersom säljoptioner i allmänhet indikerar ett negativt sentiment och köpoptioner indikerar ett positivt sentiment, kan vi få en uppfattning om det övergripande institutionella sentimentet genom att plotta förhållandet mellan säljoptioner och köpoptioner. Diagrammet till höger visar det historiska förhållandet mellan sälj- och köpoptioner för detta instrument.
Genom att använda sälj/köp-kvoten som en indikator på aktieägarnas sentiment undviker man en av de största bristerna med att använda det totala institutionella ägandet, nämligen att en betydande del av de förvaltade tillgångarna investeras passivt för att följa index. Passivt förvaltade fonder köper vanligtvis inte optioner, så indikatorn för sälj/köp-kvoten ger en bättre bild av stämningen i aktivt förvaltade fonder.
13F- och NPORT-arkiveringar
Detaljer om 13F-arkiveringar är gratis. Detaljer om NP-arkiveringar kräver ett premiummedlemskap. Gröna rader indikerar nya positioner. Röda rader indikerar stängda positioner. Klicka på länk symbolen för att se hela transaktionshistoriken.
Uppgradera
för att låsa upp premiumdata och exportera till Excel ![]() .
.
| Fil Datum | Källa | Investerare | Typ | Genomsnittligt pris (beräknat) |
Aktier | Δ Aktier (%) |
Rapporterat värde (1000 USD) |
Δ Värde (%) |
Portföljallokering (%) |
|
|---|---|---|---|---|---|---|---|---|---|---|
| 2025-08-13 | 13F | West Family Investments, Inc. | 47 649 | 71,73 | 492 | 102,47 | ||||
| 2025-08-14 | 13F | Goldman Sachs Group Inc | 11 267 907 | 95,11 | 116 397 | 130,07 | ||||
| 2025-06-30 | NP | AIM INTERNATIONAL MUTUAL FUNDS (INVESCO INTERNATIONAL MUTUAL FUNDS) - Invesco Oppenheimer Global Multi-Asset Growth Fund Class R6 | 5 149 | 26,14 | 45 | 7,32 | ||||
| 2025-07-24 | 13F | Leo Wealth, LLC | 13 721 | 4,53 | 142 | 23,68 | ||||
| 2025-08-12 | 13F | Proequities, Inc. | 0 | 0 | ||||||
| 2025-07-21 | 13F | Mirae Asset Global Investments Co., Ltd. | 70 708 | 1,01 | 730 | 18,51 | ||||
| 2025-04-11 | 13F | First Affirmative Financial Network | 25 507 | 41,21 | 223 | 23,20 | ||||
| 2025-08-07 | 13F | Parkside Financial Bank & Trust | 2 044 | 105,63 | 21 | 162,50 | ||||
| 2025-08-13 | 13F | Congress Wealth Management LLC / DE / | 16 150 | −41,16 | 167 | −30,83 | ||||
| 2025-07-29 | 13F | Regions Financial Corp | 17 942 | 4,41 | 185 | 23,33 | ||||
| 2025-08-14 | 13F | Engineers Gate Manager LP | 0 | −100,00 | 0 | |||||
| 2025-08-26 | NP | Profunds - Profund Vp Emerging Markets | 29 411 | 11,23 | 304 | 31,17 | ||||
| 2025-07-17 | 13F | Greenleaf Trust | 11 801 | 8,78 | 122 | 27,37 | ||||
| 2025-08-14 | 13F | Colony Group, LLC | 15 744 | 5,21 | 163 | 23,66 | ||||
| 2025-08-12 | 13F | Steward Partners Investment Advisory, Llc | 2 817 | 2,40 | 29 | 20,83 | ||||
| 2025-08-14 | 13F | Mercer Global Advisors Inc /adv | 19 179 | −42,70 | 198 | −32,42 | ||||
| 2025-08-14 | 13F | Two Sigma Securities, Llc | 50 459 | 521 | ||||||
| 2025-07-29 | NP | GINX - SGI Enhanced Global Income ETF | 52 912 | −5,75 | 496 | −12,68 | ||||
| 2025-08-14 | 13F | Evergreen Capital Management Llc | 29 934 | 309 | ||||||
| 2025-07-21 | 13F | Qrg Capital Management, Inc. | 47 197 | −42,73 | 488 | −32,45 | ||||
| 2025-08-06 | 13F | Ovata Capital Management Ltd | 601 130 | −50,44 | 6 259 | −40,01 | ||||
| 2025-05-15 | 13F | Glenmede Trust Co Na | 21 380 | −9,05 | 187 | −20,76 | ||||
| 2025-08-14 | 13F | CoreCap Advisors, LLC | 156 | 0,00 | 2 | 0,00 | ||||
| 2025-08-11 | 13F | United Capital Financial Advisers, Llc | 17 394 | 55,85 | 180 | 84,54 | ||||
| 2025-08-26 | 13F/A | Thrivent Financial For Lutherans | 0 | −100,00 | 0 | |||||
| 2025-08-13 | 13F | Northern Trust Corp | 1 216 077 | 29,39 | 12 562 | 52,58 | ||||
| 2025-04-21 | 13F | Envestnet Portfolio Solutions, Inc. | 0 | −100,00 | 0 | |||||
| 2025-06-26 | NP | EMQAX - Ashmore Emerging Markets Active Equity Fund CLASS A | 32 500 | 42,54 | 284 | 22,51 | ||||
| 2025-07-11 | 13F | Caldwell Securities, Inc | 666 | 0,00 | 7 | 20,00 | ||||
| 2025-08-14 | 13F | Henry James International Management Inc. | 18 404 | 0,83 | 190 | 19,50 | ||||
| 2025-05-15 | 13F/A | Orion Portfolio Solutions, LLC | 143 445 | −22,47 | 1 257 | −32,58 | ||||
| 2025-03-28 | NP | HTECX - Hennessy Technology Fund Investor Class | 12 837 | 0,00 | 130 | 6,56 | ||||
| 2025-08-13 | 13F | Mount Yale Investment Advisors, LLC | 7 074 | 73 | ||||||
| 2025-07-31 | 13F | Oppenheimer Asset Management Inc. | 648 743 | 60,53 | 6 702 | 89,29 | ||||
| 2025-08-07 | 13F | McClarren Financial Advisors, Inc. | 0 | −100,00 | 0 | |||||
| 2025-08-13 | 13F | Amundi | 171 930 | 0,00 | 1 771 | 25,62 | ||||
| 2025-07-28 | NP | AVEM - Avantis Emerging Markets Equity ETF This fund is a listed as child fund of American Century Companies Inc and if that institution has disclosed ownership in this security, then these positions will not be double counted when calculating total shares and total value | 2 726 866 | 22,91 | 25 578 | 13,81 | ||||
| 2025-08-04 | 13F | Atria Investments Llc | 53 137 | 10,12 | 549 | 29,86 | ||||
| 2025-08-14 | 13F | Quantinno Capital Management LP | 265 369 | 30,80 | 2 741 | 54,25 | ||||
| 2025-08-14 | 13F/A | Skopos Labs, Inc. | 29 788 | 289,39 | 308 | 358,21 | ||||
| 2025-07-14 | 13F | Armstrong Advisory Group, Inc | 340 | 4 | ||||||
| 2025-08-14 | 13F | Xponance, Inc. | 16 602 | 1,11 | 171 | 19,58 | ||||
| 2025-07-28 | 13F | Ritholtz Wealth Management | 45 622 | −64,53 | 471 | −58,17 | ||||
| 2025-08-07 | 13F | Americana Partners, LLC | 17 009 | 14,89 | 176 | 35,66 | ||||
| 2025-07-30 | 13F | Drive Wealth Management, Llc | 14 789 | −3,79 | 153 | 13,43 | ||||
| 2025-07-22 | 13F | Fortitude Advisory Group L.L.C. | 24 988 | 258 | ||||||
| 2025-07-14 | 13F | Abound Wealth Management | 90 | 0,00 | 1 | |||||
| 2025-06-23 | NP | UUPIX - Ultraemerging Markets Profund Investor Class | 7 090 | 9,26 | 62 | −6,15 | ||||
| 2025-08-06 | 13F | Commonwealth Equity Services, Llc | 11 255 | −16,33 | 0 | |||||
| 2025-08-12 | 13F | Enterprise Financial Services Corp | 10 098 | 104 | ||||||
| 2025-08-05 | 13F | Simplex Trading, Llc | 0 | −100,00 | 0 | |||||
| 2025-08-06 | 13F | Savant Capital, LLC | 33 576 | 60,47 | 347 | 89,07 | ||||
| 2025-08-11 | 13F | Principal Securities, Inc. | 1 297 | −50,68 | 13 | −50,00 | ||||
| 2025-08-07 | 13F | Connor, Clark & Lunn Investment Management Ltd. | 208 518 | 2 154 | ||||||
| 2025-08-14 | 13F | Smartleaf Asset Management LLC | 147 | 0,00 | 2 | 0,00 | ||||
| 2025-07-28 | NP | AVSE - Avantis Responsible Emerging Markets Equity ETF | 22 164 | 13,25 | 208 | 4,55 | ||||
| 2025-08-14 | 13F | Nomura Holdings Inc | 0 | −100,00 | 0 | |||||
| 2025-08-14 | 13F | Farringdon Capital, Ltd. | 37 289 | 385 | ||||||
| 2025-08-15 | 13F | CI Private Wealth, LLC | 167 199 | 4,89 | 1 727 | 23,71 | ||||
| 2025-08-14 | 13F | GWM Advisors LLC | 13 234 | 6,09 | 137 | 24,77 | ||||
| 2025-08-04 | 13F | Assetmark, Inc | 3 593 | 14,50 | 37 | 37,04 | ||||
| 2025-08-13 | 13F | Quantbot Technologies LP | 114 592 | 1 184 | ||||||
| 2025-08-13 | 13F | NINE MASTS CAPITAL Ltd | 652 368 | −60,93 | 6 739 | −53,93 | ||||
| 2025-07-18 | 13F | Ninety One North America, Inc. | 272 528 | −6,49 | 2 815 | 10,31 | ||||
| 2025-08-12 | 13F | Aigen Investment Management, Lp | 125 835 | 1 300 | ||||||
| 2025-08-08 | 13F | Larson Financial Group LLC | 276 922 | 7,75 | 2 861 | 27,05 | ||||
| 2025-06-26 | NP | DFAX - Dimensional World ex U.S. Core Equity 2 ETF | 79 484 | 0,00 | 694 | −14,02 | ||||
| 2025-08-12 | 13F | XTX Topco Ltd | 313 152 | 3 235 | ||||||
| 2025-08-14 | 13F | Verition Fund Management LLC | 596 918 | −63,88 | 6 166 | −57,40 | ||||
| 2025-07-09 | 13F | Aaron Wealth Advisors LLC | 30 584 | 11,67 | 316 | 31,80 | ||||
| 2025-05-01 | 13F | Schechter Investment Advisors, LLC | 24 990 | −28,94 | 219 | −38,42 | ||||
| 2025-07-28 | 13F | Moran Wealth Management, LLC | 563 171 | 4,37 | 5 818 | 23,09 | ||||
| 2025-08-13 | 13F | Kilter Group LLC | 280 | 3 | ||||||
| 2025-07-21 | 13F | Hennessy Advisors Inc | 0 | −100,00 | 0 | |||||
| 2025-08-14 | 13F | Aprio Wealth Management, LLC | 0 | −100,00 | 0 | |||||
| 2025-05-15 | 13F | MIRAE ASSET GLOBAL ETFS HOLDINGS Ltd. | 0 | −100,00 | 0 | |||||
| 2025-07-17 | 13F | HB Wealth Management, LLC | 14 494 | 9,78 | 150 | 29,57 | ||||
| 2025-08-14 | 13F | Atomi Financial Group, Inc. | 31 888 | −22,83 | 329 | −8,86 | ||||
| 2025-07-28 | NP | ZEMRX - American Beacon Ninety One Emerging Markets Equity Fund R6 Class | 0 | −100,00 | 0 | −100,00 | ||||
| 2025-08-13 | 13F | Capula Management Ltd | 216 529 | −91,44 | 2 237 | −89,91 | ||||
| 2025-08-07 | 13F | Campbell & CO Investment Adviser LLC | 648 867 | 6 703 | ||||||
| 2025-08-13 | 13F | Townsquare Capital Llc | 0 | −100,00 | 0 | |||||
| 2025-08-07 | 13F | Acadian Asset Management Llc | 4 838 224 | −55,91 | 50 | −48,96 | ||||
| 2025-08-11 | 13F | Inspire Advisors, LLC | 13 904 | 5,41 | 144 | 24,35 | ||||
| 2025-08-14 | 13F/A | Rockefeller Capital Management L.P. | 58 993 | −0,13 | 609 | 17,79 | ||||
| 2025-08-13 | 13F | First Trust Advisors Lp | 82 000 | −12,17 | 847 | 3,67 | ||||
| 2025-08-14 | 13F | Capitolis Liquid Global Markets LLC | 0 | −100,00 | 0 | |||||
| 2025-07-17 | 13F | Beacon Capital Management, LLC | 0 | −100,00 | 0 | |||||
| 2025-08-11 | 13F | Pinnacle Wealth Planning Services, Inc. | 24 571 | −20,02 | 254 | −5,95 | ||||
| 2025-07-23 | 13F | High Note Wealth, LLC | 17 | 0,00 | 0 | |||||
| 2025-08-14 | 13F/A | Barclays Plc | 4 630 649 | 43,66 | 48 | 67,86 | ||||
| 2025-07-24 | 13F | Ronald Blue Trust, Inc. | 85 122 | 28,96 | 879 | 52,08 | ||||
| 2025-07-21 | 13F | Ascent Group, LLC | 17 370 | 9,99 | 179 | 29,71 | ||||
| 2025-07-16 | 13F | Highline Wealth Partners Llc | 634 | 291,36 | 7 | 500,00 | ||||
| 2025-07-31 | 13F | Glass Jacobson Investment Advisors llc | 0 | −100,00 | 0 | |||||
| 2025-08-01 | 13F | Ashton Thomas Private Wealth, LLC | 0 | −100,00 | 0 | |||||
| 2025-08-08 | 13F | Hartland & Co., LLC | 715 | 0,00 | 7 | 16,67 | ||||
| 2025-08-14 | 13F | Raymond James Financial Inc | 154 915 | 39,01 | 1 600 | 63,93 | ||||
| 2025-07-30 | 13F | Eqis Capital Management, Inc. | 40 219 | 3,37 | 415 | 22,06 | ||||
| 2025-08-08 | 13F | Geode Capital Management, Llc | 13 576 | 16,28 | 140 | 37,25 | ||||
| 2025-07-25 | 13F | Allspring Global Investments Holdings, LLC | 17 675 | −90,02 | 181 | −88,62 | ||||
| 2025-07-14 | 13F | Park Avenue Securities Llc | 36 688 | −6,75 | 0 | |||||
| 2025-07-28 | NP | NSI - National Security Emerging Markets Index ETF | 20 545 | 38,49 | 193 | 28,00 | ||||
| 2025-07-29 | 13F | Private Trust Co Na | 246 | 0,00 | 3 | 0,00 | ||||
| 2025-08-05 | 13F | Tiaa Trust, National Association | 0 | −100,00 | 0 | |||||
| 2025-08-08 | 13F | Avantax Advisory Services, Inc. | 173 850 | −4,85 | 1 796 | 12,19 | ||||
| 2025-07-30 | 13F | Legacy Wealth Asset Management, LLC | 253 165 | −3,08 | 2 615 | 14,29 | ||||
| 2025-07-30 | 13F | Whittier Trust Co | 1 302 | 13 | ||||||
| 2025-08-14 | 13F | DZ BANK AG Deutsche Zentral Genossenschafts Bank, Frankfurt am Main | 0 | −100,00 | 0 | |||||
| 2025-08-12 | 13F | Atlas Capital Advisors Llc | 14 385 | 0,00 | 149 | 17,46 | ||||
| 2025-08-13 | 13F | Blueshift Asset Management, LLC | 0 | −100,00 | 0 | |||||
| 2025-06-26 | NP | DFSE - Dimensional Emerging Markets Sustainability Core 1 ETF | 4 870 | 0,00 | 43 | −14,29 | ||||
| 2025-08-14 | 13F | UBS Group AG | 9 668 039 | −44,33 | 99 871 | −34,35 | ||||
| 2025-08-14 | 13F | Sei Investments Co | 501 024 | 1,54 | 5 176 | 19,74 | ||||
| 2025-08-14 | 13F | Qube Research & Technologies Ltd | 0 | −100,00 | 0 | |||||
| 2025-08-07 | 13F | Legacy Financial Advisors, Inc. | 0 | −100,00 | 0 | |||||
| 2025-05-15 | 13F | Capstone Investment Advisors, Llc | 0 | −100,00 | 0 | |||||
| 2025-08-06 | 13F | First Horizon Advisors, Inc. | 164 | 2 | ||||||
| 2025-05-13 | 13F | Arrowpoint Investment Partners (Singapore) Pte. Ltd. | 0 | −100,00 | 0 | |||||
| 2025-08-13 | 13F | M&t Bank Corp | 12 932 | −7,71 | 134 | 9,02 | ||||
| 2025-08-14 | 13F | Balyasny Asset Management Llc | 197 725 | 28,15 | 2 042 | 51,15 | ||||
| 2025-08-13 | 13F | Victory Capital Management Inc | 145 409 | 0,00 | 1 502 | 17,99 | ||||
| 2025-08-14 | 13F | Jane Street Group, Llc | 317 000 | −78,18 | 3 275 | −74,28 | ||||
| 2025-08-14 | 13F | Glenmede Investment Management, LP | 23 265 | 240 | ||||||
| 2025-07-28 | 13F | BRYN MAWR TRUST Co | 7 537 | −3,90 | 78 | 13,24 | ||||
| 2025-08-14 | 13F | Group One Trading, L.p. | 0 | −100,00 | 0 | |||||
| 2025-04-18 | 13F | Rakuten Securities, Inc. | 0 | −100,00 | 0 | |||||
| 2025-08-04 | 13F | Haven Private, LLC | 12 017 | 124 | ||||||
| 2025-07-25 | 13F | We Are One Seven, LLC | 10 034 | −7,44 | 104 | 9,57 | ||||
| 2025-08-14 | 13F | Citadel Advisors Llc | 1 953 895 | 130,26 | 20 184 | 171,53 | ||||
| 2025-08-08 | 13F | Cetera Investment Advisers | 29 923 | 1,17 | 309 | 19,31 | ||||
| 2025-04-28 | 13F | Fedenia Advisers LLC | 0 | −100,00 | 0 | |||||
| 2025-08-04 | 13F | Simon Quick Advisors, Llc | 13 316 | 138 | ||||||
| 2025-08-14 | 13F | Millennium Management Llc | 1 372 910 | −64,21 | 14 182 | −57,80 | ||||
| 2025-07-01 | 13F | Confluence Investment Management Llc | 18 063 | −6,58 | 187 | 10,06 | ||||
| 2025-07-30 | 13F | Ethic Inc. | 380 595 | 6,28 | 4 030 | 25,19 | ||||
| 2025-05-05 | 13F | Eagle Bay Advisors LLC | 0 | −100,00 | 0 | −100,00 | ||||
| 2025-08-14 | 13F | Citadel Advisors Llc | Put | 14 200 | −58,60 | 147 | −51,33 | |||
| 2025-08-14 | 13F | Susquehanna International Group, Llp | 72 546 | −86,99 | 749 | −84,67 | ||||
| 2025-08-05 | 13F | Cambiar Investors Llc | 16 700 | 0,00 | 173 | 17,81 | ||||
| 2025-08-14 | 13F | Susquehanna International Group, Llp | Put | 49 100 | 507 | |||||
| 2025-08-14 | 13F | Susquehanna International Group, Llp | Call | 60 700 | 299,34 | 627 | 371,43 | |||
| 2025-08-13 | 13F | Guggenheim Capital Llc | 292 714 | 1,85 | 3 024 | 20,10 | ||||
| 2025-08-14 | 13F | Axa S.a. | 137 865 | 0,00 | 1 424 | 17,98 | ||||
| 2025-08-13 | 13F | Healthcare Of Ontario Pension Plan Trust Fund | 543 800 | 5 617 | ||||||
| 2025-07-14 | 13F | GAMMA Investing LLC | 25 149 | 35,76 | 260 | 59,88 | ||||
| 2025-08-14 | 13F | Headlands Technologies LLC | 5 153 | 549,81 | 53 | 783,33 | ||||
| 2025-08-14 | 13F | Cubist Systematic Strategies, LLC | 642 014 | 6 632 | ||||||
| 2025-08-14 | 13F | Point72 Asia (Singapore) Pte. Ltd. | 209 419 | 2 163 | ||||||
| 2025-07-11 | 13F | Grove Bank & Trust | 13 767 | 0,00 | 142 | 18,33 | ||||
| 2025-08-07 | 13F | Resources Investment Advisors, LLC. | 18 831 | −0,77 | 195 | 16,87 | ||||
| 2025-08-13 | 13F | EverSource Wealth Advisors, LLC | 22 694 | 29,87 | 234 | 52,94 | ||||
| 2025-07-14 | 13F | Abacus Wealth Partners, LLC | 11 781 | 122 | ||||||
| 2025-08-05 | 13F | GPS Wealth Strategies Group, LLC | 1 125 | 0,00 | 12 | 22,22 | ||||
| 2025-07-30 | 13F | Princeton Global Asset Management LLC | 301 | 3 | ||||||
| 2025-08-05 | 13F | Bank of New York Mellon Corp | 160 161 | 6,47 | 1 654 | 25,59 | ||||
| 2025-07-18 | 13F | Union Bancaire Privee, UBP SA | 1 446 | 0,00 | 15 | 25,00 | ||||
| 2025-08-05 | 13F | Bridgewater Advisors Inc. | 25 284 | 1,00 | 265 | 21,66 | ||||
| 2025-08-01 | 13F | Y-Intercept (Hong Kong) Ltd | 778 353 | 8 040 | ||||||
| 2025-05-09 | 13F | R Squared Ltd | 0 | −100,00 | 0 | −100,00 | ||||
| 2025-08-14 | 13F | Ieq Capital, Llc | 60 578 | 146,11 | 626 | 190,70 | ||||
| 2025-07-09 | 13F | Sivia Capital Partners, LLC | 27 026 | −14,80 | 279 | 0,72 | ||||
| 2025-08-12 | 13F | Franklin Resources Inc | 17 109 | −8,14 | 177 | 7,98 | ||||
| 2025-09-05 | 13F | Abn Amro Investment Solutions | 0 | −100,00 | 0 | −100,00 | ||||
| 2025-08-15 | 13F | Binnacle Investments Inc | 1 065 | 1,62 | 11 | 22,22 | ||||
| 2025-07-14 | 13F | UMA Financial Services, Inc. | 193 | 153,95 | 2 | |||||
| 2025-05-06 | 13F | Venturi Wealth Management, LLC | 0 | −100,00 | 0 | |||||
| 2025-07-22 | 13F | Merit Financial Group, LLC | 42 880 | 47,36 | 443 | 74,02 | ||||
| 2025-08-27 | 13F/A | Squarepoint Ops LLC | 89 782 | −81,83 | 927 | −78,58 | ||||
| 2025-07-30 | 13F | Bogart Wealth, LLC | 139 | 0,00 | 1 | 0,00 | ||||
| 2025-05-14 | 13F | Truvestments Capital Llc | 0 | −100,00 | 0 | |||||
| 2025-05-15 | 13F | CAPROCK Group, Inc. | 82 441 | −1,74 | 722 | −14,45 | ||||
| 2025-07-16 | 13F | Pictet & Cie (Europe) SA | 130 849 | −2,00 | 1 352 | 15,57 | ||||
| 2025-08-13 | 13F | Walleye Capital LLC | 0 | −100,00 | 0 | |||||
| 2025-08-28 | NP | JINTX - Johnson International Fund | 24 000 | 0,00 | 248 | 17,62 | ||||
| 2025-08-07 | 13F | Profund Advisors Llc | 86 291 | 3,17 | 891 | 21,72 | ||||
| 2025-05-22 | NP | QSPIX - AQR Style Premia Alternative Fund Class I | 32 291 | −34,70 | 283 | −43,26 | ||||
| 2025-08-14 | 13F | Boston Private Wealth Llc | 0 | −100,00 | 0 | −100,00 | ||||
| 2025-06-27 | NP | SOXY - YieldMax(TM) Target 12(TM) Semiconductor Option Income ETF | 3 807 | 24,98 | 33 | 10,00 | ||||
| 2025-08-15 | 13F | WealthCollab, LLC | 4 850 | 55,25 | 50 | 85,19 | ||||
| 2025-08-25 | 13F/A | Neuberger Berman Group LLC | 187 596 | 55,22 | 1 938 | 83,08 | ||||
| 2025-05-15 | 13F | Federation des caisses Desjardins du Quebec | 0 | −100,00 | 0 | |||||
| 2025-08-14 | 13F | Peak6 Llc | Call | 0 | −100,00 | 0 | ||||
| 2025-04-21 | 13F | Nelson, Van Denburg & Campbell Wealth Management Group, LLC | 0 | −100,00 | 0 | |||||
| 2025-07-24 | 13F | Callan Family Office, LLC | 39 487 | 408 | ||||||
| 2025-08-14 | 13F | Integrated Wealth Concepts LLC | 14 591 | 151 | ||||||
| 2025-05-01 | 13F | Bleakley Financial Group, LLC | 0 | −100,00 | 0 | |||||
| 2025-07-23 | 13F | Capital Management Associates, Inc | 0 | −100,00 | 0 | |||||
| 2025-08-13 | 13F | Fisher Asset Management, LLC | 4 662 068 | −51,29 | 48 159 | −42,56 | ||||
| 2025-08-14 | 13F | Aqr Capital Management Llc | 10 292 | −79,56 | 106 | −75,96 | ||||
| 2025-05-19 | 13F/A | Jane Street Group, Llc | Call | 0 | −100,00 | 0 | −100,00 | |||
| 2025-07-17 | 13F | CogentBlue Wealth Advisors, LLC | 0 | −100,00 | 0 | |||||
| 2025-08-15 | 13F | Earnest Partners Llc | 3 534 584 | 8,52 | 36 512 | 27,97 | ||||
| 2025-09-04 | 13F/A | Advisor Group Holdings, Inc. | 17 987 | 43,78 | 185 | 69,72 | ||||
| 2025-07-07 | 13F | Delphi Management Inc /ma/ | 131 950 | 1 | ||||||
| 2025-08-07 | 13F | Sierra Ocean, Llc | 0 | −100,00 | 0 | |||||
| 2025-07-24 | 13F | IFP Advisors, Inc | 456 | 12,87 | 5 | 33,33 | ||||
| 2025-08-14 | 13F | Banque Transatlantique SA | 0 | −100,00 | 0 | |||||
| 2025-08-12 | 13F | Trexquant Investment LP | 299 001 | 3 089 | ||||||
| 2025-07-25 | 13F | Johnson Investment Counsel Inc | 24 650 | 0,00 | 255 | 18,14 | ||||
| 2025-08-14 | 13F | Aspen Grove Capital, LLC | 33 536 | 0,00 | 346 | 18,09 | ||||
| 2025-07-14 | 13F | AdvisorNet Financial, Inc | 0 | −100,00 | 0 | |||||
| 2025-08-13 | 13F | Mirabella Financial Services Llp | 0 | −100,00 | 0 | |||||
| 2025-08-11 | 13F | Dorsey & Whitney Trust CO LLC | 13 088 | 1,40 | 135 | 19,47 | ||||
| 2025-08-07 | 13F | Allworth Financial LP | 4 706 | 9,90 | 49 | 29,73 | ||||
| 2025-08-12 | 13F | SRS Capital Advisors, Inc. | 4 637 | 48 | ||||||
| 2025-07-22 | 13F | LGT Fund Management Co Ltd. | 0 | −100,00 | 0 | |||||
| 2025-08-13 | 13F | Jump Financial, LLC | 1 366 018 | 897,46 | 14 111 | 1 076,81 | ||||
| 2025-08-13 | 13F | Cerity Partners LLC | 185 811 | −31,50 | 1 919 | −19,23 | ||||
| 2025-07-10 | 13F | TT International Asset Management LTD | 883 968 | 19 539,37 | 9 131 | 23 312,82 | ||||
| 2025-04-23 | 13F | Perigon Wealth Management, LLC | 0 | −100,00 | 0 | |||||
| 2025-08-11 | 13F | Vanguard Group Inc | 1 713 966 | 11,71 | 17 705 | 31,73 | ||||
| 2025-08-12 | 13F | Dimensional Fund Advisors Lp | 861 572 | 16,86 | 8 900 | 37,81 | ||||
| 2025-08-14 | 13F | Peak6 Llc | Put | 0 | −100,00 | 0 | ||||
| 2025-08-08 | 13F | Pnc Financial Services Group, Inc. | 103 520 | 21,78 | 1 069 | 43,68 | ||||
| 2025-08-14 | 13F | Point72 Asset Management, L.P. | 1 651 300 | 17 058 | ||||||
| 2025-05-05 | 13F | Transce3nd, LLC | 0 | −100,00 | 0 | |||||
| 2025-08-01 | 13F | Jennison Associates Llc | 0 | −100,00 | 0 | |||||
| 2025-07-15 | 13F | Maseco Llp | 994 | 10 | ||||||
| 2025-07-30 | 13F | Rehmann Capital Advisory Group | 11 128 | 9,58 | 115 | 29,55 | ||||
| 2025-08-12 | 13F | Rhumbline Advisers | 627 761 | −3,67 | 6 485 | 13,59 | ||||
| 2025-07-28 | NP | AVXC - Avantis Emerging Markets ex-China Equity ETF | 29 051 | 37,48 | 272 | 27,10 | ||||
| 2025-08-12 | 13F | Coldstream Capital Management Inc | 48 009 | 203,30 | 496 | 258,70 | ||||
| 2025-08-14 | 13F | Riggs Asset Managment Co. Inc. | 222 | 2 | ||||||
| 2025-08-11 | 13F | HighTower Advisors, LLC | 35 760 | 5,53 | 369 | 24,66 | ||||
| 2025-07-18 | 13F | Ninety One UK Ltd | 126 345 | −1,53 | 1 305 | 16,21 | ||||
| 2025-08-28 | NP | SOXX - iShares PHLX Semiconductor ETF | 10 072 255 | 1,04 | 104 046 | 19,15 | ||||
| 2025-08-13 | 13F | Custom Index Systems, Llc | 0 | −100,00 | 0 | |||||
| 2025-07-24 | 13F | Ramirez Asset Management, Inc. | 415 180 | 60,24 | 4 289 | 88,98 | ||||
| 2025-08-05 | 13F | Claro Advisors LLC | 0 | −100,00 | 0 | |||||
| 2025-08-06 | 13F | Vestmark Advisory Solutions, Inc. | 0 | −100,00 | 0 | |||||
| 2025-08-11 | 13F | TD Waterhouse Canada Inc. | 0 | −100,00 | 0 | |||||
| 2025-08-13 | 13F | Marshall Wace, Llp | 0 | −100,00 | 0 | |||||
| 2025-08-14 | 13F | Wells Fargo & Company/mn | 1 147 479 | 20,24 | 11 853 | 41,80 | ||||
| 2025-07-25 | 13F | Yousif Capital Management, Llc | 34 577 | 4,76 | 357 | 23,53 | ||||
| 2025-03-31 | NP | AEMGX - Acadian Emerging Markets Portfolio Investor Class Shares | 53 878 | 87,43 | 547 | 99,27 | ||||
| 2025-04-23 | 13F | Continuum Advisory, LLC | 0 | −100,00 | 0 | |||||
| 2025-08-13 | 13F | Jones Financial Companies Lllp | 12 277 | 25,63 | 130 | 51,76 | ||||
| 2025-08-04 | 13F | Hantz Financial Services, Inc. | 18 094 | 3 929,84 | 0 | |||||
| 2025-06-30 | NP | VMNVX - Vanguard Global Minimum Volatility Fund Admiral Shares | 1 537 032 | 10,96 | 13 418 | −4,57 | ||||
| 2025-04-23 | 13F | Pinnacle Bancorp, Inc. | 0 | −100,00 | 0 | |||||
| 2025-08-13 | 13F | Quadrant Capital Group Llc | 219 530 | 339,64 | 2 268 | 418,76 | ||||
| 2025-08-13 | 13F | Hsbc Holdings Plc | 1 793 840 | 114,73 | 18 549 | 153,56 | ||||
| 2025-05-13 | 13F | Mondrian Investment Partners LTD | 5 461 | 4,66 | 48 | −9,62 | ||||
| 2025-08-12 | 13F | CIBC Private Wealth Group, LLC | 924 | −82,18 | 10 | −76,32 | ||||
| 2025-07-15 | 13F | Ballentine Partners, LLC | 114 071 | 66,12 | 1 178 | 96,01 | ||||
| 2025-08-14 | 13F | Polymer Capital Management (HK) LTD | 0 | −100,00 | 0 | |||||
| 2025-08-14 | 13F | Two Sigma Advisers, Lp | 178 100 | −4,81 | 1 840 | 12,27 | ||||
| 2025-08-11 | 13F | Frank, Rimerman Advisors LLC | 36 130 | 373 | ||||||
| 2025-08-12 | 13F | O'shaughnessy Asset Management, Llc | 197 220 | −54,09 | 2 037 | −45,87 | ||||
| 2025-07-28 | 13F | Kiker Wealth Management, LLC | 48 250 | −3,94 | 498 | 13,18 | ||||
| 2025-05-15 | 13F | Optiver Holding B.V. | 0 | −100,00 | 0 | |||||
| 2025-05-16 | 13F/A | Kestra Investment Management, LLC | 0 | −100,00 | 0 | |||||
| 2025-07-15 | 13F | Public Employees Retirement System Of Ohio | 5 120 | −75,45 | 53 | −71,43 | ||||
| 2025-08-12 | 13F | Journey Strategic Wealth Llc | 13 921 | 21,51 | 144 | 43,00 | ||||
| 2025-08-13 | 13F | Federated Hermes, Inc. | 104 136 | 0,00 | 1 076 | 17,87 | ||||
| 2025-07-31 | 13F | Buckingham Strategic Partners | 0 | −100,00 | 0 | |||||
| 2025-08-12 | 13F | Advisors Asset Management, Inc. | 141 407 | −1,19 | 1 461 | 16,52 | ||||
| 2025-08-11 | 13F | B. Metzler seel. Sohn & Co. AG | 130 100 | 0,00 | 1 344 | 17,91 | ||||
| 2025-08-27 | NP | Advanced Series Trust - Ast Academic Strategies Asset Allocation Portfolio | 0 | −100,00 | 0 | −100,00 | ||||
| 2025-08-27 | NP | Advanced Series Trust - Ast Advanced Strategies Portfolio | 0 | −100,00 | 0 | −100,00 | ||||
| 2025-08-14 | 13F | Citadel Advisors Llc | Call | 0 | −100,00 | 0 | −100,00 | |||
| 2025-08-08 | 13F | Wealth Alliance | 27 827 | 1,58 | 287 | 20,08 | ||||
| 2025-08-11 | 13F | WPG Advisers, LLC | 451 | −46,75 | 5 | −42,86 | ||||
| 2025-08-27 | NP | Advanced Series Trust - Ast Capital Growth Asset Allocation Portfolio | 0 | −100,00 | 0 | −100,00 | ||||
| 2025-08-27 | NP | Advanced Series Trust - Ast Balanced Asset Allocation Portfolio | 0 | −100,00 | 0 | −100,00 | ||||
| 2025-08-27 | NP | Advanced Series Trust - Ast Prudential Growth Allocation Portfolio | 0 | −100,00 | 0 | −100,00 | ||||
| 2025-07-08 | 13F | Parallel Advisors, LLC | 16 529 | −32,37 | 171 | −20,56 | ||||
| 2025-08-13 | 13F | Schroder Investment Management Group | 5 245 480 | 6,70 | 54 186 | 25,25 | ||||
| 2025-07-29 | NP | RBB FUND, INC. - Aquarius International Fund | 6 033 | 0,00 | 57 | −8,20 | ||||
| 2025-06-26 | NP | DFEV - Dimensional Emerging Markets Value ETF | 111 421 | 12,65 | 973 | −3,09 | ||||
| 2025-08-14 | 13F | Aquatic Capital Management LLC | 1 192 128 | 12 315 | ||||||
| 2025-08-13 | 13F | Thornburg Investment Management Inc | 23 104 | −69,77 | 239 | −96,44 | ||||
| 2025-08-14 | 13F | Rafferty Asset Management, LLC | 7 392 190 | 50,85 | 76 361 | 77,89 | ||||
| 2025-08-14 | 13F | Warren Averett Asset Management, LLC | 18 299 | 0,00 | 189 | 18,13 | ||||
| 2025-08-04 | 13F | Migdal Insurance & Financial Holdings Ltd. | 0 | −100,00 | 0 | |||||
| 2025-07-18 | 13F | Truist Financial Corp | 13 366 | −7,86 | 138 | 8,66 | ||||
| 2025-08-26 | NP | Profunds - Profund Vp Asia 30 | 45 931 | −7,23 | 474 | 9,47 | ||||
| 2025-08-15 | 13F | Kestra Advisory Services, LLC | 15 424 | −3,55 | 159 | 13,57 | ||||
| 2025-08-13 | 13F | Rsm Us Wealth Management Llc | 13 158 | 14,22 | 136 | 35,00 | ||||
| 2025-08-08 | 13F | Abc Arbitrage Sa | 0 | −100,00 | 0 | |||||
| 2025-07-14 | 13F | Foster Group, Inc. | 13 997 | 145 | ||||||
| 2025-08-04 | 13F | Arkadios Wealth Advisors | 10 425 | −10,25 | 108 | 5,94 | ||||
| 2025-07-14 | 13F | U.S. Capital Wealth Advisors, LLC | 17 998 | 0,00 | 186 | 17,83 | ||||
| 2025-08-13 | 13F | Hel Ved Capital Management Ltd | 0 | −100,00 | 0 | |||||
| 2025-06-26 | NP | SGIDX - Steward Global Equity Income Fund Class A | 798 026 | 5,72 | 6 967 | −9,07 | ||||
| 2025-08-01 | 13F | Envestnet Asset Management Inc | 2 437 846 | 4,52 | 25 183 | 23,25 | ||||
| 2025-06-26 | NP | SNTKX - Steward International Enhanced Index Fund Class A | 57 146 | 0,00 | 499 | −14,14 | ||||
| 2025-07-16 | 13F | Signaturefd, Llc | 78 281 | 16,56 | 809 | 37,41 | ||||
| 2025-07-25 | 13F | Cwm, Llc | 16 740 | 0,30 | 0 | |||||
| 2025-08-05 | 13F | Huntington National Bank | 752 | −2,46 | 8 | 16,67 | ||||
| 2025-08-13 | 13F | Capital Fund Management S.a. | 159 344 | −80,68 | 1 646 | −77,22 | ||||
| 2025-07-24 | 13F | Us Bancorp \de\ | 182 419 | 11,15 | 1 884 | 31,11 | ||||
| 2025-05-12 | 13F | Pinpoint Asset Management Ltd | 0 | −100,00 | 0 | |||||
| 2025-08-14 | 13F | Aureus Asset Management, LLC | 11 592 | 1,35 | 120 | 19,00 | ||||
| 2025-08-06 | 13F | Fox Run Management, L.l.c. | 48 842 | 15,50 | 505 | 36,22 | ||||
| 2025-05-29 | NP | DSTX - Distillate International Fundamental Stability & Value ETF | 0 | −100,00 | 0 | −100,00 | ||||
| 2025-07-11 | 13F/A | Umb Bank N A/mo | 369 | 0,00 | 4 | 0,00 | ||||
| 2025-08-14 | 13F | Old Mission Capital Llc | 0 | −100,00 | 0 | |||||
| 2025-08-08 | 13F | SBI Securities Co., Ltd. | 381 | −52,96 | 4 | −57,14 | ||||
| 2025-08-13 | 13F | Northwestern Mutual Wealth Management Co | 4 928 | 537,52 | 51 | 733,33 | ||||
| 2025-08-29 | 13F | Infini Capital Management Ltd | 0 | −100,00 | 0 | |||||
| 2025-08-14 | 13F | Stifel Financial Corp | 348 627 | 11,37 | 3 601 | 31,33 | ||||
| 2025-06-30 | NP | VIHAX - Vanguard International High Dividend Yield Index Fund Admiral Shares | 148 022 | 11,48 | 1 292 | −4,08 | ||||
| 2025-05-02 | 13F | Capital A Wealth Management, LLC | 374 | 0,00 | 3 | 0,00 | ||||
| 2025-08-07 | 13F | Vise Technologies, Inc. | 59 875 | 619 | ||||||
| 2025-07-24 | 13F | PDS Planning, Inc | 44 851 | 8,11 | 463 | 27,55 | ||||
| 2025-08-27 | 13F/A | Brinker Capital Investments, LLC | 159 366 | 11,10 | 1 646 | 31,05 | ||||
| 2025-05-15 | 13F | Cullen Capital Management, LLC | 4 497 235 | 1,65 | 39 396 | −11,57 | ||||
| 2025-06-30 | 13F/A | Deutsche Bank Ag\ | 0 | −100,00 | 0 | |||||
| 2025-08-14 | 13F | Graham Capital Management, L.P. | 96 510 | 415,02 | 997 | 507,32 | ||||
| 2025-07-31 | 13F | Whipplewood Advisors, LLC | 8 604 | −4,80 | 89 | 10,00 | ||||
| 2025-07-31 | 13F | Cambridge Investment Research Advisors, Inc. | 22 520 | 0,82 | 0 | |||||
| 2025-08-14 | 13F | Bank Of America Corp /de/ | 8 815 184 | 18,84 | 91 061 | 40,13 | ||||
| 2025-07-29 | 13F | Wealthstream Advisors, Inc. | 14 661 | 3,41 | 151 | 21,77 | ||||
| 2025-08-12 | 13F | BlackRock, Inc. | 18 438 418 | 23,06 | 190 469 | 45,11 | ||||
| 2025-08-27 | NP | RYWTX - Emerging Markets 2x Strategy Fund Class A | 9 167 | 148,02 | 95 | 193,75 | ||||
| 2025-07-23 | 13F | Canopy Partners, LLC | 0 | −100,00 | 0 | |||||
| 2025-06-26 | NP | DFAE - Dimensional Emerging Core Equity Market ETF | 293 000 | 33,79 | 2 558 | 15,08 | ||||
| 2025-05-06 | 13F | Proficio Capital Partners LLC | 0 | −100,00 | 0 | −100,00 | ||||
| 2025-08-08 | 13F | Crossmark Global Holdings, Inc. | 1 583 387 | 0,90 | 16 356 | 18,98 | ||||
| 2025-08-14 | 13F | Lazard Asset Management Llc | 18 161 928 | −0,36 | 188 | 17,61 | ||||
| 2025-07-10 | 13F | Wealth Enhancement Advisory Services, Llc | 15 624 | −2,35 | 162 | 15,71 | ||||
| 2025-08-15 | 13F | Tower Research Capital LLC (TRC) | 2 413 | −89,54 | 25 | −88,12 | ||||
| 2025-08-14 | 13F | Wiley Bros.-aintree Capital, Llc | 39 900 | 5,06 | 412 | 23,35 | ||||
| 2025-08-14 | 13F | Boothbay Fund Management, Llc | 202 800 | 23,90 | 2 095 | 46,13 | ||||
| 2025-05-14 | 13F | Seeds Investor Llc | 0 | −100,00 | 0 | |||||
| 2025-07-30 | 13F | Cullen/frost Bankers, Inc. | 968 | 0,00 | 10 | 12,50 | ||||
| 2025-08-14 | 13F | Wetherby Asset Management Inc | 181 122 | 40,38 | 1 871 | 43,96 | ||||
| 2025-05-02 | 13F | Cable Hill Partners, LLC | 31 480 | −24,48 | 275 | −34,61 | ||||
| 2025-08-14 | 13F | Ubs Asset Management Americas Inc | 400 000 | 53,85 | 4 132 | 81,47 | ||||
| 2025-08-06 | 13F | Stone House Investment Management, LLC | 350 | 40,00 | 4 | 50,00 | ||||
| 2025-08-14 | 13F | Ameriprise Financial Inc | 49 805 | −17,51 | 514 | −2,65 | ||||
| 2025-07-25 | NP | USEMX - Emerging Markets Fund Shares | 320 730 | 3,15 | 3 008 | −4,48 | ||||
| 2025-07-18 | 13F | BSW Wealth Partners | 49 191 | 4,13 | 508 | 23,00 | ||||
| 2025-08-13 | 13F | Mackenzie Financial Corp | 218 298 | −7,49 | 2 255 | 9,10 | ||||
| 2025-08-13 | 13F | Natixis Advisors, L.p. | 2 360 891 | 11,62 | 24 | 33,33 | ||||
| 2025-07-29 | 13F | Werba Rubin Papier Wealth Management | 0 | −100,00 | 0 | |||||
| 2025-07-15 | 13F | Fifth Third Bancorp | 6 072 | −3,22 | 63 | 14,81 | ||||
| 2025-07-17 | 13F | Janney Montgomery Scott LLC | 44 655 | 41,99 | 0 | |||||
| 2025-04-22 | 13F | Stiles Financial Services Inc | 0 | −100,00 | 0 | |||||
| 2025-08-11 | 13F | Tidemark, LLC | 713 | 0,00 | 7 | 16,67 | ||||
| 2025-07-07 | 13F | Retirement Wealth Solutions LLC | 1 843 | 0,00 | 19 | 18,75 | ||||
| 2025-07-24 | 13F | Jfs Wealth Advisors, Llc | 1 678 | 1,33 | 17 | 21,43 | ||||
| 2025-06-26 | NP | DEXC - Dimensional Emerging Markets ex China Core Equity ETF | 30 500 | 19,61 | 266 | 3,10 | ||||
| 2025-06-27 | NP | SOXL - Direxion Daily Semiconductor Bull 3X Shares | 5 939 638 | 16,94 | 51 853 | 0,58 | ||||
| 2025-08-12 | 13F | Pathstone Holdings, LLC | 75 595 | 9,63 | 781 | 29,14 | ||||
| 2025-08-13 | 13F | Invesco Ltd. | 146 121 | −2,83 | 1 509 | 14,58 | ||||
| 2025-05-12 | 13F | National Bank Of Canada /fi/ | 0 | −100,00 | 0 | |||||
| 2025-07-25 | 13F | Sequoia Financial Advisors, LLC | 127 674 | 25,68 | 1 319 | 48,26 | ||||
| 2025-05-05 | 13F | Lindbrook Capital, Llc | 7 524 | −5,25 | 66 | −17,72 | ||||
| 2025-08-14 | 13F | Barometer Capital Management Inc. | 29 100 | 24,89 | 290 | 42,16 | ||||
| 2025-08-06 | 13F | Valued Wealth Advisors LLC | 676 | 0,00 | 7 | 20,00 | ||||
| 2025-07-25 | 13F | JustInvest LLC | 315 055 | 35,24 | 3 255 | 59,51 | ||||
| 2025-08-12 | 13F | Inscription Capital, LLC | 0 | −100,00 | 0 | |||||
| 2025-08-14 | 13F | Bnp Paribas Arbitrage, Sa | 1 325 760 | −6,71 | 13 695 | 10,01 | ||||
| 2025-08-14 | 13F | Mml Investors Services, Llc | 60 236 | −1,52 | 1 | |||||
| 2025-08-12 | 13F | LPL Financial LLC | 85 082 | 88,94 | 879 | 122,84 | ||||
| 2025-06-30 | NP | TRFM - AAM Transformers ETF | 14 668 | −21,47 | 128 | −32,28 | ||||
| 2025-08-12 | 13F | American Century Companies Inc | 3 180 215 | 20,87 | 32 852 | 42,53 | ||||
| 2025-08-27 | NP | RYSIX - Electronics Fund Investor Class | 84 052 | 7,48 | 868 | 26,72 | ||||
| 2025-07-11 | 13F | Farther Finance Advisors, LLC | 2 746 | 154,26 | 28 | 211,11 | ||||
| 2025-08-14 | 13F | Wellington Management Group Llp | 0 | −100,00 | 0 | |||||
| 2025-08-05 | 13F | Key FInancial Inc | 1 386 | 0,00 | 14 | 16,67 | ||||
| 2025-05-13 | 13F | Clear Street Markets Llc | 0 | −100,00 | 0 | −100,00 | ||||
| 2025-08-06 | 13F | True Wealth Design, LLC | 193 | −48,81 | 2 | −66,67 | ||||
| 2025-08-14 | 13F | Schonfeld Strategic Advisors LLC | 162 200 | −28,26 | 1 676 | −15,40 | ||||
| 2025-07-30 | NP | APIE - ActivePassive International Equity ETF | 109 849 | −42,33 | 1 030 | −46,60 | ||||
| 2025-05-05 | 13F | Kestra Private Wealth Services, Llc | 0 | −100,00 | 0 | |||||
| 2025-07-18 | 13F | Bartlett & Co. Wealth Management Llc | 125 | 1 | ||||||
| 2025-07-31 | 13F | Brighton Jones Llc | 16 071 | −7,28 | 166 | 9,93 | ||||
| 2025-08-12 | 13F | Legal & General Group Plc | 15 647 | 261,95 | 162 | 335,14 | ||||
| 2025-08-14 | 13F | Ariadne Wealth Management, LP | 16 792 | 168 | ||||||
| 2025-08-14 | 13F | Royal Bank Of Canada | 516 154 | 11,68 | 5 332 | 31,69 | ||||
| 2025-08-13 | 13F | GeoWealth Management, LLC | 12 997 | 134 | ||||||
| 2025-08-14 | 13F | Mariner, LLC | 210 258 | 22,25 | 2 174 | 44,26 | ||||
| 2025-08-11 | 13F | NewEdge Wealth, LLC | 0 | −100,00 | 0 | |||||
| 2025-07-11 | 13F | Mitchell & Pahl Private Wealth, Llc | 27 526 | −3,55 | 284 | 13,60 | ||||
| 2025-08-08 | 13F | Candriam Luxembourg S.C.A. | 31 619 | 0,00 | 327 | 18,12 | ||||
| 2025-08-11 | 13F | Lsv Asset Management | 525 700 | −37,10 | 5 | −28,57 | ||||
| 2025-05-14 | 13F | Grantham, Mayo, Van Otterloo & Co. LLC | 0 | −100,00 | 0 | |||||
| 2025-08-13 | 13F | Groupama Asset Managment | 80 446 | 1,77 | 852 | 22,45 | ||||
| 2025-07-28 | 13F | Harbour Investments, Inc. | 101 | 0,00 | 1 | |||||
| 2025-08-11 | 13F | Bell Investment Advisors, Inc | 341 | −18,81 | 4 | 0,00 | ||||
| 2025-08-14 | 13F | D. E. Shaw & Co., Inc. | 893 155 | −44,77 | 9 226 | −34,87 | ||||
| 2025-08-05 | 13F | NewSquare Capital LLC | 1 963 | 198,33 | 20 | 300,00 | ||||
| 2025-06-25 | NP | FTLS - First Trust Long/Short Equity ETF This fund is a listed as child fund of First Trust Advisors Lp and if that institution has disclosed ownership in this security, then these positions will not be double counted when calculating total shares and total value | 0 | −100,00 | 0 | −100,00 | ||||
| 2025-07-31 | 13F | Caitong International Asset Management Co., Ltd | 0 | −100,00 | 0 | |||||
| 2025-08-05 | 13F | Westside Investment Management, Inc. | 1 384 | 14 | ||||||
| 2025-08-08 | 13F | Creative Planning | 729 104 | 96,59 | 7 532 | 131,87 | ||||
| 2025-08-13 | 13F | Russell Investments Group, Ltd. | 165 210 | 1 472,53 | 1 747 | 1 798,91 | ||||
| 2025-08-11 | 13F | Citigroup Inc | 3 942 160 | −8,29 | 40 723 | 8,15 | ||||
| 2025-08-14 | 13F | Fmr Llc | 174 298 | −8,90 | 1 801 | 7,40 | ||||
| 2025-06-26 | NP | DFEM - Dimensional Emerging Markets Core Equity 2 ETF | 84 000 | 9,09 | 733 | −6,15 | ||||
| 2025-08-18 | 13F | Geneos Wealth Management Inc. | 3 111 | 6,40 | 32 | 28,00 | ||||
| 2025-05-14 | 13F | EntryPoint Capital, LLC | 0 | −100,00 | 0 | |||||
| 2025-07-15 | 13F | Td Private Client Wealth Llc | 40 957 | 25,99 | 423 | 48,94 | ||||
| 2025-08-12 | 13F | Summit Global Investments | 51 023 | −0,34 | 1 | |||||
| 2025-07-31 | 13F | Ground Swell Capital, LLC | 0 | −100,00 | 0 | |||||
| 2025-04-22 | 13F | Mizuho Securities Co. Ltd. | 0 | −100,00 | 0 | |||||
| 2025-08-14 | 13F | Erste Asset Management GmbH | 57 500 | 612 | ||||||
| 2025-08-15 | 13F | Morgan Stanley | 9 254 385 | 30,55 | 95 598 | 53,94 | ||||
| 2025-08-29 | NP | MPLAX - Praxis International Index Fund Class A | 153 655 | 6,77 | 1 587 | 25,95 | ||||
| 2025-07-31 | 13F | 180 Wealth Advisors, Llc | 12 070 | 0,60 | 125 | 18,10 | ||||
| 2025-08-12 | 13F | MAI Capital Management | 4 969 | 2 409,60 | 51 | 5 000,00 | ||||
| 2025-08-12 | 13F | Jpmorgan Chase & Co | 1 901 855 | −63,56 | 19 646 | −57,03 | ||||
| 2025-07-10 | 13F | Perkins Coie Trust Co | 0 | −100,00 | 0 | |||||
| 2025-07-28 | NP | AVEEX - Avantis Emerging Markets Equity Fund Institutional Class This fund is a listed as child fund of American Century Companies Inc and if that institution has disclosed ownership in this security, then these positions will not be double counted when calculating total shares and total value | 156 747 | 0,00 | 1 470 | −7,37 | ||||
| 2025-08-13 | 13F | Twin Peaks Wealth Advisors, LLC | 643 | 7 | ||||||
| 2025-08-11 | 13F | Banque Cantonale Vaudoise | 52 093 | −0,30 | 1 | |||||
| 2025-08-14 | 13F | Toroso Investments, LLC | Call | 0 | −100,00 | 0 | ||||
| 2025-07-28 | NP | AVES - Avantis Emerging Markets Value ETF This fund is a listed as child fund of American Century Companies Inc and if that institution has disclosed ownership in this security, then these positions will not be double counted when calculating total shares and total value | 158 975 | 25,95 | 1 491 | 16,67 | ||||
| 2025-03-28 | NP | HAOSX - Harbor Overseas Fund Institutional Class | 174 728 | −30,91 | 1 773 | −26,64 | ||||
| 2025-08-14 | 13F | Vident Advisory, LLC | 511 148 | −38,22 | 5 280 | −27,14 | ||||
| 2025-08-08 | 13F | Gts Securities Llc | 11 974 | 124 | ||||||
| 2025-08-12 | 13F | Global Retirement Partners, LLC | 5 098 | 22,34 | 53 | 26,83 | ||||
| 2025-08-27 | NP | RYDEX VARIABLE TRUST - Electronics Fund Variable Annuity | 11 629 | −55,27 | 120 | −47,14 | ||||
| 2025-08-06 | 13F | Golden State Wealth Management, LLC | 1 795 | 0,00 | 19 | 20,00 | ||||
| 2025-07-16 | 13F | Banque Pictet & Cie Sa | 307 809 | −2,05 | 3 180 | 15,52 |