Grundläggande statistik
| Institutionella ägare | 149 total, 149 long only, 0 short only, 0 long/short - change of 0,67% MRQ |
| Genomsnittlig portföljallokering | 0.3994 % - change of −7,05% MRQ |
| Institutionella aktier (lång) | 3 543 293 (ex 13D/G) - change of 0,21MM shares 6,43% MRQ |
| Institutionellt värde (lång) | $ 593 068 USD ($1000) |
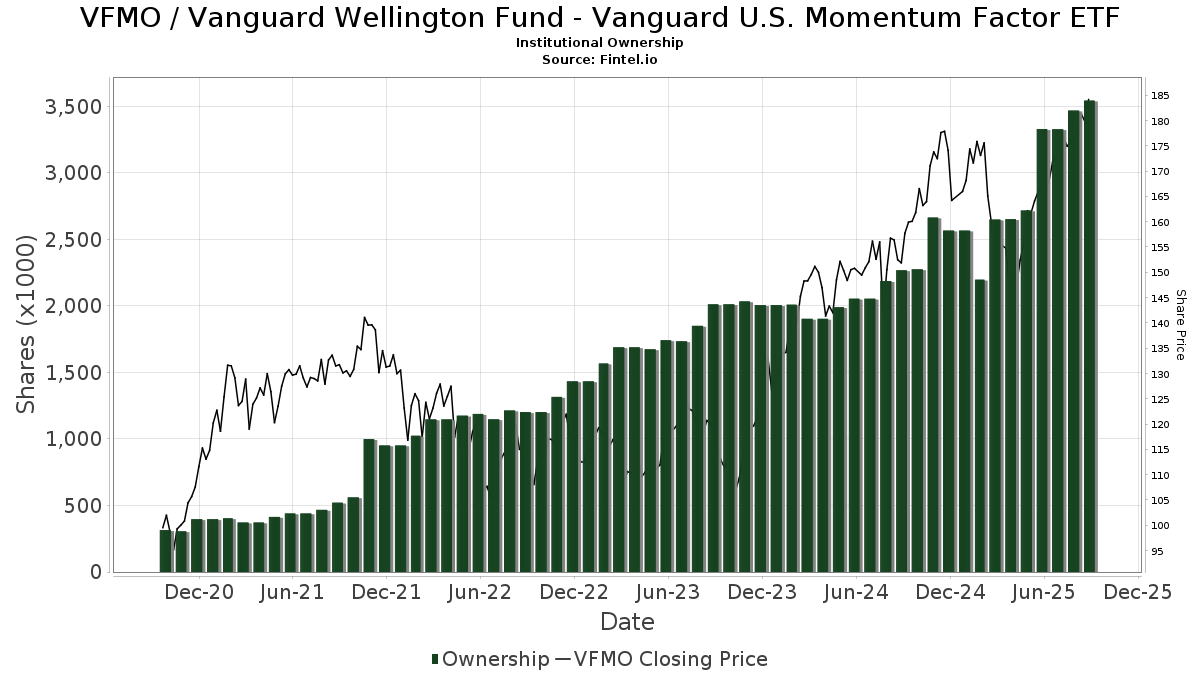
Institutionellt ägande och aktieägare
Vanguard Wellington Fund - Vanguard U.S. Momentum Factor ETF (US:VFMO) har 149 Institutionella ägare och aktieägare som har lämnat in 13D/G- eller 13F-formulär till Securities Exchange Commission (SEC). Dessa institut innehar totalt 3,543,293 aktier. Största aktieägare inkluderar Ritholtz Wealth Management, Great Valley Advisor Group, Inc., Cetera Investment Advisers, Strategic Financial Services, Inc,, Systelligence, LLC, Davidson Investment Advisors, Anderson Hoagland & Co, Cabot Wealth Management Inc, Empirical Financial Services, LLC d.b.a. Empirical Wealth Management, and LPL Financial LLC .
Vanguard Wellington Fund - Vanguard U.S. Momentum Factor ETF (BATS:VFMO) Institutionell ägarstruktur visar institutioners och fonders nuvarande positioner i företaget, samt de senaste förändringarna i positionernas storlek. Större aktieägare kan vara enskilda investerare, fonder, hedgefonder eller institutioner. Bilaga 13D visar att investeraren äger (eller ägde) mer än 5% av företaget och avser (eller avsåg) att aktivt eftersträva en förändring av affärsstrategin. Schedule 13G indikerar en passiv investering på över 5%.
The share price as of September 10, 2025 is 184,14 / share. Previously, on September 11, 2024, the share price was 151,86 / share. This represents an increase of 21,26% over that period.
Fondsentimentets poäng
Fondsentimentet poängen(fka Ägarackumulation-poäng) visar vilka aktier som är mest köpta av fonder. Det är resultatet av en sofistikerad kvantitativ flerfaktormodell som identifierar företag med de högsta nivåerna av institutionell ackumulering. Poängsättningsmodellen använder en kombination av den totala ökningen av redovisade ägare, förändringarna i portföljallokeringarna för dessa ägare och andra mått. Siffran sträcker sig från 0 till 100, där högre siffror indikerar en högre nivå av ackumulering i förhållande till sina konkurrenter, och 50 är genomsnittet.
Uppdateringsfrekvens: Dagligen
Se Ownership Explorer, som innehåller en lista över de högst rankade företagen.
Institutionell sälj/köp-kvot
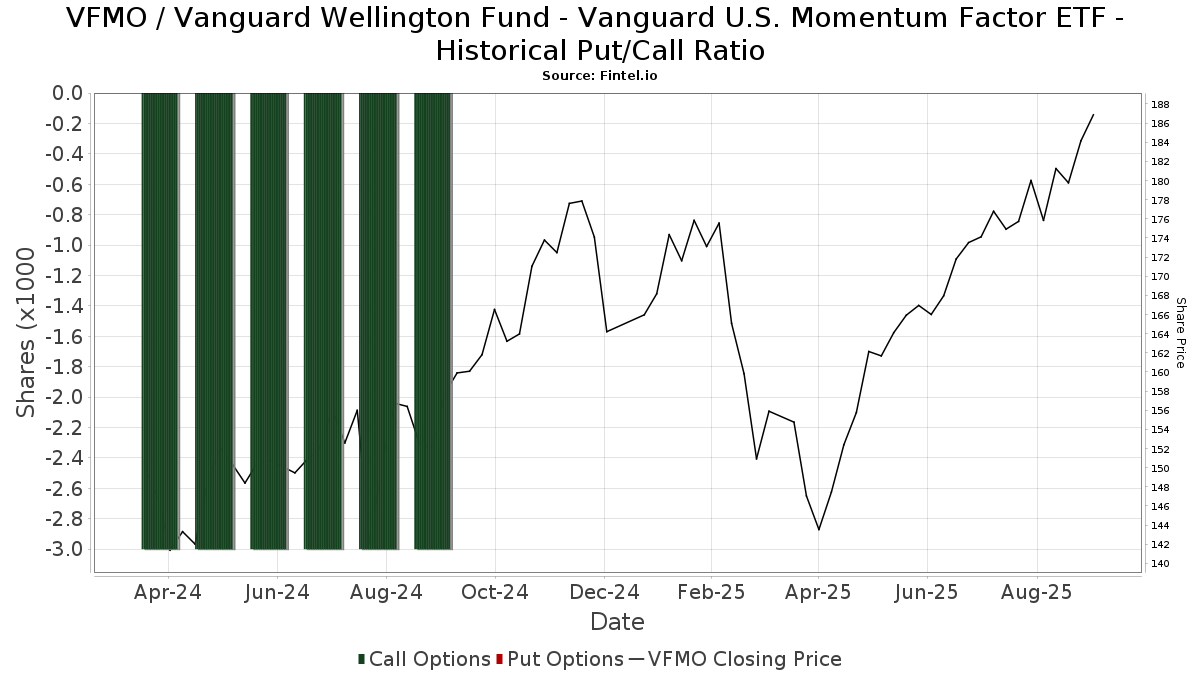
Förutom att rapportera vanliga eget kapital- och skuldemissioner måste institutioner med mer än 100MM tillgångar under förvaltning också avslöja sina innehav av sälj- och köpoptioner. Eftersom säljoptioner i allmänhet indikerar ett negativt sentiment och köpoptioner indikerar ett positivt sentiment, kan vi få en uppfattning om det övergripande institutionella sentimentet genom att plotta förhållandet mellan säljoptioner och köpoptioner. Diagrammet till höger visar det historiska förhållandet mellan sälj- och köpoptioner för detta instrument.
Genom att använda sälj/köp-kvoten som en indikator på aktieägarnas sentiment undviker man en av de största bristerna med att använda det totala institutionella ägandet, nämligen att en betydande del av de förvaltade tillgångarna investeras passivt för att följa index. Passivt förvaltade fonder köper vanligtvis inte optioner, så indikatorn för sälj/köp-kvoten ger en bättre bild av stämningen i aktivt förvaltade fonder.
13F- och NPORT-arkiveringar
Detaljer om 13F-arkiveringar är gratis. Detaljer om NP-arkiveringar kräver ett premiummedlemskap. Gröna rader indikerar nya positioner. Röda rader indikerar stängda positioner. Klicka på länk symbolen för att se hela transaktionshistoriken.
Uppgradera
för att låsa upp premiumdata och exportera till Excel ![]() .
.
| Fil Datum | Källa | Investerare | Typ | Genomsnittligt pris (beräknat) |
Aktier | Δ Aktier (%) |
Rapporterat värde (1000 USD) |
Δ Värde (%) |
Portföljallokering (%) |
|
|---|---|---|---|---|---|---|---|---|---|---|
| 2025-07-15 | 13F | Financial Partners Group, Inc | 49 165 | −17,69 | 8 482 | −6,40 | ||||
| 2025-07-22 | 13F | Wealthcare Advisory Partners LLC | 4 043 | 138,24 | 697 | 171,21 | ||||
| 2025-08-14 | 13F | Mariner, LLC | 11 719 | 19,52 | 2 022 | 35,91 | ||||
| 2025-08-14 | 13F | Old Mission Capital Llc | 8 197 | −42,80 | 1 414 | −34,96 | ||||
| 2025-08-26 | NP | EVTTX - The E-Valuator Conservative/Moderate (30%-50%) RMS Fund Service Class Shares | 3 808 | 3,82 | 657 | 17,99 | ||||
| 2025-08-14 | 13F | Two Sigma Securities, Llc | 0 | −100,00 | 0 | |||||
| 2025-08-26 | NP | EVGLX - The E-Valuator Growth (70%-85%) RMS Fund Service Class Shares | 68 061 | 24,29 | 11 742 | 41,34 | ||||
| 2025-07-17 | 13F | Lazari Capital Management, Inc. | 3 591 | −3,10 | 620 | 10,14 | ||||
| 2025-08-13 | 13F | Transce3nd, LLC | 203 | 0,00 | 35 | 16,67 | ||||
| 2025-04-28 | 13F | Coastline Trust Co | 0 | −100,00 | 0 | |||||
| 2025-04-22 | 13F | Castleview Partners, Llc | 0 | −100,00 | 0 | |||||
| 2025-04-02 | 13F | Global Wealth Strategies & Associates | 0 | −100,00 | 0 | |||||
| 2025-08-18 | 13F | Geneos Wealth Management Inc. | 208 | −90,87 | 36 | −89,86 | ||||
| 2025-07-24 | 13F | Certus Wealth Management, LLC | 9 481 | 0,59 | 1 636 | 7,85 | ||||
| 2025-08-12 | 13F | Proequities, Inc. | 0 | 0 | ||||||
| 2025-07-10 | 13F | Redhawk Wealth Advisors, Inc. | 20 207 | 3,07 | 3 486 | 17,22 | ||||
| 2025-07-28 | 13F | Harbour Investments, Inc. | 4 276 | −6,80 | 738 | 6,04 | ||||
| 2025-07-28 | 13F | Ritholtz Wealth Management | 597 746 | 24,56 | 103 123 | 41,65 | ||||
| 2025-04-30 | 13F | Allworth Financial LP | 0 | −100,00 | 0 | |||||
| 2025-08-14 | 13F | BancorpSouth Bank | 1 200 | 207 | ||||||
| 2025-07-23 | 13F | Armbruster Capital Management, Inc. | 48 448 | 18,48 | 8 358 | 34,74 | ||||
| 2025-08-14 | 13F | Warren Averett Asset Management, LLC | 2 412 | −24,22 | 416 | −13,69 | ||||
| 2025-04-23 | 13F | Perigon Wealth Management, LLC | 0 | −100,00 | 0 | |||||
| 2025-08-14 | 13F | Avant Capital LLC | 1 277 | 220 | ||||||
| 2025-08-14 | 13F | Betterment LLC | 20 344 | −3,12 | 4 | 0,00 | ||||
| 2025-08-15 | 13F | Tower Research Capital LLC (TRC) | 28 | −98,80 | 5 | −98,87 | ||||
| 2025-08-13 | 13F | Valued Retirements, Inc. | 4 588 | 202,84 | 792 | 245,41 | ||||
| 2025-05-15 | 13F | One Wealth Capital Management, Llc | 0 | −100,00 | 0 | |||||
| 2025-08-14 | 13F | Great Valley Advisor Group, Inc. | 348 637 | −10,14 | 60 147 | 2,18 | ||||
| 2025-07-30 | 13F | Strategic Blueprint, LLC | 0 | −100,00 | 0 | |||||
| 2025-08-08 | 13F | Pnc Financial Services Group, Inc. | 0 | −100,00 | 0 | |||||
| 2025-07-25 | 13F | Apollon Wealth Management, LLC | 3 872 | 668 | ||||||
| 2025-08-14 | 13F | Raymond James Financial Inc | 78 675 | 6,01 | 13 573 | 20,55 | ||||
| 2025-08-14 | 13F | Mercer Global Advisors Inc /adv | 6 089 | −9,77 | 1 050 | 2,64 | ||||
| 2025-07-29 | 13F | International Assets Investment Management, Llc | 9 923 | 0,91 | 1 712 | 14,76 | ||||
| 2025-08-13 | 13F | Capital Analysts, Inc. | 92 | −36,11 | 0 | |||||
| 2025-08-14 | 13F | Wells Fargo & Company/mn | 752 | 130 | ||||||
| 2025-08-15 | 13F | Kestra Advisory Services, LLC | 12 443 | 14,10 | 2 147 | 29,75 | ||||
| 2025-08-14 | 13F | Bank Of America Corp /de/ | 48 314 | 16,84 | 8 335 | 32,87 | ||||
| 2025-09-04 | 13F/A | Advisor Group Holdings, Inc. | 13 484 | −3,62 | 2 327 | 9,61 | ||||
| 2025-07-23 | 13F | Clear Creek Financial Management, LLC | 1 174 | −89,21 | 202 | −87,76 | ||||
| 2025-08-11 | 13F | Brown Brothers Harriman & Co | 0 | −100,00 | 0 | |||||
| 2025-07-25 | 13F | Atria Wealth Solutions, Inc. | 1 955 | 6,95 | 337 | 21,66 | ||||
| 2025-07-17 | 13F | Nova R Wealth, Inc. | 12 612 | 0,22 | 2 176 | 13,93 | ||||
| 2025-05-15 | 13F | EP Wealth Advisors, Inc. | 0 | −100,00 | 0 | −100,00 | ||||
| 2025-07-29 | NP | HFND - Unlimited HFND Multi-Strategy Return Tracker ETF | 5 347 | −37,13 | 879 | −37,44 | ||||
| 2025-07-31 | 13F | City State Bank | 100 | 0,00 | 17 | 13,33 | ||||
| 2025-07-09 | 13F | Lincoln Capital Corp | 26 283 | 0,94 | 4 534 | 14,78 | ||||
| 2025-07-15 | 13F | Graypoint LLC | 2 135 | −4,90 | 368 | 8,24 | ||||
| 2025-08-12 | 13F | LPL Financial LLC | 99 808 | −2,15 | 17 219 | 11,27 | ||||
| 2025-08-19 | 13F | Advisory Services Network, LLC | 2 109 | 8,38 | 369 | 24,75 | ||||
| 2025-08-15 | 13F | Orcam Financial Group | 1 737 | 0,35 | 300 | 14,12 | ||||
| 2025-07-09 | 13F | GSG Advisors LLC | 1 814 | −1,14 | 313 | 15,99 | ||||
| 2025-07-25 | 13F | Cwm, Llc | 6 515 | 1 | ||||||
| 2025-08-11 | 13F | United Advisor Group, LLC | 3 303 | 0,00 | 570 | 13,57 | ||||
| 2025-08-14 | 13F | Two Sigma Investments, Lp | 29 300 | 5 055 | ||||||
| 2025-07-29 | 13F | Stratos Wealth Advisors, LLC | 23 917 | 89,59 | 4 126 | 115,68 | ||||
| 2025-07-25 | 13F | Concurrent Investment Advisors, LLC | 1 884 | 34,28 | 325 | 52,83 | ||||
| 2025-08-14 | 13F | Ieq Capital, Llc | 2 435 | 420 | ||||||
| 2025-08-15 | 13F | Morgan Stanley | 3 040 | −36,44 | 524 | −27,72 | ||||
| 2025-05-30 | NP | ERNZ - TrueShares Active Yield ETF | 2 439 | 370 | ||||||
| 2025-07-30 | 13F | TFB Advisors LLC | 4 916 | 11,42 | 848 | 26,76 | ||||
| 2025-08-05 | 13F | Simplex Trading, Llc | 412 | 464,38 | 0 | |||||
| 2025-08-05 | 13F | GHP Investment Advisors, Inc. | 9 | 0,00 | 2 | 0,00 | ||||
| 2025-07-28 | NP | SPUSX - Symmetry Panoramic US Equity Fund Class I Shares | 30 962 | 14,84 | 5 091 | 14,22 | ||||
| 2025-05-13 | 13F | Journey Advisory Group, LLC | 0 | −100,00 | 0 | |||||
| 2025-08-08 | 13F | Cetera Investment Advisers | 311 015 | 7,30 | 53 656 | 22,01 | ||||
| 2025-08-14 | 13F | Sunbelt Securities, Inc. | 32 | 0,00 | 5 | 25,00 | ||||
| 2025-08-12 | 13F | Steward Partners Investment Advisory, Llc | 0 | −100,00 | 0 | |||||
| 2025-08-11 | 13F | HighTower Advisors, LLC | 0 | −100,00 | 0 | |||||
| 2025-08-26 | NP | EVVLX - The E-Valuator Very Conservative (0%-15%) RMS Fund Service Class Shares | 746 | 18,79 | 129 | 34,74 | ||||
| 2025-07-02 | 13F | Central Pacific Bank - Trust Division | 39 | 0,00 | 7 | 20,00 | ||||
| 2025-07-08 | 13F/A | Salem Investment Counselors Inc | 70 | 0,00 | 12 | 20,00 | ||||
| 2025-07-14 | 13F | Foster Group, Inc. | 1 619 | 279 | ||||||
| 2025-08-08 | 13F | Creative Planning | 1 672 | 0,00 | 289 | 13,83 | ||||
| 2025-07-23 | 13F | Tectonic Advisors Llc | 2 596 | −12,59 | 448 | −0,67 | ||||
| 2025-07-01 | 13F | Stonehearth Capital Management, LLC | 1 585 | −27,63 | 273 | −17,77 | ||||
| 2025-07-08 | 13F | Parallel Advisors, LLC | 1 100 | 0,00 | 190 | 13,86 | ||||
| 2025-08-14 | 13F | Main Street Financial Solutions, LLC | 0 | −100,00 | 0 | |||||
| 2025-07-29 | 13F | TrueMark Investments, LLC | 0 | −100,00 | 0 | |||||
| 2025-08-08 | 13F | Thoroughbred Financial Services, Llc | 6 604 | −13,76 | 1 | 0,00 | ||||
| 2025-08-12 | 13F | J.w. Cole Advisors, Inc. | 1 540 | −30,82 | 266 | −21,36 | ||||
| 2025-08-14 | 13F | Susquehanna International Group, Llp | 3 795 | −84,76 | 655 | −82,68 | ||||
| 2025-08-13 | 13F | Smith, Moore & Co. | 4 972 | −32,59 | 858 | −23,35 | ||||
| 2025-07-14 | 13F | Caitlin John, LLC | 9 663 | −13,09 | 1 667 | −1,13 | ||||
| 2025-08-14 | 13F | Wiley Bros.-aintree Capital, Llc | 12 086 | 2 102 | ||||||
| 2025-04-14 | 13F | Farther Finance Advisors, LLC | 0 | −100,00 | 0 | |||||
| 2025-07-31 | 13F | Buckingham Strategic Partners | 5 370 | 1,21 | 926 | 15,03 | ||||
| 2025-08-07 | 13F | Flagship Wealth Advisors, Llc | 2 250 | 0,00 | 388 | 13,78 | ||||
| 2025-08-12 | 13F | Global Retirement Partners, LLC | 5 051 | 16 193,55 | 871 | 17 320,00 | ||||
| 2025-08-14 | 13F | Jane Street Group, Llc | 2 112 | −82,09 | 364 | −79,64 | ||||
| 2025-07-31 | 13F | Glass Jacobson Investment Advisors llc | 149 | −68,76 | 26 | −67,95 | ||||
| 2025-08-08 | 13F | Avantax Advisory Services, Inc. | 6 415 | 0,08 | 1 107 | 13,79 | ||||
| 2025-08-12 | 13F | Atlas Capital Advisors Llc | 116 | 0,00 | 20 | 17,65 | ||||
| 2025-08-07 | 13F | Resources Investment Advisors, LLC. | 4 135 | 134,28 | 713 | 167,04 | ||||
| 2025-08-26 | 13F/A | Thrivent Financial For Lutherans | 21 653 | 4 | ||||||
| 2025-07-22 | 13F | Partners Wealth Management, Llc | 2 307 | 0,00 | 351 | 0,57 | ||||
| 2025-08-07 | 13F | Apeiron RIA LLC | 1 368 | 236 | ||||||
| 2025-07-28 | 13F | Davidson Investment Advisors | 132 299 | 3,90 | 22 824 | 18,15 | ||||
| 2025-08-11 | 13F | Strategic Wealth Partners, Ltd. | 352 | 61 | ||||||
| 2025-08-14 | 13F | Diversify Advisory Services, LLC | 3 160 | 12,70 | 566 | 31,70 | ||||
| 2025-07-10 | 13F | Wealth Enhancement Advisory Services, Llc | 1 156 | 201 | ||||||
| 2025-07-29 | 13F | Harbor Asset Planning, Inc. | 609 | 105 | ||||||
| 2025-08-14 | 13F | Mml Investors Services, Llc | 3 933 | 1,47 | 1 | |||||
| 2025-08-06 | 13F | Aspect Partners, LLC | 7 991 | 10,07 | 1 379 | 25,16 | ||||
| 2025-08-14 | 13F | Royal Bank Of Canada | 4 231 | 12,05 | 730 | 27,40 | ||||
| 2025-07-07 | 13F | Schulz Wealth, LTD. | 0 | −100,00 | 0 | |||||
| 2025-08-06 | 13F | Prospera Financial Services Inc | 0 | −100,00 | 0 | |||||
| 2025-04-30 | 13F | Cerity Partners LLC | 0 | −100,00 | 0 | |||||
| 2025-05-02 | 13F | Blake Schutter Theil Wealth Advisors, LLC | 0 | −100,00 | 0 | |||||
| 2025-08-13 | 13F | Kilter Group LLC | 1 | 0 | ||||||
| 2025-07-11 | 13F | Compass Ion Advisors, LLC | 3 879 | −44,26 | 669 | −36,59 | ||||
| 2025-07-21 | 13F | Ameritas Advisory Services, LLC | 1 111 | 192 | ||||||
| 2025-08-06 | 13F | First Horizon Advisors, Inc. | 454 | 0,00 | 78 | 14,71 | ||||
| 2025-07-14 | 13F | Park Avenue Securities Llc | 1 414 | 0 | ||||||
| 2025-08-14 | 13F | Citadel Advisors Llc | 0 | −100,00 | 0 | |||||
| 2025-08-27 | 13F/A | Brinker Capital Investments, LLC | 2 180 | 29,45 | 376 | 47,45 | ||||
| 2025-05-12 | 13F | Townsquare Capital Llc | 0 | −100,00 | 0 | |||||
| 2025-07-14 | 13F | AdvisorNet Financial, Inc | 2 010 | −0,35 | 347 | 13,07 | ||||
| 2025-07-25 | 13F | Northwest Capital Management Inc | 6 515 | 1 124 | ||||||
| 2025-08-12 | 13F | O'shaughnessy Asset Management, Llc | 3 884 | 15,15 | 670 | 31,12 | ||||
| 2025-07-17 | 13F | Janney Montgomery Scott LLC | 1 928 | 39,41 | 0 | |||||
| 2025-08-05 | 13F | Sigma Planning Corp | 0 | −100,00 | 0 | |||||
| 2025-07-14 | 13F | Seed Wealth Management, Inc. | 3 230 | 0,00 | 557 | 13,67 | ||||
| 2025-08-14 | 13F | Comerica Bank | 8 380 | 6,85 | 1 446 | 21,53 | ||||
| 2025-05-15 | 13F/A | Orion Portfolio Solutions, LLC | 1 684 | −21,38 | 255 | −27,56 | ||||
| 2025-07-11 | 13F | SILVER OAK SECURITIES, Inc | 1 502 | 31,52 | 259 | 50,58 | ||||
| 2025-08-13 | 13F | Russell Investments Group, Ltd. | 5 | −50,00 | 1 | −100,00 | ||||
| 2025-07-31 | 13F | Hobart Private Capital, LLC | 21 333 | −3,74 | 3 680 | 9,46 | ||||
| 2025-08-04 | 13F | Arkadios Wealth Advisors | 2 142 | 0,00 | 370 | 13,89 | ||||
| 2025-08-26 | NP | EVMLX - The E-Valuator Moderate (50%-70%) RMS Fund Service Class Shares | 29 952 | 14,30 | 5 167 | 29,99 | ||||
| 2025-07-17 | 13F | Melfa Wealth Management, Llc | 0 | −100,00 | 0 | |||||
| 2025-07-24 | 13F | Jfs Wealth Advisors, Llc | 0 | −100,00 | 0 | |||||
| 2025-08-14 | 13F | Quantinno Capital Management LP | 1 220 | 210 | ||||||
| 2025-08-11 | 13F | Principal Securities, Inc. | 3 601 | 5,48 | 621 | 10,70 | ||||
| 2025-07-28 | NP | SPGEX - Symmetry Panoramic Global Equity Fund Class I Shares | 27 562 | −15,36 | 4 532 | −15,79 | ||||
| 2025-07-07 | 13F | Nova Wealth Management, Inc. | 9 791 | 5,04 | 1 689 | 19,45 | ||||
| 2025-08-13 | 13F | Northwestern Mutual Wealth Management Co | 2 777 | −32,81 | 479 | −23,60 | ||||
| 2025-07-08 | 13F | IAM Advisory, LLC | 8 310 | −0,46 | 1 434 | 13,19 | ||||
| 2025-07-21 | 13F | Barrett & Company, Inc. | 125 | 0,00 | 22 | 16,67 | ||||
| 2025-05-02 | 13F | BlackRock, Inc. | 0 | −100,00 | 0 | −100,00 | ||||
| 2025-07-30 | 13F | Pacific Sun Financial Corp | 2 031 | 0,25 | 350 | 14,01 | ||||
| 2025-07-31 | 13F | Cabot Wealth Management Inc | 107 961 | 0,93 | 18 626 | 14,77 | ||||
| 2025-07-29 | 13F | Signature Estate & Investment Advisors Llc | 1 523 | −9,18 | 263 | 3,15 | ||||
| 2025-08-14 | 13F | Toroso Investments, LLC | 4 507 | −33,52 | 778 | −24,42 | ||||
| 2025-08-07 | 13F | PFG Advisors | 0 | −100,00 | 0 | |||||
| 2025-07-29 | 13F | Systelligence, LLC | 178 522 | 22,85 | 30 799 | 39,70 | ||||
| 2025-08-14 | 13F | GWM Advisors LLC | 29 158 | 4,65 | 5 030 | 19,03 | ||||
| 2025-08-05 | 13F | Fullcircle Wealth Llc | 8 046 | −6,33 | 1 416 | 8,35 | ||||
| 2025-08-13 | 13F | SCS Capital Management LLC | 5 184 | −15,25 | 894 | −3,66 | ||||
| 2025-07-24 | 13F | IFP Advisors, Inc | 45 | −6,25 | 8 | 0,00 | ||||
| 2025-08-05 | 13F | Huntington National Bank | 1 | |||||||
| 2025-07-11 | 13F | UMA Financial Services, Inc. | 0 | −100,00 | 0 | |||||
| 2025-08-01 | 13F | Envestnet Asset Management Inc | 92 105 | 14,49 | 15 890 | 30,20 | ||||
| 2025-07-31 | 13F/A | Avion Wealth | 107 | 0,00 | 0 | |||||
| 2025-08-13 | 13F | Financial Freedom, LLC | 7 655 | 107,51 | 1 321 | 136,14 | ||||
| 2025-08-11 | 13F | Private Advisor Group, LLC | 26 344 | 248,88 | 4 545 | 296,86 | ||||
| 2025-07-29 | 13F | Chicago Partners Investment Group LLC | 2 069 | 0,15 | 366 | 13,71 | ||||
| 2025-08-04 | 13F | Spire Wealth Management | 41 | 2,50 | 7 | 16,67 | ||||
| 2025-04-15 | 13F | Noble Wealth Management PBC | 375 | 0,00 | 57 | −8,20 | ||||
| 2025-07-11 | 13F/A | Umb Bank N A/mo | 21 575 | −1,60 | 3 722 | 11,91 | ||||
| 2025-08-04 | 13F | BLB&B Advisors, LLC | 7 250 | 0,00 | 1 251 | 13,74 | ||||
| 2025-08-06 | 13F | Commonwealth Equity Services, Llc | 15 560 | −5,93 | 3 | 0,00 | ||||
| 2025-08-08 | 13F | Hartland & Co., LLC | 9 902 | −2,35 | 1 708 | 11,05 | ||||
| 2025-07-21 | 13F | Riverview Trust Co | 2 456 | 0,00 | 424 | 13,71 | ||||
| 2025-07-25 | 13F | Envestnet Portfolio Solutions, Inc. | 0 | −100,00 | 0 | |||||
| 2025-07-22 | 13F | Belpointe Asset Management LLC | 1 268 | −62,12 | 219 | −57,09 | ||||
| 2025-08-26 | NP | EVCLX - The E-Valuator Conservative (15%-30%) RMS Fund Service Class Shares | 4 098 | 50,88 | 707 | 71,36 | ||||
| 2025-08-06 | 13F | Wedbush Securities Inc | 7 394 | 5,09 | 1 | 0,00 | ||||
| 2025-08-07 | 13F | Parkside Financial Bank & Trust | 215 | 0,00 | 37 | 15,63 | ||||
| 2025-07-31 | 13F | Cambridge Investment Research Advisors, Inc. | 15 560 | −5,95 | 3 | 0,00 | ||||
| 2025-08-14 | 13F | Wilkins Miller Wealth Management, LLC | 7 306 | 143,61 | 1 261 | 177,53 | ||||
| 2025-08-26 | NP | EVAGX - The E-Valuator Aggressive Growth (85%-99%) RMS Fund Service Class Shares | 71 857 | 25,32 | 12 397 | 42,50 | ||||
| 2025-07-24 | 13F | Robertson Stephens Wealth Management, LLC | 1 466 | 0,14 | 253 | 13,51 | ||||
| 2025-08-01 | 13F | Strategic Financial Services, Inc, | 279 497 | 3,71 | 48 219 | 17,94 | ||||
| 2025-07-10 | 13F | Anderson Hoagland & Co | 118 390 | −0,45 | 20 425 | 27,92 | ||||
| 2025-07-22 | 13F | Merit Financial Group, LLC | 17 899 | 28,13 | 3 088 | 45,68 | ||||
| 2025-07-16 | 13F | Kathmere Capital Management, LLC | 3 229 | 10,36 | 557 | 25,73 | ||||
| 2025-07-28 | NP | SPGTX - Symmetry Panoramic Tax Managed Global Equity Fund Class I Shares | 9 589 | 0,00 | 1 577 | −0,57 | ||||
| 2025-05-08 | 13F | Us Bancorp \de\ | 0 | −100,00 | 0 | |||||
| 2025-08-14 | 13F | UBS Group AG | 21 321 | 50,83 | 3 678 | 71,55 | ||||
| 2025-07-21 | 13F | Empirical Financial Services, LLC d.b.a. Empirical Wealth Management | 107 518 | 51,50 | 18 549 | 72,29 |