Grundläggande statistik
| Institutionella ägare | 290 total, 281 long only, 2 short only, 7 long/short - change of 0,35% MRQ |
| Genomsnittlig portföljallokering | 0.1014 % - change of −9,06% MRQ |
| Institutionella aktier (lång) | 173 438 953 (ex 13D/G) - change of −3,43MM shares −1,94% MRQ |
| Institutionellt värde (lång) | $ 1 272 967 USD ($1000) |
Institutionellt ägande och aktieägare
United Microelectronics Corporation - Depositary Receipt (Common Stock) (US:UMC) har 290 Institutionella ägare och aktieägare som har lämnat in 13D/G- eller 13F-formulär till Securities Exchange Commission (SEC). Dessa institut innehar totalt 173,438,953 aktier. Största aktieägare inkluderar BlackRock, Inc., Morgan Stanley, UBS Group AG, Vanguard Group Inc, SOXX - iShares PHLX Semiconductor ETF, Rafferty Asset Management, LLC, Bank Of America Corp /de/, VEIEX - Vanguard Emerging Markets Stock Index Fund Investor Shares, SOXL - Direxion Daily Semiconductor Bull 3X Shares, and Goldman Sachs Group Inc .
United Microelectronics Corporation - Depositary Receipt (Common Stock) (NYSE:UMC) Institutionell ägarstruktur visar institutioners och fonders nuvarande positioner i företaget, samt de senaste förändringarna i positionernas storlek. Större aktieägare kan vara enskilda investerare, fonder, hedgefonder eller institutioner. Bilaga 13D visar att investeraren äger (eller ägde) mer än 5% av företaget och avser (eller avsåg) att aktivt eftersträva en förändring av affärsstrategin. Schedule 13G indikerar en passiv investering på över 5%.
The share price as of September 8, 2025 is 6,89 / share. Previously, on September 9, 2024, the share price was 8,43 / share. This represents a decline of 18,27% over that period.

Fondsentimentets poäng
Fondsentimentet poängen(fka Ägarackumulation-poäng) visar vilka aktier som är mest köpta av fonder. Det är resultatet av en sofistikerad kvantitativ flerfaktormodell som identifierar företag med de högsta nivåerna av institutionell ackumulering. Poängsättningsmodellen använder en kombination av den totala ökningen av redovisade ägare, förändringarna i portföljallokeringarna för dessa ägare och andra mått. Siffran sträcker sig från 0 till 100, där högre siffror indikerar en högre nivå av ackumulering i förhållande till sina konkurrenter, och 50 är genomsnittet.
Uppdateringsfrekvens: Dagligen
Se Ownership Explorer, som innehåller en lista över de högst rankade företagen.
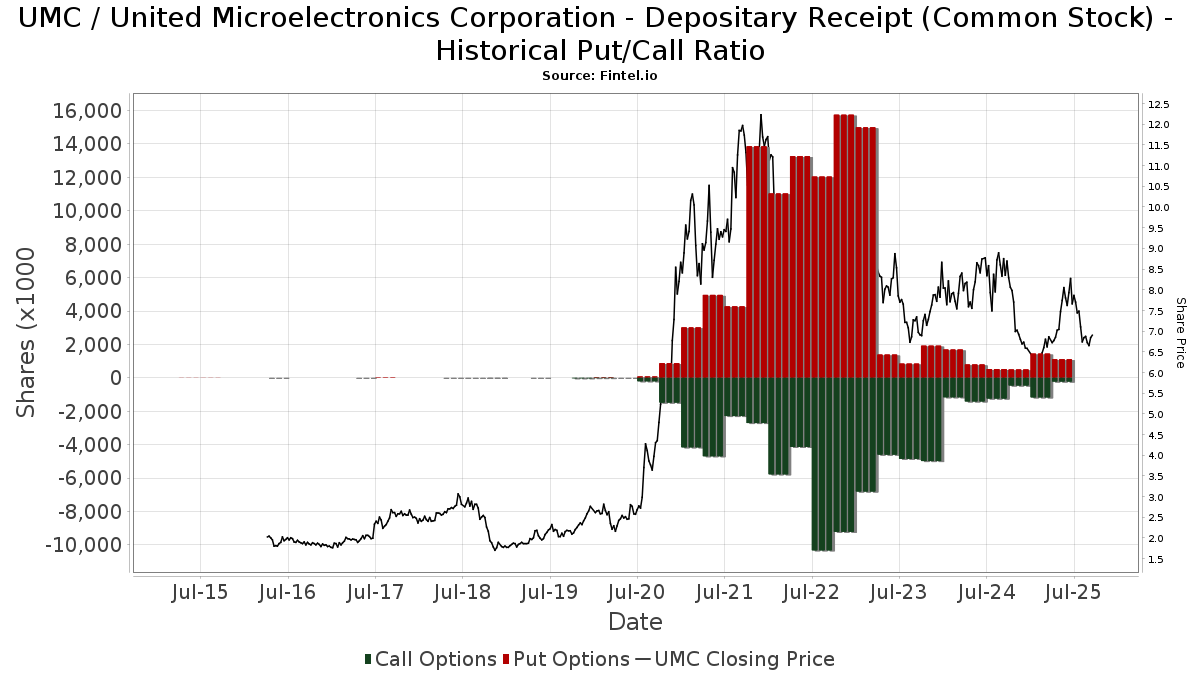
Institutionell sälj/köp-kvot
Förutom att rapportera vanliga eget kapital- och skuldemissioner måste institutioner med mer än 100MM tillgångar under förvaltning också avslöja sina innehav av sälj- och köpoptioner. Eftersom säljoptioner i allmänhet indikerar ett negativt sentiment och köpoptioner indikerar ett positivt sentiment, kan vi få en uppfattning om det övergripande institutionella sentimentet genom att plotta förhållandet mellan säljoptioner och köpoptioner. Diagrammet till höger visar det historiska förhållandet mellan sälj- och köpoptioner för detta instrument.
Genom att använda sälj/köp-kvoten som en indikator på aktieägarnas sentiment undviker man en av de största bristerna med att använda det totala institutionella ägandet, nämligen att en betydande del av de förvaltade tillgångarna investeras passivt för att följa index. Passivt förvaltade fonder köper vanligtvis inte optioner, så indikatorn för sälj/köp-kvoten ger en bättre bild av stämningen i aktivt förvaltade fonder.
13F- och NPORT-arkiveringar
Detaljer om 13F-arkiveringar är gratis. Detaljer om NP-arkiveringar kräver ett premiummedlemskap. Gröna rader indikerar nya positioner. Röda rader indikerar stängda positioner. Klicka på länk symbolen för att se hela transaktionshistoriken.
Uppgradera
för att låsa upp premiumdata och exportera till Excel ![]() .
.
| Fil Datum | Källa | Investerare | Typ | Genomsnittligt pris (beräknat) |
Aktier | Δ Aktier (%) |
Rapporterat värde (1000 USD) |
Δ Värde (%) |
Portföljallokering (%) |
|
|---|---|---|---|---|---|---|---|---|---|---|
| 2025-08-14 | 13F | Aquatic Capital Management LLC | 0 | −100,00 | 0 | |||||
| 2025-08-18 | 13F | Geneos Wealth Management Inc. | 117 | 1 | ||||||
| 2025-08-14 | 13F | Nomura Holdings Inc | 0 | −100,00 | 0 | |||||
| 2025-08-28 | NP | GMF - SPDR(R) S&P(R) EMERGING ASIA PACIFIC ETF | 157 044 | −6,51 | 1 201 | 0,00 | ||||
| 2025-05-02 | 13F | Capital A Wealth Management, LLC | 504 | 0,00 | 4 | 0,00 | ||||
| 2025-08-27 | 13F/A | Squarepoint Ops LLC | Call | 0 | −100,00 | 0 | −100,00 | |||
| 2025-07-21 | 13F | Hennessy Advisors Inc | 14 908 | −25,82 | 114 | −20,28 | ||||
| 2025-08-08 | 13F | Wealth Alliance | 10 042 | 77 | ||||||
| 2025-08-12 | 13F | CIBC Private Wealth Group, LLC | 2 024 | 47,52 | 15 | 87,50 | ||||
| 2025-08-14 | 13F | Mml Investors Services, Llc | 10 507 | 0 | ||||||
| 2025-08-04 | 13F | Simon Quick Advisors, Llc | 22 710 | 51,17 | 174 | 61,68 | ||||
| 2025-06-26 | NP | HFIGX - Hartford Schroders Diversified Growth Fund Class I | 10 628 | 31,23 | 75 | 60,87 | ||||
| 2025-06-26 | NP | DFCEX - Emerging Markets Core Equity Portfolio - Institutional Class This fund is a listed as child fund of Dimensional Fund Advisors Lp and if that institution has disclosed ownership in this security, then these positions will not be double counted when calculating total shares and total value | 82 862 | 0,00 | 583 | 21,97 | ||||
| 2025-08-12 | 13F/A | Cozad Asset Management Inc | 12 829 | 0,00 | 98 | 7,69 | ||||
| 2025-08-14 | 13F | Old Mission Capital Llc | 0 | −100,00 | 0 | |||||
| 2025-08-13 | 13F | Russell Investments Group, Ltd. | 171 | 17 000,00 | 1 | |||||
| 2025-06-30 | NP | TRFM - AAM Transformers ETF | 21 837 | 154 | ||||||
| 2025-08-11 | 13F | Vanguard Group Inc | 14 825 471 | −5,64 | 113 415 | 0,95 | ||||
| 2025-08-14 | 13F | SIH Partners, LLLP | Put | 0 | −100,00 | 0 | ||||
| 2025-06-30 | NP | VMNVX - Vanguard Global Minimum Volatility Fund Admiral Shares | 4 743 496 | −11,55 | 33 394 | 7,73 | ||||
| 2025-07-25 | 13F | Johnson Investment Counsel Inc | 29 000 | −32,24 | 222 | −27,78 | ||||
| 2025-08-07 | 13F | Parkside Financial Bank & Trust | 1 020 | 61,90 | 8 | 75,00 | ||||
| 2025-08-14 | 13F | Ubs Asset Management Americas Inc | 25 600 | −88,09 | 196 | −87,31 | ||||
| 2025-08-14 | 13F | Atomi Financial Group, Inc. | 50 360 | 40,49 | 385 | 50,39 | ||||
| 2025-06-27 | NP | SOXL - Direxion Daily Semiconductor Bull 3X Shares | 6 757 244 | 17,13 | 47 571 | 42,66 | ||||
| 2025-08-05 | 13F | Crestwood Advisors Group LLC | 19 614 | 9,26 | 150 | 17,19 | ||||
| 2025-08-27 | 13F/A | Squarepoint Ops LLC | 148 637 | −16,61 | 1 137 | −10,75 | ||||
| 2025-08-08 | 13F | Allianz Se | 0 | −100,00 | 0 | |||||
| 2025-08-14 | 13F | CoreCap Advisors, LLC | 2 805 | 0,00 | 21 | 5,00 | ||||
| 2025-08-14 | 13F | Goldman Sachs Group Inc | 5 585 582 | −1,24 | 42 730 | 5,67 | ||||
| 2025-08-26 | NP | Profunds - Profund Vp Emerging Markets | 39 885 | 11,17 | 305 | 19,14 | ||||
| 2025-08-14 | 13F | Integrated Wealth Concepts LLC | 13 298 | 102 | ||||||
| 2025-05-15 | 13F | Wolverine Trading, Llc | Call | 0 | −100,00 | 0 | ||||
| 2025-08-13 | 13F | Jones Financial Companies Lllp | 5 262 | 43,77 | 40 | 73,91 | ||||
| 2025-08-14 | 13F | LMR Partners LLP | 0 | −100,00 | 0 | |||||
| 2025-08-14 | 13F | Symmetry Investments LP | Call | 0 | −100,00 | 0 | ||||
| 2025-04-01 | NP | CVY - Invesco Zacks Multi-Asset Income ETF This fund is a listed as child fund of Invesco Ltd. and if that institution has disclosed ownership in this security, then these positions will not be double counted when calculating total shares and total value | 137 461 | 0,09 | 795 | −15,44 | ||||
| 2025-07-21 | 13F | Ameriflex Group, Inc. | 267 | −50,74 | 2 | −33,33 | ||||
| 2025-08-13 | 13F | Quantbot Technologies LP | 7 971 | −97,28 | 61 | −97,14 | ||||
| 2025-07-17 | 13F | HB Wealth Management, LLC | 13 471 | 103 | ||||||
| 2025-04-29 | 13F | Bank of New York Mellon Corp | 0 | −100,00 | 0 | |||||
| 2025-08-13 | 13F | EverSource Wealth Advisors, LLC | 21 111 | 51,08 | 161 | 62,63 | ||||
| 2025-08-13 | 13F | Natixis Advisors, L.p. | 163 518 | −5,05 | 1 | 0,00 | ||||
| 2025-07-23 | 13F | Prime Capital Investment Advisors, LLC | 14 249 | −32,78 | 109 | −27,81 | ||||
| 2025-07-17 | 13F | Clean Yield Group | 218 | 0,00 | 2 | 0,00 | ||||
| 2025-08-11 | 13F | Frank, Rimerman Advisors LLC | 62 082 | 475 | ||||||
| 2025-05-15 | 13F | Angeles Investment Advisors, LLC | 0 | −100,00 | 0 | |||||
| 2025-08-05 | 13F | Key FInancial Inc | 1 200 | 0,00 | 9 | 12,50 | ||||
| 2025-05-14 | 13F | Fisher Asset Management, LLC | 0 | −100,00 | 0 | |||||
| 2025-08-14 | 13F | Axa S.a. | 63 004 | 0,00 | 482 | 6,89 | ||||
| 2025-08-12 | 13F | Coldstream Capital Management Inc | 0 | −100,00 | 0 | |||||
| 2025-08-13 | 13F | Invesco Ltd. | 87 636 | −23,66 | 670 | −18,29 | ||||
| 2025-08-12 | 13F | SRS Capital Advisors, Inc. | 1 293 | 10 | ||||||
| 2025-08-13 | 13F | Guggenheim Capital Llc | 350 382 | −5,26 | 2 680 | 1,36 | ||||
| 2025-08-14 | 13F | Jain Global LLC | 49 197 | 376 | ||||||
| 2025-05-15 | 13F | MIRAE ASSET GLOBAL ETFS HOLDINGS Ltd. | 0 | −100,00 | 0 | |||||
| 2025-08-14 | 13F | SIH Partners, LLLP | Call | 0 | −100,00 | 0 | ||||
| 2025-08-13 | 13F | Jump Financial, LLC | 0 | −100,00 | 0 | |||||
| 2025-07-22 | 13F | Carolina Wealth Advisors, LLC | 30 | 0 | ||||||
| 2025-08-14 | 13F | Optiver Holding B.V. | 1 | 0 | ||||||
| 2025-07-31 | 13F | Nisa Investment Advisors, Llc | 500 | 0,00 | 4 | 33,33 | ||||
| 2025-07-24 | 13F | Callan Family Office, LLC | 54 754 | 406,79 | 419 | 442,86 | ||||
| 2025-08-13 | 13F | Bollard Group LLC | 0 | −100,00 | 0 | |||||
| 2025-08-27 | NP | RYWTX - Emerging Markets 2x Strategy Fund Class A | 12 432 | 147,90 | 95 | 171,43 | ||||
| 2025-05-13 | 13F | Arrowpoint Investment Partners (Singapore) Pte. Ltd. | 0 | −100,00 | 0 | |||||
| 2025-08-13 | 13F | Arrowstreet Capital, Limited Partnership | 317 271 | 2 427 | ||||||
| 2025-08-14 | 13F | Hrt Financial Lp | 0 | −100,00 | 0 | |||||
| 2025-07-14 | 13F | Abound Wealth Management | 160 | 0,00 | 1 | 0,00 | ||||
| 2025-08-14 | 13F | Man Group plc | 19 346 | −90,33 | 148 | −89,72 | ||||
| 2025-07-24 | 13F | PDS Planning, Inc | 70 758 | 3,49 | 541 | 10,86 | ||||
| 2025-07-25 | 13F | Sequoia Financial Advisors, LLC | 176 603 | 29,43 | 1 351 | 38,56 | ||||
| 2025-07-28 | 13F | Kiker Wealth Management, LLC | 670 | 0,00 | 5 | 25,00 | ||||
| 2025-08-12 | 13F | Park Square Financial Group, LLC | 524 | 0,00 | 4 | 33,33 | ||||
| 2025-08-14 | 13F | Jane Street Group, Llc | Call | 0 | −100,00 | 0 | ||||
| 2025-08-14 | 13F | Jane Street Group, Llc | 0 | −100,00 | 0 | |||||
| 2025-08-14 | 13F | Millennium Management Llc | 58 780 | −99,26 | 450 | −99,20 | ||||
| 2025-05-14 | 13F | KilterHowling LLC | 0 | −100,00 | 0 | |||||
| 2025-07-18 | 13F | BSW Wealth Partners | 35 482 | −3,36 | 271 | 3,44 | ||||
| 2025-07-28 | 13F | BRYN MAWR TRUST Co | 325 | 0,00 | 2 | 0,00 | ||||
| 2025-07-11 | 13F | Viking Fund Management Llc | 12 000 | 92 | ||||||
| 2025-08-12 | 13F | Enterprise Financial Services Corp | 12 008 | 92 | ||||||
| 2025-08-12 | 13F | MAI Capital Management | 21 104 | 6 934,67 | 161 | 7 950,00 | ||||
| 2025-08-25 | 13F/A | Neuberger Berman Group LLC | 62 104 | 475 | ||||||
| 2025-08-27 | NP | RYDEX VARIABLE TRUST - Electronics Fund Variable Annuity | 14 808 | −61,56 | 113 | −58,91 | ||||
| 2025-08-14 | 13F | Ameriprise Financial Inc | 30 574 | −2,34 | 245 | 9,42 | ||||
| 2025-07-28 | NP | NSI - National Security Emerging Markets Index ETF | 29 978 | 38,48 | 228 | 64,03 | ||||
| 2025-08-13 | 13F | Walleye Trading LLC | Put | 23 100 | −93,35 | 177 | −92,91 | |||
| 2025-08-14 | 13F | Vident Advisory, LLC | 569 810 | 50,83 | 4 359 | 61,38 | ||||
| 2025-08-29 | NP | MPLAX - Praxis International Index Fund Class A | 177 976 | −10,76 | 1 362 | −4,49 | ||||
| 2025-04-28 | 13F | Vontobel Holding Ltd. | 0 | −100,00 | 0 | |||||
| 2025-08-12 | 13F | Ameritas Investment Partners, Inc. | 2 | 0,00 | 0 | |||||
| 2025-08-14 | 13F/A | Barclays Plc | 5 257 834 | 43,33 | 40 | 53,85 | ||||
| 2025-05-15 | 13F | Laird Norton Trust Company, Llc | 0 | −100,00 | 0 | |||||
| 2025-07-23 | 13F | Canopy Partners, LLC | 24 325 | −9,17 | 186 | −2,62 | ||||
| 2025-05-15 | 13F | Gts Securities Llc | 0 | −100,00 | 0 | |||||
| 2025-08-14 | 13F | Stifel Financial Corp | 126 016 | −0,50 | 964 | 6,52 | ||||
| 2025-08-13 | 13F | First Trust Advisors Lp | 112 176 | −17,81 | 858 | −12,00 | ||||
| 2025-08-14 | 13F | Fmr Llc | 220 351 | −60,04 | 1 686 | −57,26 | ||||
| 2025-08-11 | 13F | Principal Securities, Inc. | 367 | 28,32 | 3 | 100,00 | ||||
| 2025-08-13 | 13F | Marshall Wace, Llp | 0 | −100,00 | 0 | |||||
| 2025-07-21 | 13F | Mirae Asset Global Investments Co., Ltd. | 1 031 | 8 | ||||||
| 2025-08-12 | 13F | Global Retirement Partners, LLC | 10 457 | 1,69 | 80 | 19,70 | ||||
| 2025-08-12 | 13F | Proequities, Inc. | Put | 0 | 0 | |||||
| 2025-08-12 | 13F | Proequities, Inc. | Call | 0 | 0 | |||||
| 2025-08-12 | 13F | Proequities, Inc. | 0 | 0 | ||||||
| 2025-08-14 | 13F | Henry James International Management Inc. | 14 000 | 0,50 | 107 | 8,08 | ||||
| 2025-05-15 | 13F | Qube Research & Technologies Ltd | 0 | −100,00 | 0 | |||||
| 2025-08-14 | 13F | Federation des caisses Desjardins du Quebec | 2 500 | 25,00 | 19 | 35,71 | ||||
| 2025-08-01 | 13F | Ashton Thomas Private Wealth, LLC | 0 | −100,00 | 0 | |||||
| 2025-08-01 | 13F | Bessemer Group Inc | 12 515 | 0,00 | 0 | |||||
| 2025-08-13 | 13F | West Family Investments, Inc. | 187 696 | 37,23 | 1 436 | 46,88 | ||||
| 2025-08-14 | 13F | State Street Corp | 4 292 954 | 8,22 | 34 449 | 21,46 | ||||
| 2025-08-14 | 13F | Scientech Research LLC | 0 | −100,00 | 0 | |||||
| 2025-08-12 | 13F | BlackRock, Inc. | 24 317 060 | 6,67 | 186 026 | 14,13 | ||||
| 2025-08-14 | 13F/A | Skopos Labs, Inc. | 40 994 | 186,37 | 314 | 206,86 | ||||
| 2025-07-24 | 13F | Us Bancorp \de\ | 266 887 | 1,87 | 2 042 | 8,97 | ||||
| 2025-08-04 | 13F | Atria Investments Llc | 20 404 | −0,42 | 156 | 6,85 | ||||
| 2025-08-07 | 13F | Sierra Ocean, Llc | 731 | −16,84 | 6 | −16,67 | ||||
| 2025-08-14 | 13F | Prestige Wealth Management Group LLC | 661 | 0,00 | 5 | 25,00 | ||||
| 2025-05-09 | 13F | Headlands Technologies LLC | 0 | −100,00 | 0 | |||||
| 2025-08-14 | 13F | Millennium Management Llc | Call | 0 | −100,00 | 0 | −100,00 | |||
| 2025-08-13 | 13F | Walleye Capital LLC | Call | 0 | −100,00 | 0 | −100,00 | |||
| 2025-08-13 | 13F | Twin Peaks Wealth Advisors, LLC | 323 | 2 | ||||||
| 2025-07-15 | 13F | Ballentine Partners, LLC | 183 254 | 16,11 | 1 402 | 24,20 | ||||
| 2025-08-06 | 13F | Golden State Wealth Management, LLC | 0 | −100,00 | 0 | |||||
| 2025-08-14 | 13F | Ancora Advisors, LLC | 381 | 3 | ||||||
| 2025-07-16 | 13F | Signaturefd, Llc | 232 860 | 6,33 | 1 781 | 13,80 | ||||
| 2025-07-31 | 13F | Caitong International Asset Management Co., Ltd | 0 | −100,00 | 0 | |||||
| 2025-04-29 | 13F | Lee Danner & Bass Inc | 0 | −100,00 | 0 | |||||
| 2025-08-06 | 13F | Valued Wealth Advisors LLC | 423 | 0,00 | 3 | 0,00 | ||||
| 2025-08-14 | 13F | Colony Group, LLC | 16 417 | 22,12 | 126 | 30,21 | ||||
| 2025-05-15 | 13F | Graham Capital Management, L.P. | 0 | −100,00 | 0 | |||||
| 2025-08-12 | 13F | LPL Financial LLC | 58 489 | −5,46 | 447 | 1,13 | ||||
| 2025-08-15 | 13F | CI Private Wealth, LLC | 320 301 | 83,51 | 2 450 | 96,47 | ||||
| 2025-08-13 | 13F | Quadrant Capital Group Llc | 397 602 | 154,54 | 3 042 | 172,49 | ||||
| 2025-07-17 | 13F | CogentBlue Wealth Advisors, LLC | 10 372 | −50,04 | 79 | −46,62 | ||||
| 2025-08-14 | 13F | Susquehanna International Group, Llp | 360 128 | −45,58 | 2 755 | −41,79 | ||||
| 2025-06-30 | NP | VT - Vanguard Total World Stock Index Fund ETF Shares | 51 487 | 0,00 | 362 | 21,89 | ||||
| 2025-08-12 | 13F | Dimensional Fund Advisors Lp | 1 743 615 | 21,75 | 13 339 | 30,27 | ||||
| 2025-08-14 | 13F | Susquehanna International Group, Llp | Call | 20 900 | −94,02 | 160 | −93,63 | |||
| 2025-08-14 | 13F | Susquehanna International Group, Llp | Put | 166 300 | 351,90 | 1 272 | 383,65 | |||
| 2025-08-13 | 13F | Walleye Capital LLC | Put | 51 200 | 25 500,00 | 392 | 39 000,00 | |||
| 2025-08-13 | 13F | Walleye Capital LLC | 688 | −99,05 | 5 | −99,03 | ||||
| 2025-05-12 | 13F | Aigen Investment Management, Lp | 0 | −100,00 | 0 | |||||
| 2025-06-27 | NP | SOXY - YieldMax(TM) Target 12(TM) Semiconductor Option Income ETF | 4 190 | 25,00 | 29 | 52,63 | ||||
| 2025-07-22 | 13F | Valeo Financial Advisors, LLC | 10 683 | 82 | ||||||
| 2025-08-08 | 13F/A | Ignite Planners, LLC | 113 172 | 1,56 | 847 | 8,32 | ||||
| 2025-08-14 | 13F | Banque Transatlantique SA | 0 | −100,00 | 0 | |||||
| 2025-08-13 | 13F | Schroder Investment Management Group | 4 237 787 | −1,45 | 32 419 | 15,10 | ||||
| 2025-05-01 | 13F | Bleakley Financial Group, LLC | 0 | −100,00 | 0 | −100,00 | ||||
| 2025-07-11 | 13F/A | Umb Bank N A/mo | 1 725 | 0,00 | 13 | 8,33 | ||||
| 2025-07-29 | 13F | Private Trust Co Na | 0 | −100,00 | 0 | |||||
| 2025-04-30 | 13F | Banque Pictet & Cie Sa | 0 | −100,00 | 0 | |||||
| 2025-08-15 | 13F | Morgan Stanley | 21 814 127 | 21,18 | 166 878 | 29,65 | ||||
| 2025-04-22 | NP | GINN - Goldman Sachs Innovate Equity ETF | 45 381 | −8,07 | 293 | −12,31 | ||||
| 2025-05-15 | 13F | DZ BANK AG Deutsche Zentral Genossenschafts Bank, Frankfurt am Main | 0 | −100,00 | 0 | |||||
| 2025-08-14 | 13F | Two Sigma Advisers, Lp | 11 700 | −96,64 | 90 | −96,42 | ||||
| 2025-08-14 | 13F | GWM Advisors LLC | 700 | 0,00 | 5 | 0,00 | ||||
| 2025-07-24 | 13F | Jfs Wealth Advisors, Llc | 2 826 | 0,00 | 22 | 5,00 | ||||
| 2025-05-05 | 13F | Lindbrook Capital, Llc | 28 053 | 12,30 | 201 | 23,46 | ||||
| 2025-05-08 | 13F | Harbour Investments, Inc. | 0 | −100,00 | 0 | |||||
| 2025-07-14 | 13F | Abacus Wealth Partners, LLC | 23 169 | 177 | ||||||
| 2025-06-30 | NP | VGTSX - Vanguard Total International Stock Index Fund Investor Shares | 1 006 015 | 0,00 | 7 082 | 21,81 | ||||
| 2025-08-14 | 13F | Rafferty Asset Management, LLC | 8 403 064 | 50,68 | 64 283 | 61,22 | ||||
| 2025-08-12 | 13F | Steward Partners Investment Advisory, Llc | 9 | 0 | ||||||
| 2025-06-30 | NP | VEIEX - Vanguard Emerging Markets Stock Index Fund Investor Shares | 6 767 268 | −4,92 | 47 642 | 15,81 | ||||
| 2025-07-15 | 13F | Foster Victor Wealth Advisors, LLC | 23 578 | −2,06 | 182 | 9,70 | ||||
| 2025-08-13 | 13F | Walleye Trading LLC | 0 | −100,00 | 0 | −100,00 | ||||
| 2025-08-13 | 13F | Walleye Trading LLC | Call | 0 | −100,00 | 0 | −100,00 | |||
| 2025-05-15 | 13F | Bayesian Capital Management, LP | 0 | −100,00 | 0 | |||||
| 2025-08-11 | 13F | Citigroup Inc | 3 727 817 | −38,19 | 28 518 | −33,86 | ||||
| 2025-08-14 | 13F | Xponance, Inc. | 17 665 | 0,93 | 135 | 8,00 | ||||
| 2025-08-07 | 13F | Hennion & Walsh Asset Management, Inc. | 160 373 | −12,49 | 1 227 | −6,41 | ||||
| 2025-08-14 | 13F | Smartleaf Asset Management LLC | 3 574 | 27 | ||||||
| 2025-07-31 | 13F | Buckingham Strategic Partners | 24 685 | −33,24 | 189 | −28,79 | ||||
| 2025-08-29 | NP | FRDM - Freedom 100 Emerging Markets ETF | 1 191 434 | 16,76 | 9 114 | 24,92 | ||||
| 2025-05-14 | 13F | Credit Agricole S A | 210 | 0,00 | 2 | 0,00 | ||||
| 2025-08-13 | 13F | Victory Capital Management Inc | 104 945 | 0,00 | 803 | 6,93 | ||||
| 2025-06-27 | NP | SPTE - SP Funds S&P Global Technology ETF | 63 394 | −37,72 | 446 | −24,15 | ||||
| 2025-07-08 | 13F | Parallel Advisors, LLC | 132 375 | 17,06 | 1 013 | 25,56 | ||||
| 2025-08-14 | 13F | Toroso Investments, LLC | 110 375 | 24,76 | 844 | 33,54 | ||||
| 2025-06-30 | NP | VEU - Vanguard FTSE All-World ex-US Index Fund ETF Shares | 2 283 026 | 0,00 | 16 073 | 21,80 | ||||
| 2025-08-14 | 13F | Wells Fargo & Company/mn | 5 800 | 74,54 | 44 | 91,30 | ||||
| 2025-08-04 | 13F | Creekmur Asset Management LLC | 1 | 0,00 | 0 | |||||
| 2025-08-01 | 13F | Y-Intercept (Hong Kong) Ltd | 970 407 | 84,38 | 7 424 | 97,26 | ||||
| 2025-08-14 | 13F | KADENSA CAPITAL Ltd | 1 335 392 | 13,63 | 10 216 | 21,58 | ||||
| 2025-08-14 | 13F | Royal Bank Of Canada | 11 471 | 118,70 | 87 | 128,95 | ||||
| 2025-07-14 | 13F | UMA Financial Services, Inc. | 375 | 86,57 | 3 | 100,00 | ||||
| 2025-08-08 | 13F | Larson Financial Group LLC | 745 | 6 | ||||||
| 2025-07-30 | 13F | Ethic Inc. | 343 574 | −0,01 | 2 639 | 10,01 | ||||
| 2025-05-14 | 13F | Groupama Asset Managment | 0 | −100,00 | 0 | |||||
| 2025-08-08 | 13F | Candriam Luxembourg S.C.A. | 28 764 | 0,00 | 220 | 7,32 | ||||
| 2025-08-07 | 13F | Profund Advisors Llc | 122 831 | 2,61 | 940 | 9,82 | ||||
| 2025-07-29 | NP | RBB FUND, INC. - Aquarius International Fund | 36 418 | 0,00 | 277 | 18,38 | ||||
| 2025-08-08 | 13F | Creative Planning | 1 689 542 | 33,98 | 12 925 | 43,35 | ||||
| 2025-07-28 | 13F | Moran Wealth Management, LLC | 672 124 | 1,63 | 5 142 | 8,74 | ||||
| 2025-08-12 | 13F | Mizuho Securities Co. Ltd. | 501 | 4 | ||||||
| 2025-08-06 | 13F | Savant Capital, LLC | 29 336 | 224 | ||||||
| 2025-08-28 | NP | SPGM - SPDR(R) Portfolio MSCI Global Stock Market ETF | 85 532 | 2,96 | 654 | 10,29 | ||||
| 2025-07-11 | 13F | Farther Finance Advisors, LLC | 4 240 | −14,86 | 32 | −5,88 | ||||
| 2025-08-12 | 13F | Advisors Asset Management, Inc. | 235 539 | 10,30 | 1 802 | 18,02 | ||||
| 2025-08-14 | 13F | Wetherby Asset Management Inc | 326 804 | 12,33 | 2 502 | 32,47 | ||||
| 2025-07-31 | 13F | Resonant Capital Advisors, LLC | 14 592 | 119 | ||||||
| 2025-08-12 | 13F | Clear Street Markets Llc | Put | 200 | 2 | |||||
| 2025-08-12 | 13F | Clear Street Markets Llc | 5 600 | 43 | ||||||
| 2025-08-14 | 13F | Silvercrest Asset Management Group Llc | 0 | −100,00 | 0 | |||||
| 2025-07-22 | 13F | Valley National Advisers Inc | 0 | −100,00 | 0 | |||||
| 2025-03-28 | NP | HAOSX - Harbor Overseas Fund Institutional Class | 52 590 | −26,82 | 304 | −38,29 | ||||
| 2025-08-08 | 13F | Mitsubishi UFJ Trust & Banking Corp | 10 300 | 79 | ||||||
| 2025-08-13 | 13F | Capital Fund Management S.a. | 35 800 | 274 | ||||||
| 2025-07-25 | 13F | LRI Investments, LLC | 364 | 0,00 | 3 | 0,00 | ||||
| 2025-06-26 | NP | DEXC - Dimensional Emerging Markets ex China Core Equity ETF | 76 000 | 18,75 | 535 | 44,99 | ||||
| 2025-05-15 | 13F | CAPROCK Group, Inc. | 115 769 | −10,28 | 828 | −1,19 | ||||
| 2025-07-30 | NP | AIS - VistaShares Artificial Intelligence Supercycle ETF | 4 991 | 187,50 | 38 | 236,36 | ||||
| 2025-08-04 | 13F | Migdal Insurance & Financial Holdings Ltd. | 0 | −100,00 | 0 | |||||
| 2025-08-05 | 13F | NewSquare Capital LLC | 1 052 | −10,09 | 8 | 0,00 | ||||
| 2025-08-11 | 13F | EntryPoint Capital, LLC | 18 812 | −3,71 | 144 | 2,88 | ||||
| 2025-08-12 | 13F | Jpmorgan Chase & Co | Call | 0 | −100,00 | 0 | −100,00 | |||
| 2025-08-01 | 13F | Envestnet Asset Management Inc | 90 114 | −4,23 | 689 | 2,53 | ||||
| 2025-06-26 | NP | SGIDX - Steward Global Equity Income Fund Class A | 541 403 | 8,58 | 3 811 | 32,23 | ||||
| 2025-05-08 | 13F | Waldron Private Wealth LLC | 0 | −100,00 | 0 | |||||
| 2025-08-14 | 13F | Bnp Paribas Arbitrage, Sa | Call | 0 | −100,00 | 0 | ||||
| 2025-06-26 | NP | DFAE - Dimensional Emerging Core Equity Market ETF | 357 000 | 4,08 | 2 513 | 26,79 | ||||
| 2025-08-12 | 13F | Prudential Financial Inc | 23 570 | 0,00 | 180 | 7,14 | ||||
| 2025-08-28 | NP | SPEM - SPDR(R) Portfolio Emerging Markets ETF | 3 729 594 | 8,86 | 28 531 | 16,47 | ||||
| 2025-05-16 | 13F | Coppell Advisory Solutions LLC | 0 | −100,00 | 0 | |||||
| 2025-07-24 | 13F | IFP Advisors, Inc | 535 | 25,59 | 4 | 33,33 | ||||
| 2025-08-14 | 13F | Farringdon Capital, Ltd. | 22 816 | 175 | ||||||
| 2025-08-14 | 13F | Glenmede Investment Management, LP | 27 705 | 212 | ||||||
| 2025-08-14 | 13F | D. E. Shaw & Co., Inc. | 477 789 | −30,38 | 3 655 | −25,50 | ||||
| 2025-08-14 | 13F | Mercer Global Advisors Inc /adv | 43 028 | −5,80 | 329 | 0,92 | ||||
| 2025-08-11 | 13F | Pinnacle Wealth Planning Services, Inc. | 25 754 | −22,00 | 197 | −16,53 | ||||
| 2025-03-31 | NP | GIAX - Nicholas Global Equity and Income ETF | 138 029 | 112,27 | 798 | 79,50 | ||||
| 2025-08-07 | 13F | Aviva Plc | 13 807 | 0,00 | 106 | 7,14 | ||||
| 2025-08-06 | 13F | Commonwealth Equity Services, Llc | 16 120 | −14,72 | 0 | |||||
| 2025-08-12 | 13F | O'shaughnessy Asset Management, Llc | 385 531 | 25,03 | 2 949 | 33,80 | ||||
| 2025-07-22 | 13F | IMC-Chicago, LLC | Call | 0 | −100,00 | 0 | −100,00 | |||
| 2025-08-13 | 13F | Cerity Partners LLC | 242 862 | −25,09 | 1 859 | −19,84 | ||||
| 2025-08-14 | 13F | UBS Group AG | 16 888 821 | 9,34 | 129 199 | 16,98 | ||||
| 2025-08-14 | 13F | UBS Group AG | Call | 50 000 | 382 | |||||
| 2025-08-11 | 13F | Bell Investment Advisors, Inc | 1 176 | 72,18 | 9 | 100,00 | ||||
| 2025-07-25 | 13F | JustInvest LLC | 365 708 | 31,80 | 2 798 | 41,05 | ||||
| 2025-07-25 | 13F | Allspring Global Investments Holdings, LLC | 13 281 | −95,19 | 101 | −94,76 | ||||
| 2025-07-30 | NP | APIE - ActivePassive International Equity ETF | 167 502 | −19,75 | 1 275 | −5,35 | ||||
| 2025-08-13 | 13F | Safe Harbor Fiduciary, LLC | 300 | 0,00 | 2 | 0,00 | ||||
| 2025-05-15 | 13F | Bridgefront Capital, LLC | 0 | −100,00 | 0 | |||||
| 2025-08-14 | 13F | Aqr Capital Management Llc | 1 445 478 | 0,69 | 11 058 | 7,73 | ||||
| 2025-07-18 | 13F | Generali Investments CEE, investicni spolecnost, a.s. | 170 779 | 0,00 | 1 306 | 6,96 | ||||
| 2025-07-17 | 13F | Greenleaf Trust | 150 786 | 0,71 | 1 154 | 7,76 | ||||
| 2025-08-04 | 13F | Assetmark, Inc | 680 | 5 | ||||||
| 2025-08-05 | 13F | GPS Wealth Strategies Group, LLC | 768 | 0,00 | 6 | 0,00 | ||||
| 2025-08-11 | 13F | Inspire Advisors, LLC | 18 355 | −5,57 | 140 | 1,45 | ||||
| 2025-08-14 | 13F | Beaird Harris Wealth Management, LLC | 1 000 | 0,00 | 8 | 0,00 | ||||
| 2025-08-07 | 13F | Vise Technologies, Inc. | 192 714 | 614,05 | 1 474 | 742,29 | ||||
| 2025-08-11 | 13F | HighTower Advisors, LLC | 22 054 | −26,87 | 169 | −21,86 | ||||
| 2025-08-29 | NP | SA FUNDS INVESTMENT TRUST - SA Emerging Markets Value Fund | 56 252 | 0,00 | 430 | 6,97 | ||||
| 2025-08-12 | 13F | Pathstone Holdings, LLC | 99 535 | 10,49 | 766 | 18,79 | ||||
| 2025-08-08 | 13F | SBI Securities Co., Ltd. | 11 958 | −1,84 | 91 | 4,60 | ||||
| 2025-06-30 | 13F/A | Deutsche Bank Ag\ | 0 | −100,00 | 0 | |||||
| 2025-07-25 | 13F | Cwm, Llc | 19 213 | −6,41 | 0 | |||||
| 2025-08-14 | 13F | Group One Trading, L.p. | Put | 100 | −97,22 | 1 | −100,00 | |||
| 2025-08-14 | 13F | Group One Trading, L.p. | Call | 73 600 | −69,97 | 563 | −67,87 | |||
| 2025-08-13 | 13F | Northwestern Mutual Wealth Management Co | 1 956 | 15 | ||||||
| 2025-08-19 | 13F | Asset Dedication, LLC | 0 | −100,00 | 0 | |||||
| 2025-08-28 | NP | SOXX - iShares PHLX Semiconductor ETF | 11 448 043 | 0,88 | 87 578 | 7,93 | ||||
| 2025-08-14 | 13F | Group One Trading, L.p. | 521 | 4 | ||||||
| 2025-08-15 | 13F | Tower Research Capital LLC (TRC) | 6 344 | −89,04 | 49 | −88,38 | ||||
| 2025-05-14 | 13F | Renaissance Technologies Llc | 0 | −100,00 | 0 | |||||
| 2025-08-14 | 13F | Aprio Wealth Management, LLC | 22 584 | −2,64 | 173 | 4,24 | ||||
| 2025-08-26 | NP | Profunds - Profund Vp Asia 30 | 68 097 | −7,23 | 521 | −0,76 | ||||
| 2025-08-05 | 13F | Redwood Wealth Management Group, LLC | 36 671 | −9,16 | 281 | −2,78 | ||||
| 2025-08-14 | 13F | Schonfeld Strategic Advisors LLC | 134 341 | −57,36 | 1 028 | −54,40 | ||||
| 2025-08-14 | 13F | Bank Of America Corp /de/ | 7 044 452 | −11,71 | 53 890 | −5,54 | ||||
| 2025-07-25 | 13F | Yousif Capital Management, Llc | 39 941 | 5,84 | 306 | 13,38 | ||||
| 2025-04-24 | 13F | Diversified Trust Co | 0 | −100,00 | 0 | |||||
| 2025-07-14 | 13F | GAMMA Investing LLC | 13 164 | 8,72 | 101 | 16,28 | ||||
| 2025-07-31 | 13F | R Squared Ltd | 0 | −100,00 | 0 | |||||
| 2025-08-12 | 13F | Legal & General Group Plc | 14 134 | 108 | ||||||
| 2025-08-14 | 13F | Sculptor Capital LP | Put | 0 | −100,00 | 0 | ||||
| 2025-08-08 | 13F | Cetera Investment Advisers | 20 211 | 1,75 | 155 | 8,45 | ||||
| 2025-08-14 | 13F | CIBC World Markets Inc. | 17 732 | 19,75 | 136 | 28,57 | ||||
| 2025-08-14 | 13F | Engineers Gate Manager LP | 0 | −100,00 | 0 | |||||
| 2025-08-14 | 13F | Sculptor Capital LP | 0 | −100,00 | 0 | |||||
| 2025-08-13 | 13F | Mackenzie Financial Corp | 72 734 | −64,36 | 556 | −61,89 | ||||
| 2025-05-01 | 13F | Genesis Investment Management, LLP | 0 | −100,00 | 0 | |||||
| 2025-07-09 | 13F | Sivia Capital Partners, LLC | 29 408 | 25,78 | 225 | 34,13 | ||||
| 2025-07-25 | 13F | Atria Wealth Solutions, Inc. | 23 550 | 87,65 | 187 | 108,99 | ||||
| 2025-08-04 | 13F | Hantz Financial Services, Inc. | 21 456 | 2 160,91 | 0 | |||||
| 2025-08-29 | 13F | Infini Capital Management Ltd | 0 | −100,00 | 0 | |||||
| 2025-08-12 | 13F | Jpmorgan Chase & Co | 1 668 846 | 33,27 | 12 767 | 42,59 | ||||
| 2025-08-14 | 13F | Sei Investments Co | 72 599 | 20,20 | 555 | 28,77 | ||||
| 2025-08-14 | 13F | Citadel Advisors Llc | Call | 27 700 | −5,78 | 212 | 0,48 | |||
| 2025-08-14 | 13F | Citadel Advisors Llc | Put | 64 200 | 13,63 | 491 | 21,84 | |||
| 2025-06-26 | NP | SNTKX - Steward International Enhanced Index Fund Class A | 136 133 | 0,00 | 958 | 21,88 | ||||
| 2025-08-14 | 13F | Verition Fund Management LLC | 62 081 | −76,45 | 475 | −74,84 | ||||
| 2025-08-14 | 13F | Quantinno Capital Management LP | 346 994 | 37,44 | 2 655 | 47,04 | ||||
| 2025-07-11 | 13F | Annex Advisory Services, LLC | 0 | −100,00 | 0 | |||||
| 2025-08-14 | 13F | Citadel Advisors Llc | 592 879 | −77,23 | 4 536 | −75,64 | ||||
| 2025-07-28 | 13F | Bayforest Capital Ltd | 19 329 | 148 | ||||||
| 2025-05-02 | 13F | Apollon Wealth Management, LLC | 0 | −100,00 | 0 | |||||
| 2025-05-06 | 13F | Venturi Wealth Management, LLC | 0 | −100,00 | 0 | |||||
| 2025-05-14 | 13F | Boston Private Wealth Llc | 0 | −100,00 | 0 | |||||
| 2025-07-30 | 13F | FNY Investment Advisers, LLC | 1 400 | 0 | ||||||
| 2025-07-16 | 13F | Highline Wealth Partners Llc | 725 | 16,56 | 6 | 25,00 | ||||
| 2025-08-11 | 13F | Lsv Asset Management | 565 611 | −2,09 | 4 | 0,00 | ||||
| 2025-08-13 | 13F | Baird Financial Group, Inc. | 525 406 | −2,91 | 4 019 | 3,88 | ||||
| 2025-07-23 | 13F | High Note Wealth, LLC | 28 | 0,00 | 0 | |||||
| 2025-08-13 | 13F | BCJ Capital Management, LLC | 11 246 | 86 | ||||||
| 2025-09-04 | 13F/A | Advisor Group Holdings, Inc. | 14 756 | 11,45 | 113 | 19,15 | ||||
| 2025-07-24 | 13F | Leo Wealth, LLC | 14 471 | 32,02 | 111 | 41,03 | ||||
| 2025-08-11 | 13F | Brown Brothers Harriman & Co | 558 | 4 | ||||||
| 2025-05-14 | 13F | Van Hulzen Asset Management, LLC | 0 | −100,00 | 0 | |||||
| 2025-08-05 | 13F | Bridgewater Advisors Inc. | 75 594 | −2,19 | 538 | 0,75 | ||||
| 2025-06-26 | NP | DFEM - Dimensional Emerging Markets Core Equity 2 ETF | 188 000 | 2,17 | 1 324 | 24,46 | ||||
| 2025-07-31 | 13F | Cambridge Investment Research Advisors, Inc. | 76 135 | −0,43 | 1 | |||||
| 2025-08-08 | 13F | Crossmark Global Holdings, Inc. | 1 281 177 | 1,85 | 9 801 | 8,98 | ||||
| 2025-08-07 | 13F | Acadian Asset Management Llc | 314 993 | 93,97 | 2 | 100,00 | ||||
| 2025-05-01 | 13F | Schechter Investment Advisors, LLC | 15 635 | −25,62 | 112 | −18,38 | ||||
| 2025-07-25 | 13F | Natural Investments, Llc | 16 309 | 41,66 | 0 | |||||
| 2025-07-21 | 13F | Ascent Group, LLC | 18 153 | 139 | ||||||
| 2025-06-26 | NP | Dfa Investment Trust Co - The Emerging Markets Series This fund is a listed as child fund of Dimensional Fund Advisors Lp and if that institution has disclosed ownership in this security, then these positions will not be double counted when calculating total shares and total value | 59 082 | 0,00 | 416 | 21,70 | ||||
| 2025-07-14 | 13F | Foster Group, Inc. | 43 350 | 3,04 | 332 | 10,33 | ||||
| 2025-08-07 | 13F | Verus Capital Partners, Llc | 38 900 | 2,10 | 298 | 9,19 | ||||
| 2025-08-11 | 13F | Private Advisor Group, LLC | 0 | −100,00 | 0 | |||||
| 2025-04-30 | 13F | Rehmann Capital Advisory Group | 0 | −100,00 | 0 | |||||
| 2025-08-01 | 13F | May Hill Capital, LLC | 12 460 | 95 | ||||||
| 2025-08-14 | 13F | Jane Street Group, Llc | Put | 780 000 | −0,36 | 5 967 | 6,61 | |||
| 2025-07-30 | 13F | Eqis Capital Management, Inc. | 23 376 | −6,00 | 179 | 0,56 | ||||
| 2025-04-17 | 13F | Vista Wealth Management Group, LLC | 12 426 | 89 | ||||||
| 2025-05-15 | 13F | Glenmede Trust Co Na | 28 216 | −28,44 | 202 | −21,18 | ||||
| 2025-05-12 | 13F | Virtu Financial LLC | 0 | −100,00 | 0 | |||||
| 2025-05-08 | 13F | XTX Topco Ltd | 0 | −100,00 | 0 | |||||
| 2025-08-28 | NP | JINTX - Johnson International Fund | 29 000 | −32,24 | 222 | −27,78 | ||||
| 2025-08-14 | 13F | Ariadne Wealth Management, LP | 32 625 | −3,57 | 223 | −11,51 | ||||
| 2025-08-14 | 13F | Two Sigma Investments, Lp | 378 628 | −70,52 | 2 897 | −68,46 | ||||
| 2025-07-23 | 13F | Shell Asset Management Co | 0 | 0 | ||||||
| 2025-08-15 | 13F | WealthCollab, LLC | 779 | 6,86 | 6 | 0,00 | ||||
| 2025-08-13 | 13F | Rsm Us Wealth Management Llc | 0 | −100,00 | 0 | |||||
| 2025-08-13 | 13F | GeoWealth Management, LLC | 14 251 | −19,59 | 109 | −13,49 | ||||
| 2025-08-14 | 13F | Mariner, LLC | 186 692 | 83,86 | 1 428 | 97,51 | ||||
| 2025-08-13 | 13F | Hsbc Holdings Plc | 0 | −100,00 | 0 | |||||
| 2025-08-14 | 13F | Barometer Capital Management Inc. | 15 447 | 0,00 | 118 | 7,27 | ||||
| 2025-07-24 | 13F | Ronald Blue Trust, Inc. | 99 341 | 27,89 | 760 | 36,76 | ||||
| 2025-04-28 | 13F | North of South Capital LLP | 0 | −100,00 | 0 | |||||
| 2025-07-29 | 13F | Wealthstream Advisors, Inc. | 25 205 | 53,08 | 193 | 64,10 | ||||
| 2025-07-30 | 13F | Cullen/frost Bankers, Inc. | 0 | −100,00 | 0 | |||||
| 2025-08-14 | 13F | Bnp Paribas Arbitrage, Sa | 1 486 004 | −11,08 | 11 368 | −4,86 | ||||
| 2025-06-27 | NP | SPWO - SP Funds S&P World (ex-US) ETF | 19 843 | 13,50 | 140 | 37,62 | ||||
| 2025-07-25 | 13F | Verdence Capital Advisors LLC | 12 014 | 9,08 | 92 | 16,67 | ||||
| 2025-08-05 | 13F | Simplex Trading, Llc | Put | 7 200 | −50,34 | 0 | ||||
| 2025-08-05 | 13F | Simplex Trading, Llc | 4 038 | −68,30 | 0 | |||||
| 2025-08-11 | 13F | United Capital Financial Advisers, Llc | 17 332 | 5,52 | 133 | 12,82 | ||||
| 2025-08-05 | 13F | Simplex Trading, Llc | Call | 37 400 | −19,57 | 0 | ||||
| 2025-08-08 | 13F | Pnc Financial Services Group, Inc. | 105 368 | 16,42 | 806 | 24,57 | ||||
| 2025-08-14 | 13F | Ieq Capital, Llc | 81 253 | 192,59 | 622 | 213,64 | ||||
| 2025-08-13 | 13F | Northern Trust Corp | 3 616 436 | 8,44 | 27 666 | 16,02 | ||||
| 2025-08-07 | 13F | BOK Financial Private Wealth, Inc. | 0 | −100,00 | 0 | |||||
| 2025-04-14 | 13F | IMC-Chicago, LLC | Put | 0 | −100,00 | 0 | −100,00 | |||
| 2025-08-12 | 13F | Franklin Resources Inc | 24 735 | 37,86 | 189 | 47,66 | ||||
| 2025-08-14 | 13F | Maple Rock Capital Partners Inc. | 3 140 443 | 24 024 | ||||||
| 2025-07-25 | 13F | Wealth Architects, LLC | 14 981 | 0,11 | 115 | 6,54 | ||||
| 2025-08-14 | 13F | Parallax Volatility Advisers, L.P. | Put | 20 000 | 0,00 | 153 | 6,99 | |||
| 2025-08-14 | 13F | Evergreen Capital Management Llc | 44 198 | 362 | ||||||
| 2025-06-26 | NP | DFEV - Dimensional Emerging Markets Value ETF | 308 787 | 9,72 | 2 174 | 33,64 | ||||
| 2025-07-17 | 13F | Sound Income Strategies, LLC | 200 | 0,00 | 2 | 0,00 | ||||
| 2025-08-27 | NP | RYSIX - Electronics Fund Investor Class | 107 029 | −7,64 | 819 | −1,21 | ||||
| 2025-04-14 | 13F | IMC-Chicago, LLC | 0 | −100,00 | 0 | −100,00 | ||||
| 2025-08-14 | 13F | Tcw Group Inc | 81 253 | −18,55 | 622 | −12,90 | ||||
| 2025-08-14 | 13F | Parallax Volatility Advisers, L.P. | 6 198 | −41,52 | 47 | −37,33 | ||||
| 2025-06-26 | NP | HTECX - Hennessy Technology Fund Investor Class | 14 908 | −25,82 | 105 | −10,34 | ||||
| 2025-06-23 | NP | UUPIX - Ultraemerging Markets Profund Investor Class | 9 621 | 9,48 | 68 | 34,00 | ||||
| 2025-07-17 | 13F | Nelson, Van Denburg & Campbell Wealth Management Group, LLC | 14 367 | −28,40 | 110 | −23,78 | ||||
| 2025-07-21 | 13F | Qrg Capital Management, Inc. | 66 027 | 4,13 | 505 | 11,48 | ||||
| 2025-08-14 | 13F | Balyasny Asset Management Llc | 463 477 | 18,69 | 3 546 | 27,02 | ||||
| 2025-07-15 | 13F | Fifth Third Bancorp | 398 | 0,00 | 3 | 50,00 | ||||
| 2025-08-05 | 13F | Bank Of Montreal /can/ | 16 842 | −5,90 | 129 | 0,79 | ||||
| 2025-08-06 | 13F | True Wealth Design, LLC | 359 | −44,85 | 3 | −50,00 | ||||
| 2025-08-14 | 13F | Voloridge Investment Management, Llc | 0 | −100,00 | 0 | |||||
| 2025-05-13 | 13F | Wellington Management Group Llp | 0 | −100,00 | 0 | −100,00 | ||||
| 2025-08-12 | 13F | Rhumbline Advisers | 716 330 | −0,31 | 5 480 | 6,66 | ||||
| 2025-06-26 | NP | DEHP - Dimensional Emerging Markets High Profitability ETF | 56 218 | −10,36 | 396 | 9,12 | ||||
| 2025-08-27 | NP | RMEAX - Aspiriant Risk-Managed Equity Allocation Fund Advisor Shares | 62 250 | −6,60 | 476 | 0,00 | ||||
| 2025-07-28 | 13F | Ritholtz Wealth Management | 87 663 | 2,36 | 671 | 9,48 | ||||
| 2025-08-07 | 13F | Allworth Financial LP | 7 000 | 6,48 | 54 | 17,78 | ||||
| 2025-08-04 | 13F | Savvy Advisors, Inc. | 0 | −100,00 | 0 | |||||
| 2025-07-03 | 13F | Garde Capital, Inc. | 200 | 2 | ||||||
| 2025-07-22 | 13F | Cedar Mountain Advisors, LLC | 1 000 | 0,00 | 8 | 0,00 | ||||
| 2025-08-14 | 13F | Raymond James Financial Inc | 35 610 | −22,68 | 272 | −17,33 | ||||
| 2025-08-08 | 13F | Wiser Advisor Group LLC | 0 | −100,00 | 0 | |||||
| 2025-04-11 | 13F | First Affirmative Financial Network | 36 935 | 55,89 | 264 | 72,55 | ||||
| 2025-06-30 | NP | AIM INTERNATIONAL MUTUAL FUNDS (INVESCO INTERNATIONAL MUTUAL FUNDS) - Invesco Oppenheimer Global Multi-Asset Growth Fund Class R6 | 7 909 | 35,08 | 56 | 66,67 | ||||
| 2025-08-28 | NP | CWI - SPDR(R) MSCI ACWI EX-US ETF | 206 513 | −10,95 | 1 580 | −4,76 | ||||
| 2025-05-05 | 13F | Transce3nd, LLC | 0 | −100,00 | 0 |