Grundläggande statistik
| Institutionella ägare | 151 total, 151 long only, 0 short only, 0 long/short - change of 6,34% MRQ |
| Genomsnittlig portföljallokering | 0.0746 % - change of 31,73% MRQ |
| Institutionella aktier (lång) | 2 238 389 (ex 13D/G) - change of −0,02MM shares −0,94% MRQ |
| Institutionellt värde (lång) | $ 105 174 USD ($1000) |
Institutionellt ägande och aktieägare
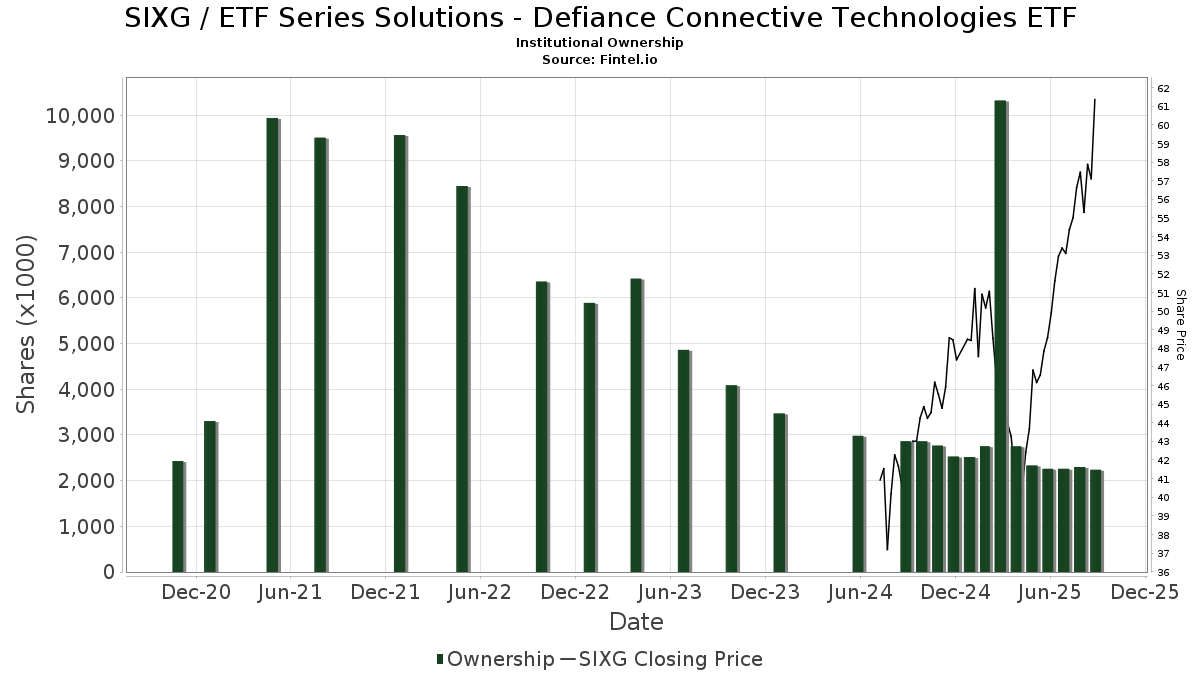
ETF Series Solutions - Defiance Connective Technologies ETF (US:SIXG) har 151 Institutionella ägare och aktieägare som har lämnat in 13D/G- eller 13F-formulär till Securities Exchange Commission (SEC). Dessa institut innehar totalt 2,238,389 aktier. Största aktieägare inkluderar LPL Financial LLC, Commonwealth Equity Services, Llc, Cetera Investment Advisers, Pnc Financial Services Group, Inc., UBS Group AG, Kwmg, Llc, Raymond James Financial Inc, Goldman Sachs Group Inc, Fischer Investment Strategies, Llc, and Rockefeller Capital Management L.P. .
ETF Series Solutions - Defiance Connective Technologies ETF (NasdaqGM:SIXG) Institutionell ägarstruktur visar institutioners och fonders nuvarande positioner i företaget, samt de senaste förändringarna i positionernas storlek. Större aktieägare kan vara enskilda investerare, fonder, hedgefonder eller institutioner. Bilaga 13D visar att investeraren äger (eller ägde) mer än 5% av företaget och avser (eller avsåg) att aktivt eftersträva en förändring av affärsstrategin. Schedule 13G indikerar en passiv investering på över 5%.
The share price as of September 16, 2025 is 61,41 / share. Previously, on September 17, 2024, the share price was 41,96 / share. This represents an increase of 46,35% over that period.
Fondsentimentets poäng
Fondsentimentet poängen(fka Ägarackumulation-poäng) visar vilka aktier som är mest köpta av fonder. Det är resultatet av en sofistikerad kvantitativ flerfaktormodell som identifierar företag med de högsta nivåerna av institutionell ackumulering. Poängsättningsmodellen använder en kombination av den totala ökningen av redovisade ägare, förändringarna i portföljallokeringarna för dessa ägare och andra mått. Siffran sträcker sig från 0 till 100, där högre siffror indikerar en högre nivå av ackumulering i förhållande till sina konkurrenter, och 50 är genomsnittet.
Uppdateringsfrekvens: Dagligen
Se Ownership Explorer, som innehåller en lista över de högst rankade företagen.
Institutionell sälj/köp-kvot
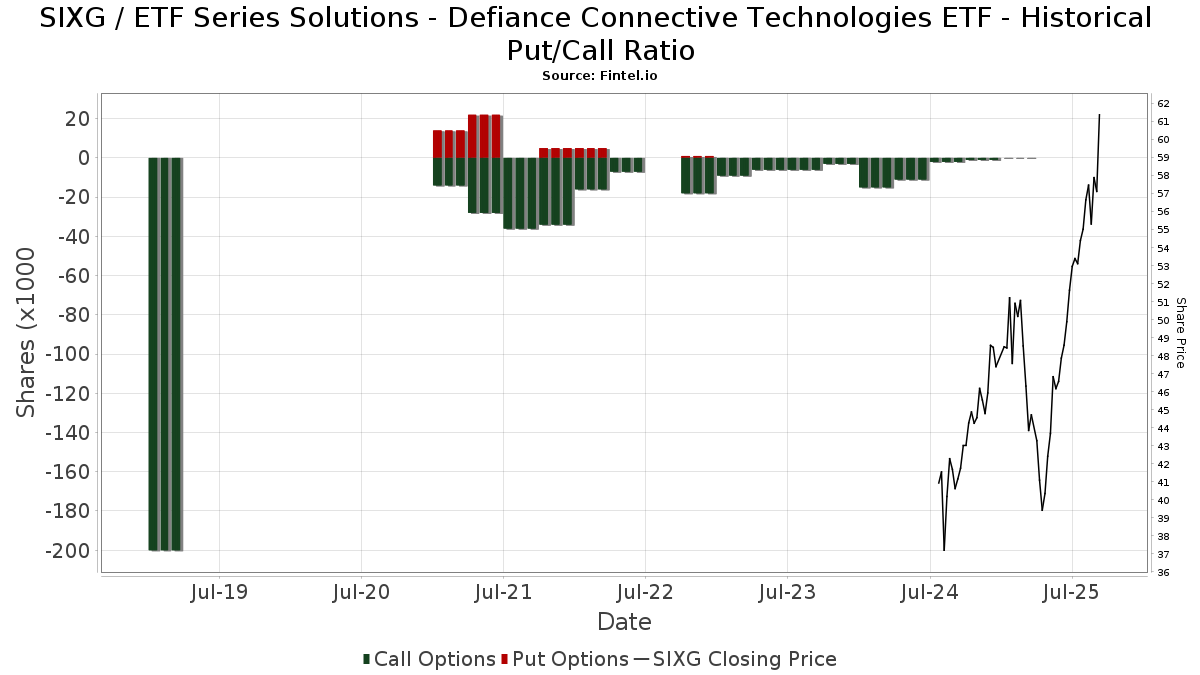
Förutom att rapportera vanliga eget kapital- och skuldemissioner måste institutioner med mer än 100MM tillgångar under förvaltning också avslöja sina innehav av sälj- och köpoptioner. Eftersom säljoptioner i allmänhet indikerar ett negativt sentiment och köpoptioner indikerar ett positivt sentiment, kan vi få en uppfattning om det övergripande institutionella sentimentet genom att plotta förhållandet mellan säljoptioner och köpoptioner. Diagrammet till höger visar det historiska förhållandet mellan sälj- och köpoptioner för detta instrument.
Genom att använda sälj/köp-kvoten som en indikator på aktieägarnas sentiment undviker man en av de största bristerna med att använda det totala institutionella ägandet, nämligen att en betydande del av de förvaltade tillgångarna investeras passivt för att följa index. Passivt förvaltade fonder köper vanligtvis inte optioner, så indikatorn för sälj/köp-kvoten ger en bättre bild av stämningen i aktivt förvaltade fonder.
13F- och NPORT-arkiveringar
Detaljer om 13F-arkiveringar är gratis. Detaljer om NP-arkiveringar kräver ett premiummedlemskap. Gröna rader indikerar nya positioner. Röda rader indikerar stängda positioner. Klicka på länk symbolen för att se hela transaktionshistoriken.
Uppgradera
för att låsa upp premiumdata och exportera till Excel ![]() .
.
| Fil Datum | Källa | Investerare | Typ | Genomsnittligt pris (beräknat) |
Aktier | Δ Aktier (%) |
Rapporterat värde (1000 USD) |
Δ Värde (%) |
Portföljallokering (%) |
|
|---|---|---|---|---|---|---|---|---|---|---|
| 2025-07-16 | 13F | West Branch Capital LLC | 4 | 0,00 | 0 | |||||
| 2025-08-13 | 13F | Russell Investments Group, Ltd. | 100 | 0,00 | 5 | 25,00 | ||||
| 2025-05-14 | 13F | Ameriprise Financial Inc | 0 | −100,00 | 0 | −100,00 | ||||
| 2025-07-24 | 13F | IFP Advisors, Inc | 18 | −80,65 | 1 | −100,00 | ||||
| 2025-08-07 | 13F | Searle & Co. | 10 534 | 0,00 | 556 | 24,16 | ||||
| 2025-05-09 | 13F | Atria Wealth Solutions, Inc. | 0 | −100,00 | 0 | |||||
| 2025-08-14 | 13F | IHT Wealth Management, LLC | 8 381 | −6,25 | 442 | 16,62 | ||||
| 2025-07-17 | 13F | Oak Family Advisors, Llc | 14 417 | 0,04 | 761 | 24,18 | ||||
| 2025-08-11 | 13F | Principal Securities, Inc. | 600 | −27,27 | 32 | −20,51 | ||||
| 2025-08-14 | 13F | Snowden Capital Advisors LLC | 7 650 | 0,21 | 404 | 24,38 | ||||
| 2025-08-08 | 13F | Your Advocates Ltd., LLP | 10 | 1 | ||||||
| 2025-08-11 | 13F | HighTower Advisors, LLC | 45 891 | −10,06 | 2 421 | 11,67 | ||||
| 2025-08-12 | 13F | Howe & Rusling Inc | 600 | 32 | ||||||
| 2025-08-06 | 13F | Prospera Financial Services Inc | 7 242 | 383 | ||||||
| 2025-07-25 | 13F | Retirement Planning Group, Llc / Ny | 4 026 | 212 | ||||||
| 2025-09-11 | 13F | Milestones Private Investment Advisors LLC | 5 792 | 306 | ||||||
| 2025-07-23 | 13F | Elevate Wealth Advisory, Inc | 3 852 | 203 | ||||||
| 2025-08-04 | 13F | Spire Wealth Management | 3 386 | 0,12 | 179 | 24,48 | ||||
| 2025-07-24 | 13F | Stonebridge Financial Group, LLC | 0 | −100,00 | 0 | |||||
| 2025-08-14 | 13F | Guardian Wealth Advisors, Llc / Nc | 26 471 | −0,75 | 1 397 | 23,21 | ||||
| 2025-08-12 | 13F | MAI Capital Management | 1 583 | 7,18 | 84 | 33,87 | ||||
| 2025-08-18 | 13F/A | National Bank Of Canada /fi/ | 2 618 | 0,00 | 138 | 24,32 | ||||
| 2025-08-05 | 13F | American Institute for Advanced Investment Management, LLP | 3 875 | 204 | ||||||
| 2025-07-24 | 13F | Acima Private Wealth, Llc | 3 473 | 0,00 | 183 | 24,49 | ||||
| 2025-08-12 | 13F | PSI Advisors, LLC | 0 | −100,00 | 0 | |||||
| 2025-07-28 | 13F | BRYN MAWR TRUST Co | 208 | −16,80 | 11 | 0,00 | ||||
| 2025-08-07 | 13F | Allworth Financial LP | 204 | 0,00 | 11 | 25,00 | ||||
| 2025-08-08 | 13F | Smithfield Trust Co | 1 830 | 0,00 | 0 | |||||
| 2025-08-14 | 13F | Bank Of America Corp /de/ | 24 106 | −2,90 | 1 272 | 20,47 | ||||
| 2025-08-04 | 13F | Creekmur Asset Management LLC | 98 | −50,00 | 5 | −37,50 | ||||
| 2025-05-16 | 13F | Laidlaw Wealth Management LLC | 0 | −100,00 | 0 | |||||
| 2025-07-28 | 13F | Moran Wealth Management, LLC | 12 014 | 90,09 | 634 | 136,19 | ||||
| 2025-08-13 | 13F | SageView Advisory Group, LLC | 13 006 | 0,00 | 709 | 28,44 | ||||
| 2025-07-31 | 13F | Cambridge Investment Research Advisors, Inc. | 13 899 | −0,29 | 1 | |||||
| 2025-07-21 | 13F | HT Partners LLC | 10 345 | 0,00 | 546 | 24,15 | ||||
| 2025-08-14 | 13F | Murphy & Mullick Capital Management Corp | 20 | 0,00 | 1 | |||||
| 2025-08-14 | 13F | Royal Bank Of Canada | 23 080 | −3,56 | 1 218 | 19,76 | ||||
| 2025-08-08 | 13F | Compass Wealth Management LLC | 0 | −100,00 | 0 | |||||
| 2025-07-24 | 13F | Jfs Wealth Advisors, Llc | 250 | 0,00 | 13 | 30,00 | ||||
| 2025-08-13 | 13F | EverSource Wealth Advisors, LLC | 106 | −91,34 | 6 | −90,38 | ||||
| 2025-08-13 | 13F | Northwestern Mutual Wealth Management Co | 3 117 | 20,53 | 164 | 50,46 | ||||
| 2025-08-14 | 13F | Goldman Sachs Group Inc | 70 360 | 4,28 | 3 712 | 29,47 | ||||
| 2025-08-14 | 13F | McIlrath & Eck, LLC | 125 | 0,00 | 7 | 20,00 | ||||
| 2025-08-05 | 13F | Scarborough Advisors, LLC | 200 | 11 | ||||||
| 2025-07-14 | 13F | AdvisorNet Financial, Inc | 278 | 0,00 | 15 | 27,27 | ||||
| 2025-08-05 | 13F | Dunhill Financial, LLC | 2 820 | 3 141,38 | 149 | 4 833,33 | ||||
| 2025-08-15 | 13F | Tower Research Capital LLC (TRC) | 4 054 | 15,70 | 214 | 43,92 | ||||
| 2025-08-06 | 13F | Atlantic Union Bankshares Corp | 229 | 12 | ||||||
| 2025-08-07 | 13F | Parkside Financial Bank & Trust | 195 | 0,00 | 10 | 25,00 | ||||
| 2025-08-14 | 13F | Federation des caisses Desjardins du Quebec | 8 852 | 2,91 | 467 | 27,95 | ||||
| 2025-08-11 | 13F | HHM Wealth Advisors, LLC | 740 | 0,00 | 39 | 25,81 | ||||
| 2025-07-23 | 13F | Joel Isaacson & Co., LLC | 8 968 | 0,11 | 473 | 24,47 | ||||
| 2025-05-12 | 13F | Sandy Spring Bank | 229 | 0,00 | 10 | −10,00 | ||||
| 2025-08-06 | 13F | AE Wealth Management LLC | 3 999 | 0,08 | 211 | 24,26 | ||||
| 2025-08-12 | 13F | Tradition Wealth Management, LLC | 5 228 | 0,10 | 276 | 24,43 | ||||
| 2025-07-28 | 13F | Harbour Investments, Inc. | 17 255 | −0,48 | 910 | 23,64 | ||||
| 2025-07-31 | 13F | Oppenheimer & Co Inc | 13 340 | 29,01 | 704 | 60,14 | ||||
| 2025-07-31 | 13F | Northstar Asset Management Llc | 39 725 | −8,52 | 2 096 | 13,55 | ||||
| 2025-08-06 | 13F | Commonwealth Equity Services, Llc | 186 687 | −4,29 | 10 | 12,50 | ||||
| 2025-08-14 | 13F | Stifel Financial Corp | 30 093 | −1,63 | 1 588 | 22,08 | ||||
| 2025-08-12 | 13F | O'shaughnessy Asset Management, Llc | 528 | −0,56 | 28 | 22,73 | ||||
| 2025-08-05 | 13F | Bank Of Montreal /can/ | 765 | 0,00 | 40 | 25,00 | ||||
| 2025-08-13 | 13F | Transce3nd, LLC | 829 | 0,00 | 44 | 22,86 | ||||
| 2025-08-14 | 13F | GWM Advisors LLC | 1 718 | 0,06 | 91 | 25,00 | ||||
| 2025-07-10 | 13F | Wealth Enhancement Advisory Services, Llc | 5 010 | 270 | ||||||
| 2025-07-11 | 13F | Seacrest Wealth Management, Llc | 6 582 | −6,99 | 347 | 15,67 | ||||
| 2025-08-14 | 13F | Wells Fargo & Company/mn | 249 | −89,80 | 13 | −87,38 | ||||
| 2025-05-09 | 13F | Pathway Financial Advisers, LLC | 0 | −100,00 | 0 | |||||
| 2025-08-12 | 13F | LPL Financial LLC | 281 075 | 8,28 | 14 829 | 34,42 | ||||
| 2025-08-14 | 13F/A | Rockefeller Capital Management L.P. | 48 192 | −0,26 | 2 543 | 23,82 | ||||
| 2025-08-14 | 13F | Mml Investors Services, Llc | 5 566 | −0,87 | 0 | |||||
| 2025-08-14 | 13F | Boston Private Wealth Llc | 0 | −100,00 | 0 | |||||
| 2025-08-14 | 13F | CoreCap Advisors, LLC | 425 | −0,23 | 22 | 22,22 | ||||
| 2025-07-24 | 13F | Fischer Investment Strategies, Llc | 69 515 | 48,73 | 3 668 | 84,64 | ||||
| 2025-07-08 | 13F | Nbc Securities, Inc. | 508 | 0,20 | 0 | |||||
| 2025-08-14 | 13F | Raymond James Financial Inc | 92 587 | −7,86 | 4 885 | 14,38 | ||||
| 2025-07-30 | 13F | Advantage Trust Co | 37 660 | −3,88 | 1 987 | 19,28 | ||||
| 2025-08-19 | 13F | Advisory Services Network, LLC | 14 333 | −5,80 | 777 | 20,28 | ||||
| 2025-08-12 | 13F | Global Retirement Partners, LLC | 658 | 65,74 | 35 | 88,89 | ||||
| 2025-08-15 | 13F | Equitable Holdings, Inc. | 4 528 | 239 | ||||||
| 2025-08-14 | 13F | Valley Financial Group, Inc. | 5 018 | −4,62 | 265 | 18,39 | ||||
| 2025-07-28 | 13F | RFG Advisory, LLC | 0 | −100,00 | 0 | |||||
| 2025-08-07 | 13F | Resources Investment Advisors, LLC. | 35 925 | −2,63 | 1 895 | 20,85 | ||||
| 2025-07-14 | 13F | U.S. Capital Wealth Advisors, LLC | 15 560 | 8,24 | 821 | 34,43 | ||||
| 2025-07-15 | 13F | Palumbo Wealth Management LLC | 4 000 | 211 | ||||||
| 2025-07-21 | 13F | Mirae Asset Global Investments Co., Ltd. | 1 355 | 0,00 | 71 | 24,56 | ||||
| 2025-08-08 | 13F | Cetera Investment Advisers | 131 836 | −4,85 | 6 956 | 18,12 | ||||
| 2025-08-12 | 13F | J.w. Cole Advisors, Inc. | 4 445 | −9,27 | 234 | 12,50 | ||||
| 2025-07-15 | 13F | Kwmg, Llc | 103 697 | 0,87 | 5 471 | 25,22 | ||||
| 2025-08-11 | 13F | Brown Brothers Harriman & Co | 400 | 0,00 | 21 | 23,53 | ||||
| 2025-08-13 | 13F | Strategic Family Wealth Counselors, L.L.C. | 11 406 | 0,12 | 602 | 24,17 | ||||
| 2025-05-16 | 13F/A | Kestra Investment Management, LLC | 0 | −100,00 | 0 | |||||
| 2025-07-08 | 13F/A | Salem Investment Counselors Inc | 1 117 | −21,17 | 59 | −3,33 | ||||
| 2025-07-24 | 13F | Insight Inv LLC | 4 619 | 244 | ||||||
| 2025-08-11 | 13F | Private Advisor Group, LLC | 8 148 | 2,98 | 430 | 27,68 | ||||
| 2025-07-21 | 13F | DHJJ Financial Advisors, Ltd. | 500 | 26 | ||||||
| 2025-08-14 | 13F | Sunbelt Securities, Inc. | 162 | 0,00 | 8 | 16,67 | ||||
| 2025-07-23 | 13F | Sachetta, LLC | 0 | −100,00 | 0 | |||||
| 2025-08-04 | 13F | Creative Financial Designs Inc /adv | 524 | 0,00 | 28 | 22,73 | ||||
| 2025-08-01 | 13F | Envestnet Asset Management Inc | 4 729 | −49,46 | 249 | −37,28 | ||||
| 2025-08-12 | 13F | Proequities, Inc. | 0 | 0 | ||||||
| 2025-07-24 | 13F | Us Bancorp \de\ | 146 | −94,98 | 8 | −94,31 | ||||
| 2025-07-22 | 13F | Valley National Advisers Inc | 8 397 | −3,29 | 0 | |||||
| 2025-05-14 | 13F | Comerica Bank | 0 | −100,00 | 0 | |||||
| 2025-08-19 | 13F | Anchor Investment Management, LLC | 575 | 0,00 | 30 | 25,00 | ||||
| 2025-04-25 | 13F | Kieckhefer Group Llc | 0 | −100,00 | 0 | |||||
| 2025-08-08 | 13F | Intrua Financial, LLC | 9 110 | 0,00 | 481 | 24,03 | ||||
| 2025-08-05 | 13F | Gould Asset Management Llc /ca/ | 3 800 | 200 | ||||||
| 2025-07-14 | 13F | GAMMA Investing LLC | 9 617 | −2,39 | 507 | 21,29 | ||||
| 2025-07-15 | 13F | World Equity Group, Inc. | 10 498 | 0,21 | 554 | 24,27 | ||||
| 2025-07-17 | 13F | Eagle Wealth Strategies Llc | 4 338 | 229 | ||||||
| 2025-08-13 | 13F | Financial Freedom, LLC | 13 443 | 6,24 | 709 | 32,03 | ||||
| 2025-07-08 | 13F | Parallel Advisors, LLC | 896 | 0,00 | 47 | 23,68 | ||||
| 2025-07-25 | 13F | Concord Wealth Partners | 427 | 0,23 | 23 | 22,22 | ||||
| 2025-07-25 | 13F | Apollon Wealth Management, LLC | 9 533 | −13,82 | 503 | 6,81 | ||||
| 2025-05-14 | 13F | Truvestments Capital Llc | 0 | −100,00 | 0 | |||||
| 2025-07-25 | 13F | Cwm, Llc | 4 203 | 0,00 | 0 | |||||
| 2025-08-15 | 13F | Morgan Stanley | 9 689 | 1,54 | 511 | 26,17 | ||||
| 2025-05-05 | 13F | Csenge Advisory Group | 0 | −100,00 | 0 | |||||
| 2025-08-06 | 13F | Wsfs Capital Management, Llc | 0 | −100,00 | 0 | |||||
| 2025-08-08 | 13F | Pnc Financial Services Group, Inc. | 123 912 | −21,57 | 6 538 | −2,65 | ||||
| 2025-08-06 | 13F | Golden State Wealth Management, LLC | 163 | 0,00 | 9 | 33,33 | ||||
| 2025-07-23 | 13F | Vontobel Holding Ltd. | 13 760 | 0,00 | 726 | 24,14 | ||||
| 2025-07-30 | 13F | Crewe Advisors LLC | 400 | 0,00 | 21 | 23,53 | ||||
| 2025-08-12 | 13F | Steward Partners Investment Advisory, Llc | 2 466 | 0,12 | 130 | 25,00 | ||||
| 2025-08-14 | 13F | Frisch Financial Group, Inc. | 9 410 | 0,06 | 0 | |||||
| 2025-08-14 | 13F | Jane Street Group, Llc | 4 792 | −57,12 | 253 | −46,84 | ||||
| 2025-08-13 | 13F | StoneX Group Inc. | 6 589 | −11,09 | 348 | 10,51 | ||||
| 2025-07-21 | 13F | Ameriflex Group, Inc. | 500 | 0,00 | 26 | 23,81 | ||||
| 2025-07-30 | 13F | Bogart Wealth, LLC | 45 | 0,00 | 2 | 100,00 | ||||
| 2025-08-04 | 13F/A | 626 Financial, LLC | 4 592 | 242 | ||||||
| 2025-08-11 | 13F | TD Waterhouse Canada Inc. | 355 | 0,00 | 19 | 20,00 | ||||
| 2025-08-08 | 13F | Creative Planning | 15 410 | −2,68 | 813 | 20,98 | ||||
| 2025-05-12 | 13F | Simplex Trading, Llc | 0 | −100,00 | 0 | |||||
| 2025-08-05 | 13F | Claro Advisors LLC | 4 780 | −24,87 | 252 | −6,67 | ||||
| 2025-08-11 | 13F | Wealthspire Advisors, LLC | 0 | −100,00 | 0 | |||||
| 2025-07-29 | 13F | Stratos Wealth Partners, LTD. | 4 825 | −6,76 | 255 | 15,98 | ||||
| 2025-08-14 | 13F | Fmr Llc | 5 491 | −4,80 | 290 | 17,96 | ||||
| 2025-08-14 | 13F | AllSquare Wealth Management LLC | 6 075 | −19,80 | 321 | −0,31 | ||||
| 2025-08-11 | 13F | Aptus Capital Advisors, LLC | 26 577 | −0,75 | 1 402 | 23,20 | ||||
| 2025-07-30 | 13F | Strategic Blueprint, LLC | 4 448 | −13,70 | 235 | 6,85 | ||||
| 2025-08-07 | 13F | Cypress Capital Management LLC (WY) | 773 | 41 | ||||||
| 2025-08-06 | 13F | Wedbush Securities Inc | 14 153 | −21,60 | 1 | |||||
| 2025-04-16 | 13F | IAG Wealth Partners, LLC | 0 | −100,00 | 0 | |||||
| 2025-09-04 | 13F/A | Advisor Group Holdings, Inc. | 38 600 | −24,99 | 2 037 | −6,86 | ||||
| 2025-07-16 | 13F | Beaumont Financial Advisors, LLC | 5 163 | 0,06 | 272 | 24,20 | ||||
| 2025-08-12 | 13F | SRS Capital Advisors, Inc. | 890 | 47 | ||||||
| 2025-08-18 | 13F | Front Row Advisors LLC | 400 | 0,00 | 21 | 23,53 | ||||
| 2025-04-25 | 13F | New Wave Wealth Advisors Llc | 0 | −100,00 | 0 | |||||
| 2025-07-24 | 13F | Wealthstar Advisors, Llc | 4 421 | 233 | ||||||
| 2025-07-07 | 13F | Investors Research Corp | 0 | −100,00 | 0 | |||||
| 2025-08-14 | 13F | Arete Wealth Advisors, LLC | 0 | −100,00 | 0 | |||||
| 2025-08-14 | 13F | Mariner, LLC | 9 726 | −4,85 | 513 | 18,20 | ||||
| 2025-08-14 | 13F | Susquehanna International Group, Llp | 21 441 | −43,48 | 1 131 | −29,84 | ||||
| 2025-08-11 | 13F | Citigroup Inc | 24 697 | 10,16 | 1 303 | 36,87 | ||||
| 2025-05-12 | 13F | Independent Advisor Alliance | 0 | −100,00 | 0 | |||||
| 2025-07-15 | 13F | Fifth Third Bancorp | 1 095 | 0,00 | 58 | 23,91 | ||||
| 2025-07-14 | 13F | Armstrong Advisory Group, Inc | 3 882 | 0,13 | 205 | 10,87 | ||||
| 2025-05-01 | 13F | Bleakley Financial Group, LLC | 0 | −100,00 | 0 | −100,00 | ||||
| 2025-08-07 | 13F | Kestra Private Wealth Services, Llc | 4 112 | 217 | ||||||
| 2025-08-13 | 13F | Baird Financial Group, Inc. | 31 906 | 3,49 | 1 683 | 28,47 | ||||
| 2025-08-15 | 13F | Kestra Advisory Services, LLC | 19 218 | −3,95 | 1 014 | 19,18 | ||||
| 2025-08-08 | 13F | Avantax Advisory Services, Inc. | 4 391 | −28,47 | 232 | −11,15 | ||||
| 2025-08-13 | 13F | Continuum Advisory, LLC | 0 | −100,00 | 0 | |||||
| 2025-08-14 | 13F | Citadel Advisors Llc | Call | 0 | −100,00 | 0 | −100,00 | |||
| 2025-08-14 | 13F | Citadel Advisors Llc | Put | 0 | −100,00 | 0 | −100,00 | |||
| 2025-08-14 | 13F | UBS Group AG | 108 214 | 13,18 | 5 709 | 40,51 | ||||
| 2025-04-29 | 13F | Lee Danner & Bass Inc | 0 | −100,00 | 0 | −100,00 | ||||
| 2025-08-14 | 13F | Citadel Advisors Llc | 0 | −100,00 | 0 | −100,00 | ||||
| 2025-08-14 | 13F | TCG Advisory Services, LLC | 7 341 | −13,17 | 387 | 7,80 | ||||
| 2025-08-12 | 13F | Resolute Wealth Strategies, LLC | 4 619 | −4,63 | 244 | 18,54 | ||||
| 2025-08-13 | 13F | Crosspoint Financial, Llc | 21 895 | 0,00 | 1 155 | 24,19 | ||||
| 2025-08-14 | 13F | Warren Averett Asset Management, LLC | 13 372 | −1,77 | 706 | 21,97 | ||||
| 2025-08-12 | 13F | AlphaCore Capital LLC | 64 | 3 | ||||||
| 2025-08-12 | 13F | Jpmorgan Chase & Co | 1 878 | −8,66 | 99 | 13,79 | ||||
| 2025-08-08 | 13F | Larson Financial Group LLC | 7 872 | 12,09 | 415 | 39,26 | ||||
| 2025-08-13 | 13F | Scotia Capital Inc. | 7 277 | 11,80 | 384 | 38,77 | ||||
| 2025-07-11 | 13F | Farther Finance Advisors, LLC | 33 | 6,45 | 2 | 0,00 | ||||
| 2025-05-27 | 13F | Advisors Capital Management, LLC | 0 | −100,00 | 0 | |||||
| 2025-08-08 | 13F | Symphony Financial Services, Inc. | 4 784 | 253 | ||||||
| 2025-07-21 | 13F | Crews Bank & Trust | 1 250 | 0,00 | 66 | 22,64 | ||||
| 2025-07-31 | 13F | Wealthfront Advisers Llc | 5 308 | 4,96 | 280 | 30,84 |
Other Listings
| MX:SIXG |