Grundläggande statistik
| Institutionella ägare | 259 total, 257 long only, 0 short only, 2 long/short - change of 85,00% MRQ |
| Genomsnittlig portföljallokering | 0.2305 % - change of −4,86% MRQ |
| Institutionella aktier (lång) | 18 834 717 (ex 13D/G) - change of 8,01MM shares 74,04% MRQ |
| Institutionellt värde (lång) | $ 1 061 643 USD ($1000) |
Institutionellt ägande och aktieägare
Global X Funds - Global X Defense Tech ETF (US:SHLD) har 259 Institutionella ägare och aktieägare som har lämnat in 13D/G- eller 13F-formulär till Securities Exchange Commission (SEC). Dessa institut innehar totalt 18,834,717 aktier. Största aktieägare inkluderar Bank Of America Corp /de/, LPL Financial LLC, Morgan Stanley, MIRAE ASSET GLOBAL ETFS HOLDINGS Ltd., Royal Bank Of Canada, Thrivent Financial For Lutherans, Stifel Financial Corp, Raymond James Financial Inc, Benjamin Edwards Inc, and Advisor Group Holdings, Inc. .
Global X Funds - Global X Defense Tech ETF (ARCA:SHLD) Institutionell ägarstruktur visar institutioners och fonders nuvarande positioner i företaget, samt de senaste förändringarna i positionernas storlek. Större aktieägare kan vara enskilda investerare, fonder, hedgefonder eller institutioner. Bilaga 13D visar att investeraren äger (eller ägde) mer än 5% av företaget och avser (eller avsåg) att aktivt eftersträva en förändring av affärsstrategin. Schedule 13G indikerar en passiv investering på över 5%.
The share price as of September 9, 2025 is 62,43 / share. Previously, on September 10, 2024, the share price was 36,34 / share. This represents an increase of 71,79% over that period.

Fondsentimentets poäng
Fondsentimentet poängen(fka Ägarackumulation-poäng) visar vilka aktier som är mest köpta av fonder. Det är resultatet av en sofistikerad kvantitativ flerfaktormodell som identifierar företag med de högsta nivåerna av institutionell ackumulering. Poängsättningsmodellen använder en kombination av den totala ökningen av redovisade ägare, förändringarna i portföljallokeringarna för dessa ägare och andra mått. Siffran sträcker sig från 0 till 100, där högre siffror indikerar en högre nivå av ackumulering i förhållande till sina konkurrenter, och 50 är genomsnittet.
Uppdateringsfrekvens: Dagligen
Se Ownership Explorer, som innehåller en lista över de högst rankade företagen.
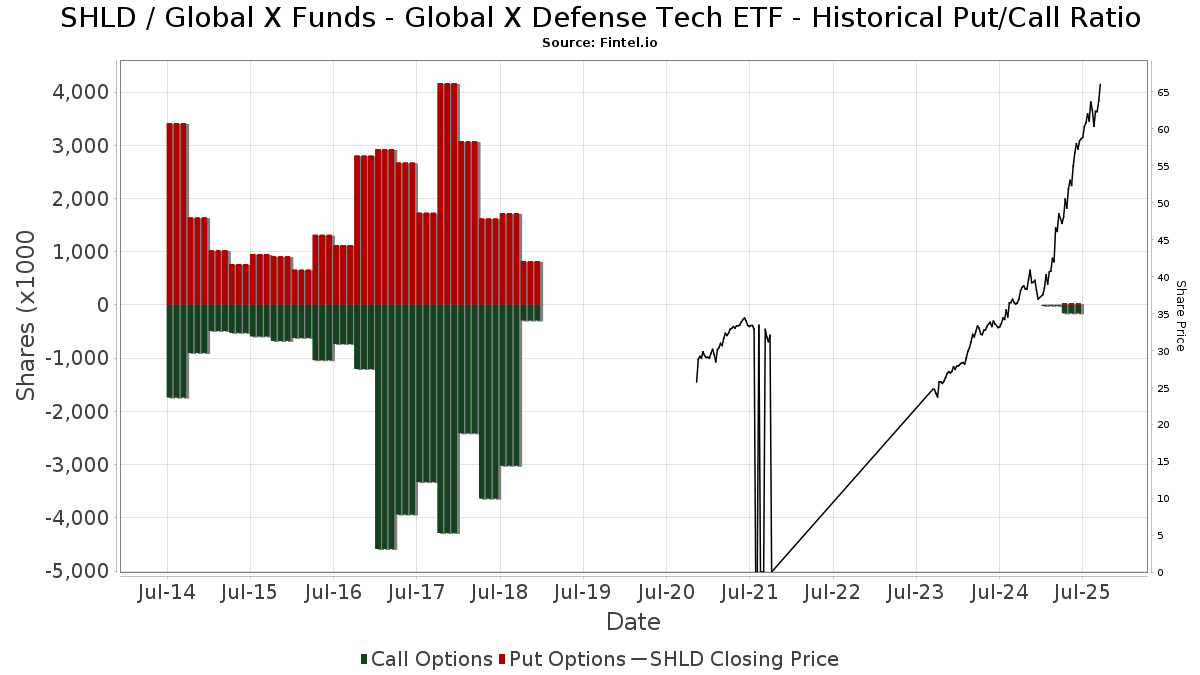
Institutionell sälj/köp-kvot
Förutom att rapportera vanliga eget kapital- och skuldemissioner måste institutioner med mer än 100MM tillgångar under förvaltning också avslöja sina innehav av sälj- och köpoptioner. Eftersom säljoptioner i allmänhet indikerar ett negativt sentiment och köpoptioner indikerar ett positivt sentiment, kan vi få en uppfattning om det övergripande institutionella sentimentet genom att plotta förhållandet mellan säljoptioner och köpoptioner. Diagrammet till höger visar det historiska förhållandet mellan sälj- och köpoptioner för detta instrument.
Genom att använda sälj/köp-kvoten som en indikator på aktieägarnas sentiment undviker man en av de största bristerna med att använda det totala institutionella ägandet, nämligen att en betydande del av de förvaltade tillgångarna investeras passivt för att följa index. Passivt förvaltade fonder köper vanligtvis inte optioner, så indikatorn för sälj/köp-kvoten ger en bättre bild av stämningen i aktivt förvaltade fonder.
13F- och NPORT-arkiveringar
Detaljer om 13F-arkiveringar är gratis. Detaljer om NP-arkiveringar kräver ett premiummedlemskap. Gröna rader indikerar nya positioner. Röda rader indikerar stängda positioner. Klicka på länk symbolen för att se hela transaktionshistoriken.
Uppgradera
för att låsa upp premiumdata och exportera till Excel ![]() .
.
| Fil Datum | Källa | Investerare | Typ | Genomsnittligt pris (beräknat) |
Aktier | Δ Aktier (%) |
Rapporterat värde (1000 USD) |
Δ Värde (%) |
Portföljallokering (%) |
|
|---|---|---|---|---|---|---|---|---|---|---|
| 2025-08-11 | 13F | Kirtland Hills Capital Management, Llc | 6 923 | 417 | ||||||
| 2025-08-05 | 13F | American Institute for Advanced Investment Management, LLP | 11 630 | 701 | ||||||
| 2025-07-31 | 13F | Cambridge Investment Research Advisors, Inc. | 174 566 | 81,78 | 11 | 150,00 | ||||
| 2025-07-18 | 13F | Truist Financial Corp | 8 322 | 58,09 | 501 | 104,49 | ||||
| 2025-08-13 | 13F | BCJ Capital Management, LLC | 7 694 | 464 | ||||||
| 2025-07-08 | 13F | Zrc Wealth Management, Llc | 1 888 | 182,21 | 114 | 264,52 | ||||
| 2025-08-11 | 13F | Wealthspire Advisors, LLC | 10 885 | 45,17 | 656 | 87,68 | ||||
| 2025-08-14 | 13F | D. E. Shaw & Co., Inc. | 161 965 | 9 758 | ||||||
| 2025-08-11 | 13F | Private Advisor Group, LLC | 45 592 | 2 747 | ||||||
| 2025-08-12 | 13F | Inscription Capital, LLC | 5 725 | 345 | ||||||
| 2025-08-12 | 13F | OneAscent Financial Services LLC | 12 079 | 1 | ||||||
| 2025-08-14 | 13F | Qube Research & Technologies Ltd | 29 734 | 3 654,29 | 1 791 | 4 875,00 | ||||
| 2025-07-17 | 13F | HB Wealth Management, LLC | 6 261 | 377 | ||||||
| 2025-07-08 | 13F | Baker Ellis Asset Management LLC | 3 360 | 202 | ||||||
| 2025-07-07 | 13F | Fox Hill Wealth Management | 3 663 | 221 | ||||||
| 2025-04-23 | 13F | Mascagni Wealth Management, Inc. | 0 | −100,00 | 0 | −100,00 | ||||
| 2025-07-17 | 13F | Oak Family Advisors, Llc | 153 014 | 140,34 | 9 219 | 211,14 | ||||
| 2025-08-13 | 13F | Keystone Financial Group | 5 285 | 15,42 | 318 | 49,30 | ||||
| 2025-07-09 | 13F | Sterling Manor Financial, LLC | 123 111 | −16,94 | 7 418 | 7,51 | ||||
| 2025-05-15 | 13F | Certior Financial Group, Llc | 0 | −100,00 | 0 | |||||
| 2025-05-01 | 13F | Diversify Wealth Management, Llc | 0 | −100,00 | 0 | |||||
| 2025-08-13 | 13F | Brown Advisory Inc | 18 868 | 82,95 | 1 137 | 136,67 | ||||
| 2025-08-12 | 13F | Pathstone Holdings, LLC | 4 950 | 298 | ||||||
| 2025-08-05 | 13F | Bank of New York Mellon Corp | 7 353 | 38,32 | 443 | 79,35 | ||||
| 2025-04-30 | 13F | Cerity Partners LLC | 0 | −100,00 | 0 | |||||
| 2025-07-15 | 13F | StoneCrest Wealth Management, Inc. | 74 645 | 4 497 | ||||||
| 2025-08-12 | 13F | MAI Capital Management | 17 293 | 40,67 | 1 042 | 81,99 | ||||
| 2025-08-11 | 13F | HighTower Advisors, LLC | 14 611 | 880 | ||||||
| 2025-08-05 | 13F | Dunhill Financial, LLC | 250 | 0,00 | 15 | 36,36 | ||||
| 2025-06-30 | NP | SMILX - SMI 50/40/10 Fund | 19 910 | 1 032 | ||||||
| 2025-07-08 | 13F | Parallel Advisors, LLC | 1 702 | 103 | ||||||
| 2025-08-06 | 13F | Ethos Financial Group, LLC | 55 561 | −4,49 | 3 354 | 53,57 | ||||
| 2025-07-22 | 13F | Kercheville Advisors, LLC | 4 700 | 283 | ||||||
| 2025-08-18 | 13F | Wolverine Trading, Llc | Call | 33 100 | 1 959 | |||||
| 2025-07-28 | 13F | RFG Advisory, LLC | 17 816 | 7,66 | 1 073 | 39,35 | ||||
| 2025-08-15 | 13F | Equitable Holdings, Inc. | 25 717 | 73,28 | 1 549 | 124,49 | ||||
| 2025-08-07 | 13F | Resources Investment Advisors, LLC. | 4 748 | −3,71 | 286 | 24,89 | ||||
| 2025-08-14 | 13F | Royal Bank Of Canada | 699 226 | 36,53 | 42 129 | 76,72 | ||||
| 2025-07-29 | 13F | TFC Financial Management | 0 | −100,00 | 0 | |||||
| 2025-08-08 | 13F | Creative Planning | 4 198 | 253 | ||||||
| 2025-07-16 | 13F | Perigon Wealth Management, LLC | 49 270 | 2 969 | ||||||
| 2025-07-10 | 13F | Signal Advisors Wealth, LLC | 9 103 | 45,65 | 548 | 88,97 | ||||
| 2025-07-16 | 13F | Signaturefd, Llc | 167 | 209,26 | 10 | 400,00 | ||||
| 2025-07-24 | 13F | IFP Advisors, Inc | 8 999 | 260,97 | 542 | 367,24 | ||||
| 2025-07-24 | 13F | Us Bancorp \de\ | 500 | 30 | ||||||
| 2025-08-01 | 13F | First Command Advisory Services, Inc. | 539 | 32 | ||||||
| 2025-07-16 | 13F | Highline Wealth Partners Llc | 3 425 | 1 270,00 | 206 | 1 772,73 | ||||
| 2025-08-08 | 13F | Cetera Investment Advisers | 253 522 | 189,77 | 15 275 | 275,10 | ||||
| 2025-08-14 | 13F | Old Mission Capital Llc | 29 446 | −69,99 | 1 774 | −61,16 | ||||
| 2025-08-06 | 13F | Hallmark Capital Management Inc | 98 396 | −9,57 | 5 928 | 17,06 | ||||
| 2025-08-13 | 13F | Custom Index Systems, Llc | 10 274 | 43,19 | 619 | 85,89 | ||||
| 2025-08-15 | 13F | Morgan Stanley | 1 711 271 | 124,79 | 103 104 | 190,95 | ||||
| 2025-07-31 | 13F/A | Avion Wealth | 1 000 | 0 | ||||||
| 2025-08-07 | 13F | Investment Management Corp /va/ /adv | 35 | 2 | ||||||
| 2025-08-13 | 13F | Per Stirling Capital Management, LLC. | 7 724 | 465 | ||||||
| 2025-07-31 | 13F | Trademark Financial Management, LLC | 4 300 | 259 | ||||||
| 2025-05-12 | 13F | Sandy Spring Bank | 0 | −100,00 | 0 | |||||
| 2025-08-13 | 13F | Renaissance Technologies Llc | 76 897 | 4 633 | ||||||
| 2025-08-08 | 13F | Evolution Wealth Advisors, LLC | 28 650 | 1 726 | ||||||
| 2025-07-10 | 13F | Wealth Enhancement Advisory Services, Llc | 3 936 | 233 | ||||||
| 2025-07-10 | 13F | Focus Financial Network, Inc. | 0 | −100,00 | 0 | |||||
| 2025-07-16 | 13F | ORG Partners LLC | 17 565 | 3,00 | 1 034 | 28,93 | ||||
| 2025-08-12 | 13F | Jpmorgan Chase & Co | 291 846 | 202,12 | 17 584 | 291,08 | ||||
| 2025-07-14 | 13F | Westend Capital Management LLC | 25 | 2 | ||||||
| 2025-08-07 | 13F | Cascade Financial Partners, LLC | 12 457 | 0,06 | 751 | 29,53 | ||||
| 2025-08-12 | 13F | Proequities, Inc. | 0 | 0 | ||||||
| 2025-08-14 | 13F | Wells Fargo & Company/mn | 6 960 | −34,18 | 419 | −14,84 | ||||
| 2025-08-11 | 13F | Alteri Wealth LLC | 4 827 | 12,18 | 291 | 45,00 | ||||
| 2025-08-18 | 13F | Hollencrest Capital Management | 25 | 0,00 | 2 | 0,00 | ||||
| 2025-08-13 | 13F | Centiva Capital, LP | 35 000 | 2 109 | ||||||
| 2025-08-13 | 13F | Northwestern Mutual Wealth Management Co | 5 708 | 89,89 | 344 | 146,76 | ||||
| 2025-08-14 | 13F | Toroso Investments, LLC | 38 000 | 2 290 | ||||||
| 2025-08-11 | 13F | Regal Investment Advisors LLC | 5 079 | 306 | ||||||
| 2025-08-14 | 13F | Visionary Wealth Advisors | 9 013 | −31,94 | 543 | −11,85 | ||||
| 2025-05-07 | 13F | Norden Group Llc | 0 | −100,00 | 0 | |||||
| 2025-08-13 | 13F | Colonial Trust Advisors | 150 | 9 | ||||||
| 2025-08-14 | 13F | CoreCap Advisors, LLC | 65 | 18,18 | 4 | 50,00 | ||||
| 2025-05-13 | 13F | Alliance Wealth Advisors, LLC /UT | 0 | −100,00 | 0 | |||||
| 2025-08-08 | 13F | SBI Securities Co., Ltd. | 9 633 | 580 | ||||||
| 2025-05-12 | 13F | Townsquare Capital Llc | 0 | −100,00 | 0 | |||||
| 2025-08-13 | 13F | Jones Financial Companies Lllp | 0 | −100,00 | 0 | −100,00 | ||||
| 2025-09-04 | 13F/A | Advisor Group Holdings, Inc. | 372 597 | 111,03 | 22 448 | 173,16 | ||||
| 2025-08-14 | 13F | Raymond James Financial Inc | 427 821 | −56,16 | 25 776 | −43,26 | ||||
| 2025-05-07 | 13F | Prosperity Consulting Group, LLC | 0 | −100,00 | 0 | |||||
| 2025-07-24 | 13F | Stonebridge Financial Group, LLC | 0 | −100,00 | 0 | |||||
| 2025-08-13 | 13F | Cresset Asset Management, LLC | 5 482 | 331 | ||||||
| 2025-08-05 | 13F | Prosperity Wealth Management, Inc. | 10 642 | 25,67 | 641 | 62,69 | ||||
| 2025-08-07 | 13F | New England Private Wealth Advisors LLC | 9 973 | 86,13 | 609 | 144,58 | ||||
| 2025-08-04 | 13F | Atria Investments Llc | 15 123 | 84,54 | 911 | 139,11 | ||||
| 2025-08-14 | 13F | Mariner, LLC | 21 754 | 1 311 | ||||||
| 2025-08-14 | 13F | Comerica Bank | 7 280 | −9,39 | 439 | 17,43 | ||||
| 2025-07-30 | 13F | Bleakley Financial Group, LLC | 27 340 | 1 647 | ||||||
| 2025-08-14 | 13F | MIRAE ASSET GLOBAL ETFS HOLDINGS Ltd. | 1 063 557 | 342,13 | 63 393 | 466,40 | ||||
| 2025-08-18 | 13F/A | National Bank Of Canada /fi/ | 37 478 | 108,79 | 2 256 | 170,50 | ||||
| 2025-07-30 | NP | ENDW - Cambria Endowment Style ETF | 21 | 1 | ||||||
| 2025-08-04 | 13F | Migdal Insurance & Financial Holdings Ltd. | 0 | −100,00 | 0 | |||||
| 2025-08-04 | 13F | Pensionmark Financial Group, Llc | 41 195 | 78,98 | 2 482 | 131,65 | ||||
| 2025-08-04 | 13F | Virtus Family Office LLC | 9 746 | 0,00 | 588 | 29,80 | ||||
| 2025-08-14 | 13F | Beck Capital Management, Llc | 163 698 | 53,57 | 9 863 | 98,75 | ||||
| 2025-08-13 | 13F | JT Stratford LLC | 3 850 | 232 | ||||||
| 2025-08-12 | 13F | Bravias Capital Group, LLC | 5 333 | 321 | ||||||
| 2025-07-11 | 13F | Farther Finance Advisors, LLC | 15 585 | 939 | ||||||
| 2025-08-13 | 13F | Walleye Capital LLC | 18 835 | 1 135 | ||||||
| 2025-07-16 | 13F | Strategic Investment Solutions, Inc. /IL | 873 | 31,48 | 53 | 73,33 | ||||
| 2025-07-11 | 13F | Pinnacle Bancorp, Inc. | 79 | 5 | ||||||
| 2025-08-13 | 13F | Channing Global Advisors, Llc | 49 | 0,00 | 3 | 0,00 | ||||
| 2025-08-12 | 13F | Insigneo Advisory Services, Llc | 7 133 | 11,75 | 430 | 44,44 | ||||
| 2025-08-14 | 13F | CIBC World Markets Inc. | 24 451 | 1 473 | ||||||
| 2025-08-05 | 13F | Bank Of Montreal /can/ | 7 139 | 1 099,83 | 430 | 1 492,59 | ||||
| 2025-08-14 | 13F | Great Valley Advisor Group, Inc. | 12 578 | 28,16 | 758 | 66,01 | ||||
| 2025-08-12 | 13F | Hillsdale Investment Management Inc. | 120 | 166,67 | 7 | 250,00 | ||||
| 2025-05-13 | 13F | Marathon Trading Investment Management LLC | 0 | −100,00 | 0 | |||||
| 2025-05-01 | 13F | 3EDGE Asset Management, LP | 0 | −100,00 | 0 | |||||
| 2025-07-10 | 13F | Sharkey, Howes & Javer | 92 574 | 4,45 | 5 578 | 35,20 | ||||
| 2025-07-18 | 13F | Marks Wealth, LLC | 230 922 | 13 913 | ||||||
| 2025-08-14 | 13F | Mml Investors Services, Llc | 223 498 | 141,85 | 13 | 225,00 | ||||
| 2025-08-14 | 13F | Menora Mivtachim Holdings Ltd. | 22 050 | 69,62 | 1 329 | 119,50 | ||||
| 2025-08-15 | 13F | Prevail Innovative Wealth Advisors, Llc | 33 935 | 2 045 | ||||||
| 2025-07-22 | 13F | Belpointe Asset Management LLC | 52 707 | 644,24 | 3 176 | 865,05 | ||||
| 2025-08-11 | 13F | Western Wealth Management, LLC | 3 652 | 220 | ||||||
| 2025-08-07 | 13F | Proficio Capital Partners LLC | 100 694 | 6 067 | ||||||
| 2025-07-07 | 13F | Investors Research Corp | 683 | 0,44 | 41 | 32,26 | ||||
| 2025-08-13 | 13F | Tranquilli Financial Advisor LLC | 10 005 | 603 | ||||||
| 2025-07-23 | 13F | Clear Creek Financial Management, LLC | 5 730 | 345 | ||||||
| 2025-08-12 | 13F | Manchester Capital Management LLC | 3 447 | 208 | ||||||
| 2025-07-22 | 13F | Valeo Financial Advisors, LLC | 3 838 | 231 | ||||||
| 2025-08-14 | 13F | Citadel Advisors Llc | 137 105 | 521,00 | 8 261 | 704,28 | ||||
| 2025-08-14 | 13F | Citadel Advisors Llc | Put | 20 700 | 2 200,00 | 1 247 | 2 941,46 | |||
| 2025-07-22 | 13F | Brown Miller Wealth Management, LLC | 14 861 | −0,19 | 895 | 29,15 | ||||
| 2025-07-29 | 13F | Swmg, Llc | 3 639 | 221 | ||||||
| 2025-08-14 | 13F | Citadel Advisors Llc | Call | 55 600 | 55 500,00 | 3 350 | 83 625,00 | |||
| 2025-08-05 | 13F | Chase Investment Counsel Corp | 10 997 | 1 | ||||||
| 2025-07-15 | 13F | BigSur Wealth Management LLC | 13 245 | 800 | ||||||
| 2025-07-07 | 13F | Nova Wealth Management, Inc. | 152 | 9 | ||||||
| 2025-08-11 | 13F | Intrepid Financial Planning Group LLC | 4 730 | 285 | ||||||
| 2025-08-08 | 13F | New England Capital Financial Advisors LLC | 132 | 8 | ||||||
| 2025-08-04 | 13F | Integrity Alliance, Llc. | 13 706 | 826 | ||||||
| 2025-08-07 | 13F | Kestra Private Wealth Services, Llc | 10 884 | 9,09 | 656 | 41,16 | ||||
| 2025-08-12 | 13F | O'shaughnessy Asset Management, Llc | 671 | −55,27 | 40 | −42,03 | ||||
| 2025-08-14 | 13F | Bank Of America Corp /de/ | 3 522 494 | 74,09 | 212 230 | 125,33 | ||||
| 2025-04-23 | 13F | Continuum Advisory, LLC | 0 | −100,00 | 0 | −100,00 | ||||
| 2025-07-17 | 13F | Janney Montgomery Scott LLC | 14 073 | 6,57 | 1 | |||||
| 2025-08-14 | 13F | Jane Street Group, Llc | 320 000 | 161,70 | 19 280 | 238,72 | ||||
| 2025-07-29 | 13F | Stratos Wealth Partners, LTD. | 95 310 | 183,80 | 5 742 | 267,37 | ||||
| 2025-08-14 | 13F/A | Rockefeller Capital Management L.P. | 48 442 | 22,39 | 2 919 | 58,41 | ||||
| 2025-07-23 | 13F | Capstone Wealth Management Group, Llc | 0 | −100,00 | 0 | |||||
| 2025-07-16 | 13F | St Germain D J Co Inc | 122 | 7 | ||||||
| 2025-08-14 | 13F | Integrated Wealth Concepts LLC | 4 279 | 258 | ||||||
| 2025-08-14 | 13F | Gotham Asset Management, LLC | 17 702 | 1,24 | 1 067 | 31,12 | ||||
| 2025-08-06 | 13F | SOUTH STATE Corp | 0 | −100,00 | 0 | |||||
| 2025-08-15 | 13F | Keel Point, LLC | 40 032 | −0,06 | 2 412 | 29,35 | ||||
| 2025-08-19 | 13F | Advisory Services Network, LLC | 16 482 | 1 011 | ||||||
| 2025-07-11 | 13F | First PREMIER Bank | 650 | 0,00 | 0 | |||||
| 2025-07-29 | 13F | Activest Wealth Management | 0 | 0 | ||||||
| 2025-08-08 | 13F | Principal Financial Group Inc | 28 039 | 1 689 | ||||||
| 2025-07-21 | 13F | Ameritas Advisory Services, LLC | 1 790 | 108 | ||||||
| 2025-08-14 | 13F | Benjamin Edwards Inc | 381 878 | −24,65 | 23 008 | −2,48 | ||||
| 2025-08-08 | 13F | Comprehensive Financial Planning, Inc./PA | 0 | −100,00 | 0 | |||||
| 2025-08-01 | 13F | Vision Financial Markets Llc | 100 | 6 | ||||||
| 2025-08-11 | 13F | Principal Securities, Inc. | 18 501 | 7 300,40 | 1 115 | 12 277,78 | ||||
| 2025-08-05 | 13F | Sigma Planning Corp | 7 844 | 473 | ||||||
| 2025-08-12 | 13F | Terra Nova Asset Management LLC | 23 414 | 1,41 | 1 411 | 31,28 | ||||
| 2025-08-12 | 13F | Edmond De Rothschild Holding S.a. | 20 233 | 0,00 | 1 219 | 29,54 | ||||
| 2025-08-12 | 13F | Financial Advocates Investment Management | 28 748 | 10,15 | 1 732 | 42,67 | ||||
| 2025-08-14 | 13F | Financial Network Wealth Advisors LLC | 129 | 0,00 | 8 | 16,67 | ||||
| 2025-07-28 | 13F | Mutual Advisors, LLC | 3 505 | 217 | ||||||
| 2025-07-30 | 13F | Prosperity Financial Group, Inc. | 23 105 | 0,28 | 1 392 | 29,85 | ||||
| 2025-07-15 | 13F | Mather Group, Llc. | 0 | −100,00 | 0 | |||||
| 2025-08-08 | 13F | Gts Securities Llc | 25 392 | 1 530 | ||||||
| 2025-05-14 | 13F | Flow Traders U.s. Llc | 0 | −100,00 | 0 | |||||
| 2025-08-13 | 13F | Lauer Wealth, LLC | 10 164 | 622 | ||||||
| 2025-07-31 | 13F | Oppenheimer & Co Inc | 62 153 | 25,41 | 3 745 | 62,36 | ||||
| 2025-08-15 | 13F | Tower Research Capital LLC (TRC) | 166 | 10 | ||||||
| 2025-04-14 | 13F | Toth Financial Advisory Corp | 0 | −100,00 | 0 | |||||
| 2025-05-05 | 13F | Diversify Advisory Services, LLC | 0 | −100,00 | 0 | |||||
| 2025-08-05 | 13F | Financial Sense Advisors, Inc. | 66 616 | 39,44 | 4 014 | 80,52 | ||||
| 2025-08-08 | 13F | Parker Investment Management, LLC | 319 966 | 19 278 | ||||||
| 2025-07-28 | 13F | Copia Wealth Management | 1 383 | 83 | ||||||
| 2025-08-12 | 13F | Marshall & Sterling Wealth Advisors Inc. | 2 661 | 160 | ||||||
| 2025-05-09 | 13F | GeoWealth Management, LLC | 0 | −100,00 | 0 | |||||
| 2025-08-14 | 13F | Manufacturers Life Insurance Company, The | 5 365 | 323 | ||||||
| 2025-08-06 | 13F | Commonwealth Equity Services, Llc | 104 078 | 91,75 | 6 | 200,00 | ||||
| 2025-04-24 | 13F | Gold Investment Management Ltd. | 0 | −100,00 | 0 | |||||
| 2025-08-11 | 13F | Inspire Advisors, LLC | 4 765 | 287 | ||||||
| 2025-08-01 | 13F | Y-Intercept (Hong Kong) Ltd | 4 021 | 242 | ||||||
| 2025-05-15 | 13F | National Wealth Management Group, LLC | 7 914 | 42,21 | 368 | 76,92 | ||||
| 2025-07-18 | 13F | SMI Advisory Services, LLC | 159 858 | 9 724 | ||||||
| 2025-08-04 | 13F | Joseph P. Lucia & Associates, LLC | 5 048 | 0,00 | 304 | 29,91 | ||||
| 2025-08-13 | 13F | Smith, Moore & Co. | 8 737 | 16,52 | 526 | 50,72 | ||||
| 2025-08-14 | 13F | Hrt Financial Lp | 14 650 | 1 | ||||||
| 2025-08-13 | 13F | Summit Financial, LLC | 5 678 | 343 | ||||||
| 2025-08-14 | 13F | MGB Wealth Management, LLC | 18 654 | 23,15 | 1 123 | 59,29 | ||||
| 2025-05-15 | 13F | Vista Cima Wealth Management LLC | 45 000 | 0 | ||||||
| 2025-08-08 | 13F | Kingsview Wealth Management, LLC | 4 180 | 252 | ||||||
| 2025-08-14 | 13F | Horizon Investments, LLC | 4 | 0 | ||||||
| 2025-08-07 | 13F | Financially Speaking Inc | 88 580 | 5 337 | ||||||
| 2025-08-12 | 13F | Change Path, LLC | 0 | −100,00 | 0 | |||||
| 2025-08-14 | 13F | First International Bank of Israel Ltd. | 37 490 | 2 259 | ||||||
| 2025-07-30 | 13F | Bogart Wealth, LLC | 45 | 3 | ||||||
| 2025-08-07 | 13F | Pinnacle Wealth Management Advisory Group, LLC | 5 000 | 0,00 | 301 | 29,74 | ||||
| 2025-08-06 | 13F | AE Wealth Management LLC | 145 647 | 6 288,03 | 8 775 | 8 178,30 | ||||
| 2025-07-15 | 13F | North Star Investment Management Corp. | 800 | 819,54 | 48 | 2 300,00 | ||||
| 2025-07-25 | 13F | Cwm, Llc | 1 311 | 20,83 | 0 | |||||
| 2025-08-08 | 13F | POM Investment Strategies, LLC | 933 | 56 | ||||||
| 2025-07-30 | 13F | Wallace Advisory Group, LLC | 0 | −100,00 | 0 | |||||
| 2025-08-08 | 13F | Thoroughbred Financial Services, Llc | 20 242 | 304,84 | 1 | |||||
| 2025-08-14 | 13F | UBS Group AG | 142 236 | −34,03 | 8 570 | −14,62 | ||||
| 2025-08-01 | 13F | Solstein Capital, LLC | 24 410 | 12 680,10 | 1 471 | 18 275,00 | ||||
| 2025-07-30 | 13F | D.a. Davidson & Co. | 22 648 | 33,34 | 1 365 | 72,66 | ||||
| 2025-08-14 | 13F | Stifel Financial Corp | 486 463 | −22,55 | 29 310 | 0,25 | ||||
| 2025-08-19 | 13F | Newbridge Financial Services Group, Inc. | 75 | 5 | ||||||
| 2025-04-28 | 13F | American Capital Advisory, LLC | 0 | −100,00 | 0 | |||||
| 2025-08-08 | 13F | Pnc Financial Services Group, Inc. | 100 | 6 | ||||||
| 2025-07-17 | 13F | Tempus Wealth Planning, LLC | 4 103 | 247 | ||||||
| 2025-07-16 | 13F | Essex Financial Services, Inc. | 7 125 | 429 | ||||||
| 2025-08-12 | 13F | Global Retirement Partners, LLC | 1 927 | 116 | ||||||
| 2025-05-15 | 13F | Mercer Global Advisors Inc /adv | 0 | −100,00 | 0 | |||||
| 2025-07-25 | 13F | LRI Investments, LLC | 750 | 45 | ||||||
| 2025-07-15 | 13F | Financial Partners Group, Inc | 6 673 | 402 | ||||||
| 2025-07-30 | 13F | Crewe Advisors LLC | 1 741 | 105 | ||||||
| 2025-08-14 | 13F | Susquehanna International Group, Llp | Put | 8 500 | 512 | |||||
| 2025-05-14 | 13F | CIBC Private Wealth Group, LLC | 0 | −100,00 | 0 | −100,00 | ||||
| 2025-07-29 | 13F | Ballast, Inc. | 5 048 | 304 | ||||||
| 2025-08-14 | 13F | Susquehanna International Group, Llp | 37 989 | 17,80 | 2 289 | 52,43 | ||||
| 2025-08-26 | 13F/A | Thrivent Financial For Lutherans | 495 610 | 30 | ||||||
| 2025-07-22 | 13F | Foguth Wealth Management, LLC. | 9 188 | 47,01 | 554 | 90,69 | ||||
| 2025-08-04 | 13F | Pinnacle Associates Ltd | 9 675 | 9,32 | 583 | 41,61 | ||||
| 2025-08-12 | 13F | LPL Financial LLC | 1 995 676 | 71,62 | 120 239 | 122,13 | ||||
| 2025-08-01 | 13F | James Investment Research Inc | 74 020 | 55,68 | 4 460 | 101,49 | ||||
| 2025-07-22 | 13F | Merit Financial Group, LLC | 79 331 | −51,93 | 4 780 | −37,79 | ||||
| 2025-08-01 | 13F | Envestnet Asset Management Inc | 124 237 | 91,79 | 7 485 | 148,26 | ||||
| 2025-08-07 | 13F | Allworth Financial LP | 240 | 0,00 | 14 | 16,67 | ||||
| 2025-07-01 | 13F | Confluence Investment Management Llc | 160 759 | −26,72 | 9 686 | −5,15 | ||||
| 2025-08-20 | 13F/A | Thompson Davis & Co., Inc. | 6 000 | 362 | ||||||
| 2025-07-24 | 13F | Cascade Investment Group, Inc. | 3 545 | 214 | ||||||
| 2025-08-04 | 13F | Hantz Financial Services, Inc. | 101 | 0 | ||||||
| 2025-08-11 | 13F | Aptus Capital Advisors, LLC | 3 389 | 204 | ||||||
| 2025-08-14 | 13F | Potentia Wealth | 0 | −100,00 | 0 | |||||
| 2025-07-11 | 13F | Seacrest Wealth Management, Llc | 4 363 | 263 | ||||||
| 2025-07-16 | 13F | Owen LaRue, LLC | 14 626 | −12,68 | 881 | 13,09 | ||||
| 2025-08-01 | 13F | Brookwood Investment Group LLC | 3 844 | 232 | ||||||
| 2025-08-13 | 13F | EverSource Wealth Advisors, LLC | 23 | 1 | ||||||
| 2025-07-30 | 13F | Phoenix Holdings Ltd. | 139 088 | 6,53 | 8 381 | 37,91 | ||||
| 2025-08-12 | 13F | Steward Partners Investment Advisory, Llc | 71 785 | 773,40 | 4 325 | 1 032,20 | ||||
| 2025-08-14 | 13F | Susquehanna International Group, Llp | Call | 65 900 | 435,77 | 3 970 | 594,06 | |||
| 2025-08-05 | 13F | Obermeyer Wood Investment Counsel, Lllp | 4 155 | 250 | ||||||
| 2025-08-27 | 13F/A | Brinker Capital Investments, LLC | 14 201 | 856 | ||||||
| 2025-08-29 | NP | JAVAX - James Aggressive Allocation Fund | 4 500 | 271 | ||||||
| 2025-05-14 | 13F | Stelac Advisory Services LLC | 0 | −100,00 | 0 | |||||
| 2025-08-28 | NP | TFAFX - Tactical Growth Allocation Fund Class I | 735 | 44 | ||||||
| 2025-08-18 | 13F | Geneos Wealth Management Inc. | 1 235 | 131,71 | 74 | 208,33 | ||||
| 2025-08-13 | 13F | Twin Peaks Wealth Advisors, LLC | 43 | 3 | ||||||
| 2025-08-08 | 13F | Hartland & Co., LLC | 100 | 6 | ||||||
| 2025-08-12 | 13F | Archer Investment Corp | 2 015 | 121 | ||||||
| 2025-08-29 | 13F | Evolution Wealth Management Inc. | 413 | 25 | ||||||
| 2025-04-21 | 13F | Ronald Blue Trust, Inc. | 0 | −100,00 | 0 | |||||
| 2025-04-10 | 13F | Portside Wealth Group, LLC | 42 560 | 0,00 | 1 592 | 0,00 | ||||
| 2025-08-05 | 13F | Simplex Trading, Llc | 25 233 | 2 | ||||||
| 2025-08-22 | 13F | Carter Financial Group, INC. | 26 842 | 1 620 | ||||||
| 2025-07-22 | 13F | Valley National Advisers Inc | 576 | 0 | ||||||
| 2025-07-02 | 13F | HBW Advisory Services LLC | 14 209 | 178,39 | 856 | 261,18 | ||||
| 2025-08-11 | 13F | Rothschild Investment Llc | 150 | 0,00 | 9 | 50,00 | ||||
| 2025-07-28 | 13F | WJ Wealth Management, LLC | 145 268 | 8 752 | ||||||
| 2025-07-25 | 13F | Apollon Wealth Management, LLC | 12 230 | 36,50 | 737 | 76,50 | ||||
| 2025-08-14 | 13F | Fmr Llc | 310 | −26,19 | 19 | −5,26 | ||||
| 2025-05-14 | 13F | Ameriprise Financial Inc | 0 | −100,00 | 0 | −100,00 | ||||
| 2025-08-12 | 13F | XTX Topco Ltd | 4 333 | 261 | ||||||
| 2025-07-21 | 13F | Mirae Asset Global Investments Co., Ltd. | 12 160 | −74,13 | 733 | −66,51 | ||||
| 2025-07-29 | 13F | Private Trust Co Na | 2 426 | 348,43 | 146 | 484,00 | ||||
| 2025-07-14 | 13F | AdvisorNet Financial, Inc | 2 209 | 133 | ||||||
| 2025-08-04 | 13F | Spire Wealth Management | 200 | 12 | ||||||
| 2025-08-29 | NP | GLRBX - James Balanced: Golden Rainbow Fund Retail Class | 32 502 | 12,53 | 1 958 | 45,68 | ||||
| 2025-07-08 | 13F | Nbc Securities, Inc. | 714 | 207,76 | 0 | |||||
| 2025-05-16 | 13F | Arete Wealth Advisors, LLC | 0 | −100,00 | 0 | |||||
| 2025-08-06 | 13F | Founders Financial Securities Llc | 9 485 | 571 | ||||||
| 2025-08-12 | 13F | Quadcap Wealth Management, LLC | 92 688 | −7,91 | 5 584 | 19,19 | ||||
| 2025-08-14 | 13F | Riggs Asset Managment Co. Inc. | 119 643 | 7 208 | ||||||
| 2025-08-08 | 13F | Larson Financial Group LLC | 1 985 | 120 | ||||||
| 2025-07-15 | 13F | Herbst Group, Llc | 58 562 | 5,49 | 3 528 | 36,53 | ||||
| 2025-08-12 | 13F | J.w. Cole Advisors, Inc. | 11 266 | 34,31 | 679 | 73,85 | ||||
| 2025-06-30 | NP | SMIFX - Sound Mind Investing Fund | 21 340 | 1 106 | ||||||
| 2025-07-23 | 13F | Hall Capital Management Co Inc | 3 500 | 211 | ||||||
| 2025-08-11 | 13F | Y.D. More Investments Ltd | 21 575 | −1,93 | 1 300 | 26,86 | ||||
| 2025-07-31 | 13F | Glass Jacobson Investment Advisors llc | 361 | 22 | ||||||
| 2025-08-08 | 13F | Avantax Advisory Services, Inc. | 10 818 | 652 | ||||||
| 2025-08-14 | 13F | Family Office Research LLC | 5 218 | 0,00 | 314 | 29,75 | ||||
| 2025-07-21 | 13F | Synergy Financial Management, LLC | 25 869 | 1 559 | ||||||
| 2025-08-11 | 13F | TD Waterhouse Canada Inc. | 23 570 | 217,87 | 1 386 | 297,13 | ||||
| 2025-07-22 | 13F | IMC-Chicago, LLC | 16 852 | 1 015 | ||||||
| 2025-08-15 | 13F | CI Private Wealth, LLC | 11 187 | 674 | ||||||
| 2025-08-13 | 13F | Great Diamond Partners, LLC | 39 323 | 2 369 | ||||||
| 2025-08-06 | 13F | Prospera Financial Services Inc | 5 487 | 331 | ||||||
| 2025-08-07 | 13F | Sound View Wealth Advisors Group, LLC | 4 800 | 289 | ||||||
| 2025-08-12 | 13F | Prudential Plc | 74 800 | −7,77 | 4 507 | 19,36 | ||||
| 2025-08-15 | 13F | Kestra Advisory Services, LLC | 7 588 | 72,53 | 457 | 124,02 | ||||
| 2025-07-09 | 13F | David J Yvars Group | 6 445 | 388 | ||||||
| 2025-08-14 | 13F | Federation des caisses Desjardins du Quebec | 3 525 | 49,05 | 212 | 92,73 | ||||
| 2025-08-26 | NP | USAF - Atlas America Fund | 7 843 | 473 | ||||||
| 2025-08-14 | 13F | GWM Advisors LLC | 21 791 | −22,45 | 1 313 | 0,31 | ||||
| 2025-07-22 | 13F | Bank Hapoalim Bm | 35 410 | 2,08 | 2 | 100,00 | ||||
| 2025-08-13 | 13F | Quadrature Capital Ltd | 333 665 | 20 110 |