Grundläggande statistik
| Institutionella ägare | 113 total, 113 long only, 0 short only, 0 long/short - change of 3,67% MRQ |
| Genomsnittlig portföljallokering | 0.4661 % - change of −33,94% MRQ |
| Institutionella aktier (lång) | 14 138 300 (ex 13D/G) - change of −4,45MM shares −23,94% MRQ |
| Institutionellt värde (lång) | $ 413 883 USD ($1000) |
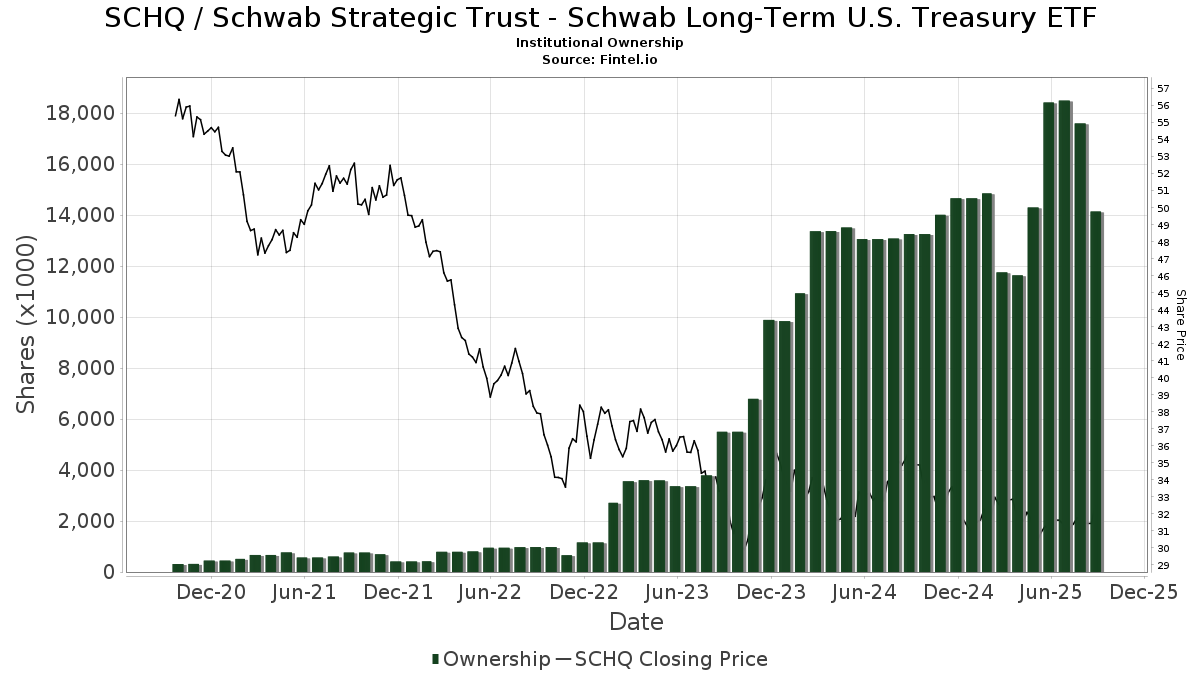
Institutionellt ägande och aktieägare
Schwab Strategic Trust - Schwab Long-Term U.S. Treasury ETF (US:SCHQ) har 113 Institutionella ägare och aktieägare som har lämnat in 13D/G- eller 13F-formulär till Securities Exchange Commission (SEC). Dessa institut innehar totalt 14,138,300 aktier. Största aktieägare inkluderar Envestnet Asset Management Inc, Mirae Asset Global Investments Co., Ltd., LPL Financial LLC, Mml Investors Services, Llc, Toroso Investments, LLC, Werba Rubin Papier Wealth Management, Ambassador Advisors, LLC, Jpmorgan Chase & Co, Raymond James Financial Inc, and Morgan Stanley .
Schwab Strategic Trust - Schwab Long-Term U.S. Treasury ETF (ARCA:SCHQ) Institutionell ägarstruktur visar institutioners och fonders nuvarande positioner i företaget, samt de senaste förändringarna i positionernas storlek. Större aktieägare kan vara enskilda investerare, fonder, hedgefonder eller institutioner. Bilaga 13D visar att investeraren äger (eller ägde) mer än 5% av företaget och avser (eller avsåg) att aktivt eftersträva en förändring av affärsstrategin. Schedule 13G indikerar en passiv investering på över 5%.
The share price as of September 15, 2025 is 32,57 / share. Previously, on September 16, 2024, the share price was 35,98 / share. This represents a decline of 9,48% over that period.
Fondsentimentets poäng
Fondsentimentet poängen(fka Ägarackumulation-poäng) visar vilka aktier som är mest köpta av fonder. Det är resultatet av en sofistikerad kvantitativ flerfaktormodell som identifierar företag med de högsta nivåerna av institutionell ackumulering. Poängsättningsmodellen använder en kombination av den totala ökningen av redovisade ägare, förändringarna i portföljallokeringarna för dessa ägare och andra mått. Siffran sträcker sig från 0 till 100, där högre siffror indikerar en högre nivå av ackumulering i förhållande till sina konkurrenter, och 50 är genomsnittet.
Uppdateringsfrekvens: Dagligen
Se Ownership Explorer, som innehåller en lista över de högst rankade företagen.
Institutionell sälj/köp-kvot
Förutom att rapportera vanliga eget kapital- och skuldemissioner måste institutioner med mer än 100MM tillgångar under förvaltning också avslöja sina innehav av sälj- och köpoptioner. Eftersom säljoptioner i allmänhet indikerar ett negativt sentiment och köpoptioner indikerar ett positivt sentiment, kan vi få en uppfattning om det övergripande institutionella sentimentet genom att plotta förhållandet mellan säljoptioner och köpoptioner. Diagrammet till höger visar det historiska förhållandet mellan sälj- och köpoptioner för detta instrument.
Genom att använda sälj/köp-kvoten som en indikator på aktieägarnas sentiment undviker man en av de största bristerna med att använda det totala institutionella ägandet, nämligen att en betydande del av de förvaltade tillgångarna investeras passivt för att följa index. Passivt förvaltade fonder köper vanligtvis inte optioner, så indikatorn för sälj/köp-kvoten ger en bättre bild av stämningen i aktivt förvaltade fonder.
13F- och NPORT-arkiveringar
Detaljer om 13F-arkiveringar är gratis. Detaljer om NP-arkiveringar kräver ett premiummedlemskap. Gröna rader indikerar nya positioner. Röda rader indikerar stängda positioner. Klicka på länk symbolen för att se hela transaktionshistoriken.
Uppgradera
för att låsa upp premiumdata och exportera till Excel ![]() .
.
| Fil Datum | Källa | Investerare | Typ | Genomsnittligt pris (beräknat) |
Aktier | Δ Aktier (%) |
Rapporterat värde (1000 USD) |
Δ Värde (%) |
Portföljallokering (%) |
|
|---|---|---|---|---|---|---|---|---|---|---|
| 2025-07-18 | 13F | Trust Co Of Vermont | 372 | 12 | ||||||
| 2025-07-14 | 13F/A | Seek First Inc. | 33 532 | 2,32 | 1 069 | −0,37 | ||||
| 2025-08-04 | 13F | Assetmark, Inc | 0 | −100,00 | 0 | |||||
| 2025-08-14 | 13F | Mariner, LLC | 7 828 | 250 | ||||||
| 2025-08-01 | 13F | Envestnet Asset Management Inc | 3 145 610 | −17,27 | 100 314 | −19,47 | ||||
| 2025-08-14 | 13F | Fmr Llc | 0 | −100,00 | 0 | |||||
| 2025-07-07 | 13F | Versant Capital Management, Inc | 1 161 | 0,00 | 37 | −2,63 | ||||
| 2025-07-30 | 13F | Strategic Blueprint, LLC | 17 488 | 5,08 | 558 | 2,20 | ||||
| 2025-04-29 | 13F | DT Investment Partners, LLC | 0 | −100,00 | 0 | −100,00 | ||||
| 2025-08-14 | 13F | Warren Averett Asset Management, LLC | 53 814 | 1 716 | ||||||
| 2025-07-31 | 13F | Cambridge Investment Research Advisors, Inc. | 13 212 | −33,75 | 0 | |||||
| 2025-08-14 | 13F | Principia Wealth Advisory, LLC | 4 133 | 132 | ||||||
| 2025-05-14 | 13F | Oarsman Capital, Inc. | 0 | −100,00 | 0 | |||||
| 2025-05-15 | 13F | GWM Advisors LLC | 0 | −100,00 | 0 | −100,00 | ||||
| 2025-08-14 | 13F | Hrt Financial Lp | 24 298 | 1 | ||||||
| 2025-08-14 | 13F | Susquehanna International Group, Llp | 27 447 | 875 | ||||||
| 2025-07-14 | 13F | Park Avenue Securities Llc | 198 526 | 6 | ||||||
| 2025-04-24 | 13F | ZynergyRetirementPlanningLLC | 0 | −100,00 | 0 | |||||
| 2025-08-14 | 13F | Raymond James Financial Inc | 354 611 | −0,13 | 11 309 | −2,78 | ||||
| 2025-07-30 | 13F | Eqis Capital Management, Inc. | 0 | −100,00 | 0 | |||||
| 2025-08-05 | 13F | Meridian Management Co | 16 145 | 508 | ||||||
| 2025-08-08 | 13F | Cetera Investment Advisers | 251 891 | −23,61 | 8 033 | −25,64 | ||||
| 2025-08-14 | 13F | Smartleaf Asset Management LLC | 23 | −54,90 | 1 | −100,00 | ||||
| 2025-05-12 | 13F | C2P Capital Advisory Group, LLC d.b.a. Prosperity Capital Advisors | 0 | −100,00 | 0 | −100,00 | ||||
| 2025-09-10 | 13F | WT Wealth Management | 91 288 | 4,46 | 2 911 | 1,71 | ||||
| 2025-08-12 | 13F | Centric Wealth Management | 143 603 | 8,66 | 4 538 | 4,80 | ||||
| 2025-07-24 | 13F | Beacon Bridge Wealth Partners, LLC | 204 119 | 18,29 | 6 509 | 15,14 | ||||
| 2025-05-05 | 13F | Financial Advisory Service, Inc. | 0 | −100,00 | 0 | |||||
| 2025-08-08 | 13F | Foundations Investment Advisors, LLC | 36 272 | 8,74 | 1 157 | 5,86 | ||||
| 2025-08-12 | 13F | Global Retirement Partners, LLC | 465 | 70,33 | 15 | 75,00 | ||||
| 2025-08-08 | 13F | Kaizen Financial Strategies | 118 697 | −6,40 | 3 785 | −8,88 | ||||
| 2025-07-11 | 13F | SILVER OAK SECURITIES, Inc | 30 923 | 4,30 | 986 | 2,39 | ||||
| 2025-08-05 | 13F | Prosperity Wealth Management, Inc. | 36 432 | 10,50 | 1 162 | 7,50 | ||||
| 2025-07-17 | 13F | Park Place Capital Corp | 886 | 176,88 | 28 | 180,00 | ||||
| 2025-08-25 | NP | SWJRX - Schwab Monthly Income Fund - Moderate Payout This fund is a listed as child fund of Charles Schwab Investment Management Inc and if that institution has disclosed ownership in this security, then these positions will not be double counted when calculating total shares and total value | 90 094 | 22,04 | 2 873 | 18,82 | ||||
| 2025-05-13 | 13F | Quadrature Capital Ltd | 0 | −100,00 | 0 | −100,00 | ||||
| 2025-08-06 | 13F | Stokes Family Office, LLC | 0 | −100,00 | 0 | |||||
| 2025-07-16 | 13F | MBE Wealth Management, LLC | 9 800 | 313 | ||||||
| 2025-08-04 | 13F | Creative Financial Designs Inc /adv | 2 956 | 2,07 | 94 | 0,00 | ||||
| 2025-04-30 | 13F | Stratos Wealth Advisors, LLC | 0 | −100,00 | 0 | |||||
| 2025-08-08 | 13F | Pnc Financial Services Group, Inc. | 97 | 3 | ||||||
| 2025-07-07 | 13F | RDA Financial Network | 9 317 | 16,99 | 297 | 14,23 | ||||
| 2025-07-17 | 13F | Keystone Global Partners, LLC | 70 351 | 43,61 | 2 243 | 39,84 | ||||
| 2025-07-30 | 13F | Exencial Wealth Advisors, Llc | 13 307 | −1,66 | 424 | −4,29 | ||||
| 2025-08-13 | 13F | Twin Peaks Wealth Advisors, LLC | 372 | 12 | ||||||
| 2025-08-29 | 13F | Total Investment Management Inc | 17 437 | −99,44 | 556 | −99,45 | ||||
| 2025-08-14 | 13F | Mml Investors Services, Llc | 816 205 | −15,40 | 26 | −16,13 | ||||
| 2025-07-09 | 13F | Fermata Advisors, LLC | 37 628 | 1,42 | 1 200 | −1,32 | ||||
| 2025-07-28 | 13F | Eq Wealth Advisors, Llc | 0 | −100,00 | 0 | |||||
| 2025-08-25 | NP | SWKRX - Schwab Monthly Income Fund - Enhanced Payout This fund is a listed as child fund of Charles Schwab Investment Management Inc and if that institution has disclosed ownership in this security, then these positions will not be double counted when calculating total shares and total value | 147 593 | 10,44 | 4 707 | 7,49 | ||||
| 2025-08-06 | 13F | Commonwealth Equity Services, Llc | 14 923 | 0 | ||||||
| 2025-05-02 | 13F | Signaturefd, Llc | 0 | −100,00 | 0 | |||||
| 2025-08-11 | 13F | Wealthgarden F.s. Llc | 7 583 | −33,72 | 239 | −36,36 | ||||
| 2025-07-29 | 13F | Barden Capital Management, Inc. | 42 279 | −2,78 | 1 348 | −5,34 | ||||
| 2025-08-14 | 13F | Jane Street Group, Llc | 69 909 | 2 229 | ||||||
| 2025-07-25 | 13F | Van Strum & Towne Inc. | 35 006 | −13,68 | 1 116 | −15,96 | ||||
| 2025-07-29 | 13F | Birmingham Capital Management Co Inc/al | 119 550 | −19,22 | 3 812 | −21,37 | ||||
| 2025-08-12 | 13F | BlackRock, Inc. | 4 594 | 168,34 | 147 | 160,71 | ||||
| 2025-07-10 | 13F | Trust Point Inc. | 31 744 | 1,59 | 1 012 | −1,08 | ||||
| 2025-07-21 | 13F | Mirae Asset Global Investments Co., Ltd. | 1 389 378 | 6,47 | 44 307 | 4,44 | ||||
| 2025-08-18 | 13F/A | National Bank Of Canada /fi/ | 97 800 | 3 119 | ||||||
| 2025-08-11 | 13F | Aptus Capital Advisors, LLC | 2 911 | −37,30 | 93 | −39,47 | ||||
| 2025-08-05 | 13F | Claro Advisors LLC | 0 | −100,00 | 0 | |||||
| 2025-08-13 | 13F | Flow Traders U.s. Llc | 0 | −100,00 | 0 | |||||
| 2025-08-12 | 13F | Jpmorgan Chase & Co | 374 273 | −23,03 | 11 936 | −25,07 | ||||
| 2025-09-04 | 13F/A | Advisor Group Holdings, Inc. | 36 311 | −4,83 | 1 158 | −7,36 | ||||
| 2025-07-30 | 13F | Bogart Wealth, LLC | 1 300 | 0,00 | 41 | −2,38 | ||||
| 2025-08-14 | 13F | Toroso Investments, LLC | 685 981 | −10,18 | 21 777 | −12,96 | ||||
| 2025-08-14 | 13F | Integrated Wealth Concepts LLC | 17 299 | 70,79 | 552 | 66,47 | ||||
| 2025-08-14 | 13F | Ameriprise Financial Inc | 287 241 | 7,46 | 9 161 | 4,61 | ||||
| 2025-07-17 | 13F | Charles Schwab Trust Co | 61 006 | −13,47 | 1 945 | −15,76 | ||||
| 2025-07-24 | 13F | Galvin, Gaustad & Stein, LLC | 72 514 | −11,91 | 2 312 | −14,24 | ||||
| 2025-07-24 | 13F | IFP Advisors, Inc | 22 207 | 2,69 | 708 | 0,00 | ||||
| 2025-08-05 | 13F | Bank of New York Mellon Corp | 149 449 | 783,01 | 4 766 | 760,11 | ||||
| 2025-07-15 | 13F | Fifth Third Bancorp | 0 | −100,00 | 0 | |||||
| 2025-07-25 | 13F | Atria Wealth Solutions, Inc. | 0 | −100,00 | 0 | |||||
| 2025-07-28 | 13F | Harbour Investments, Inc. | 355 | 0,00 | 11 | 0,00 | ||||
| 2025-08-08 | 13F | Larson Financial Group LLC | 829 | 1,10 | 26 | 0,00 | ||||
| 2025-08-06 | 13F | Wsfs Capital Management, Llc | 16 951 | −10,98 | 541 | −13,32 | ||||
| 2025-07-25 | 13F | Envestnet Portfolio Solutions, Inc. | 57 972 | −58,55 | 1 849 | −59,67 | ||||
| 2025-08-12 | 13F | Proequities, Inc. | 0 | 0 | ||||||
| 2025-08-14 | 13F | Citadel Advisors Llc | 15 100 | −49,05 | 482 | −50,41 | ||||
| 2025-07-22 | 13F | IFS Advisors, LLC | 0 | −100,00 | 0 | |||||
| 2025-08-25 | 13F | Silverlake Wealth Management Llc | 11 083 | −41,72 | 353 | −43,25 | ||||
| 2025-07-22 | 13F | Carolina Wealth Advisors, LLC | 29 497 | 941 | ||||||
| 2025-05-16 | 13F | Jones Financial Companies Lllp | 0 | −100,00 | 0 | |||||
| 2025-07-29 | 13F | Werba Rubin Papier Wealth Management | 578 340 | −8,61 | 18 443 | −11,03 | ||||
| 2025-08-15 | 13F | Hayek Kallen Investment Management | 10 250 | 0,00 | 0 | |||||
| 2025-04-29 | 13F | Bolthouse Investments, LLC | 0 | −100,00 | 0 | |||||
| 2025-08-13 | 13F | EverSource Wealth Advisors, LLC | 3 772 | 0,00 | 120 | −2,44 | ||||
| 2025-07-14 | 13F | Armstrong Advisory Group, Inc | 70 | −98,81 | 2 | −98,91 | ||||
| 2025-08-11 | 13F | Private Advisor Group, LLC | 0 | −100,00 | 0 | |||||
| 2025-07-07 | 13F | Horizons Wealth Management | 777 | 0,00 | 25 | −4,00 | ||||
| 2025-08-12 | 13F | Atlas Capital Advisors Llc | 1 606 | 51 | ||||||
| 2025-05-09 | 13F | GeoWealth Management, LLC | 0 | −100,00 | 0 | |||||
| 2025-08-14 | 13F | Goldman Sachs Group Inc | 159 820 | 67,96 | 5 097 | 63,49 | ||||
| 2025-08-14 | 13F | UBS Group AG | 0 | −100,00 | 0 | −100,00 | ||||
| 2025-08-14 | 13F | IHT Wealth Management, LLC | 16 933 | −23,32 | 540 | −25,45 | ||||
| 2025-07-22 | 13F | Merit Financial Group, LLC | 9 351 | −8,32 | 298 | −10,78 | ||||
| 2025-07-24 | 13F | Antonelli Financial Advisors, LLC | 38 663 | 6,14 | 1 233 | 3,27 | ||||
| 2025-08-11 | 13F | Regal Investment Advisors LLC | 16 440 | −32,89 | 524 | −34,66 | ||||
| 2025-06-03 | 13F | Invst, LLC | 38 640 | 332,70 | 1 266 | 351,79 | ||||
| 2025-07-15 | 13F | Attessa Capital LLC | 104 818 | 23,42 | 3 348 | 20,31 | ||||
| 2025-08-26 | 13F/A | Thrivent Financial For Lutherans | 63 022 | 2 | ||||||
| 2025-07-08 | 13F | Strategic Advocates LLC | 7 215 | 230 | ||||||
| 2025-07-23 | 13F | Clear Creek Financial Management, LLC | 55 315 | −24,90 | 1 764 | −26,91 | ||||
| 2025-07-25 | 13F | Northwest Capital Management Inc | 16 816 | −43,24 | 536 | −44,74 | ||||
| 2025-07-28 | 13F | Mutual Advisors, LLC | 58 344 | 1,68 | 1 826 | −0,81 | ||||
| 2025-08-14 | 13F | Bank Of America Corp /de/ | 99 236 | 8,75 | 3 165 | 5,85 | ||||
| 2025-09-11 | 13F | Milestones Private Investment Advisors LLC | 13 598 | 434 | ||||||
| 2025-08-12 | 13F | MAI Capital Management | 166 | −66,05 | 5 | −68,75 | ||||
| 2025-08-13 | 13F | Fisher Asset Management, LLC | 0 | −100,00 | 0 | |||||
| 2025-08-14 | 13F | L2 Asset Management, LLC | 157 688 | 7,75 | 5 029 | 4,88 | ||||
| 2025-06-30 | NP | SMIDX - SMI Dynamic Allocation Fund | 33 480 | 1 074 | ||||||
| 2025-07-14 | 13F | Sellwood Investment Partners LLC | 14 914 | 0,00 | 476 | −2,66 | ||||
| 2025-07-17 | 13F | Sound Income Strategies, LLC | 63 | 0,00 | 2 | 0,00 | ||||
| 2025-08-14 | 13F | Royal Bank Of Canada | 150 743 | −3,76 | 4 808 | −6,30 | ||||
| 2025-07-25 | 13F | Cwm, Llc | 13 645 | −48,42 | 0 | |||||
| 2025-07-30 | 13F | Brookstone Capital Management | 6 975 | −32,95 | 222 | −34,71 | ||||
| 2025-08-14 | 13F | Cardiff Park Advisors, Llc | 1 139 | 0,00 | 36 | −2,70 | ||||
| 2025-04-18 | 13F | Pacific Capital Wealth Advisors, Inc | 0 | −100,00 | 0 | |||||
| 2025-07-10 | 13F | Focus Financial Network, Inc. | 6 853 | −3,49 | 219 | −6,03 | ||||
| 2025-07-11 | 13F | Farther Finance Advisors, LLC | 4 750 | 11,22 | 151 | 7,86 | ||||
| 2025-08-15 | 13F | Morgan Stanley | 346 016 | 8,40 | 11 034 | 5,52 | ||||
| 2025-06-30 | NP | SMILX - SMI 50/40/10 Fund | 12 220 | 392 | ||||||
| 2025-07-30 | NP | WTBN - WisdomTree Bianco Total Return Fund | 19 777 | −83,05 | 618 | −84,05 | ||||
| 2025-07-14 | 13F | GAMMA Investing LLC | 0 | −100,00 | 0 | |||||
| 2025-07-30 | 13F | Wbh Advisory Inc | 85 591 | −24,55 | 2 729 | −26,56 | ||||
| 2025-08-14 | 13F | Ambassador Advisors, LLC | 425 447 | 3,77 | 13 568 | 1,02 | ||||
| 2025-08-12 | 13F | Sfmg, Llc | 333 091 | 13,19 | 10 622 | 10,19 | ||||
| 2025-07-25 | 13F | Sequoia Financial Advisors, LLC | 45 781 | −11,82 | 1 460 | −14,18 | ||||
| 2025-07-03 | 13F | Collective Family Office Llc | 76 129 | 17,48 | 2 428 | 14,37 | ||||
| 2025-08-12 | 13F | LPL Financial LLC | 951 610 | −5,56 | 30 347 | −8,07 | ||||
| 2025-07-16 | 13F | Magnus Financial Group LLC | 14 155 | −8,32 | 451 | −10,69 | ||||
| 2025-07-30 | 13F | LGT Financial Advisors LLC | 683 | 8,07 | 22 | 5,00 | ||||
| 2025-08-11 | 13F | Principal Securities, Inc. | 2 967 | −98,38 | 95 | −98,36 | ||||
| 2025-07-10 | 13F | Wealth Enhancement Advisory Services, Llc | 37 647 | −84,17 | 1 184 | −84,82 | ||||
| 2025-08-06 | 13F | AE Wealth Management LLC | 7 | −53,33 | 0 | |||||
| 2025-08-25 | NP | SWLRX - Schwab Monthly Income Fund - Maximum Payout This fund is a listed as child fund of Charles Schwab Investment Management Inc and if that institution has disclosed ownership in this security, then these positions will not be double counted when calculating total shares and total value | 107 338 | 6,69 | 3 423 | 3,88 | ||||
| 2025-04-23 | 13F | Valmark Advisers, Inc. | 0 | −100,00 | 0 | |||||
| 2025-08-08 | 13F | Tortoise Investment Management, LLC | 3 805 | −15,82 | 121 | −18,24 | ||||
| 2025-08-29 | NP | RAA - SMI 3Fourteen Real Asset Allocation ETF SMI 3Fourteen REAL Asset Allocation ETF | 309 616 | −56,11 | 9 874 | −57,28 | ||||
| 2025-08-14 | 13F | Napa Wealth Management | 0 | −100,00 | 0 | |||||
| 2025-08-13 | 13F | Bare Financial Services, Inc | 0 | −100,00 | 0 |