Grundläggande statistik
| Institutionella ägare | 227 total, 227 long only, 0 short only, 0 long/short - change of 4,59% MRQ |
| Genomsnittlig portföljallokering | 0.1711 % - change of −15,68% MRQ |
| Institutionella aktier (lång) | 14 621 531 (ex 13D/G) - change of 1,84MM shares 14,40% MRQ |
| Institutionellt värde (lång) | $ 1 148 393 USD ($1000) |
Institutionellt ägande och aktieägare
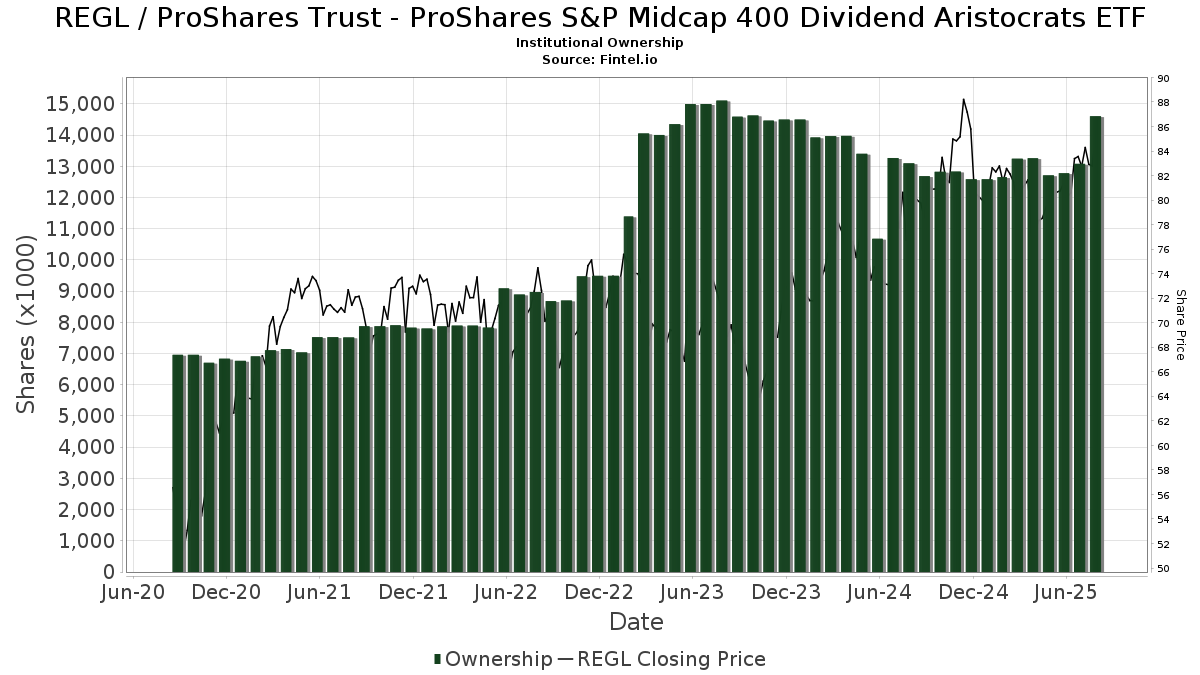
ProShares Trust - ProShares S&P Midcap 400 Dividend Aristocrats ETF (US:REGL) har 227 Institutionella ägare och aktieägare som har lämnat in 13D/G- eller 13F-formulär till Securities Exchange Commission (SEC). Dessa institut innehar totalt 14,621,531 aktier. Största aktieägare inkluderar Coldstream Capital Management Inc, Morgan Stanley, Stifel Financial Corp, Benjamin Edwards Inc, LPL Financial LLC, Raymond James Financial Inc, Wells Fargo & Company/mn, Northwestern Mutual Wealth Management Co, Bank Of America Corp /de/, and UBS Group AG .
ProShares Trust - ProShares S&P Midcap 400 Dividend Aristocrats ETF (BATS:REGL) Institutionell ägarstruktur visar institutioners och fonders nuvarande positioner i företaget, samt de senaste förändringarna i positionernas storlek. Större aktieägare kan vara enskilda investerare, fonder, hedgefonder eller institutioner. Bilaga 13D visar att investeraren äger (eller ägde) mer än 5% av företaget och avser (eller avsåg) att aktivt eftersträva en förändring av affärsstrategin. Schedule 13G indikerar en passiv investering på över 5%.
The share price as of September 19, 2025 is 84,71 / share. Previously, on September 23, 2024, the share price was 82,12 / share. This represents an increase of 3,15% over that period.
Fondsentimentets poäng
Fondsentimentet poängen(fka Ägarackumulation-poäng) visar vilka aktier som är mest köpta av fonder. Det är resultatet av en sofistikerad kvantitativ flerfaktormodell som identifierar företag med de högsta nivåerna av institutionell ackumulering. Poängsättningsmodellen använder en kombination av den totala ökningen av redovisade ägare, förändringarna i portföljallokeringarna för dessa ägare och andra mått. Siffran sträcker sig från 0 till 100, där högre siffror indikerar en högre nivå av ackumulering i förhållande till sina konkurrenter, och 50 är genomsnittet.
Uppdateringsfrekvens: Dagligen
Se Ownership Explorer, som innehåller en lista över de högst rankade företagen.
AI+ Ask Fintel’s AI assistant about ProShares Trust - ProShares S&P Midcap 400 Dividend Aristocrats ETF.
Thinking of good questions…
Institutionell sälj/köp-kvot
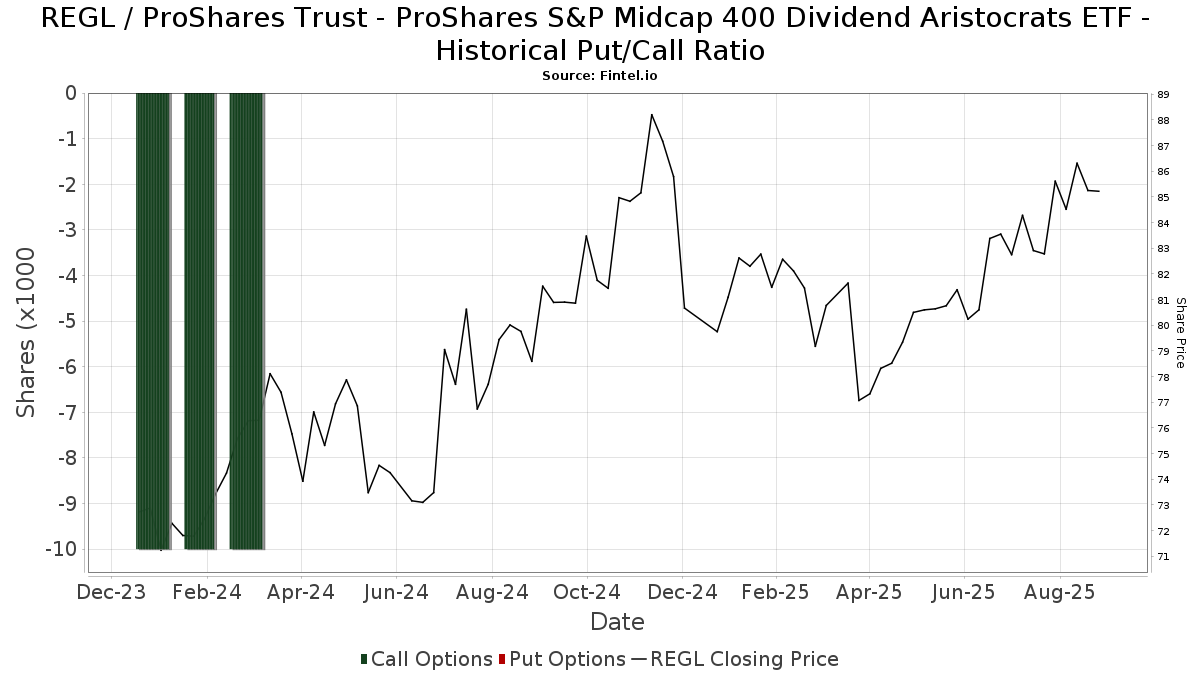
Förutom att rapportera vanliga eget kapital- och skuldemissioner måste institutioner med mer än 100MM tillgångar under förvaltning också avslöja sina innehav av sälj- och köpoptioner. Eftersom säljoptioner i allmänhet indikerar ett negativt sentiment och köpoptioner indikerar ett positivt sentiment, kan vi få en uppfattning om det övergripande institutionella sentimentet genom att plotta förhållandet mellan säljoptioner och köpoptioner. Diagrammet till höger visar det historiska förhållandet mellan sälj- och köpoptioner för detta instrument.
Genom att använda sälj/köp-kvoten som en indikator på aktieägarnas sentiment undviker man en av de största bristerna med att använda det totala institutionella ägandet, nämligen att en betydande del av de förvaltade tillgångarna investeras passivt för att följa index. Passivt förvaltade fonder köper vanligtvis inte optioner, så indikatorn för sälj/köp-kvoten ger en bättre bild av stämningen i aktivt förvaltade fonder.
13F- och NPORT-arkiveringar
Detaljer om 13F-arkiveringar är gratis. Detaljer om NP-arkiveringar kräver ett premiummedlemskap. Gröna rader indikerar nya positioner. Röda rader indikerar stängda positioner. Klicka på länk symbolen för att se hela transaktionshistoriken.
Uppgradera
för att låsa upp premiumdata och exportera till Excel ![]() .
.
| Fil Datum | Källa | Investerare | Typ | Genomsnittligt pris (beräknat) |
Aktier | Δ Aktier (%) |
Rapporterat värde (1000 USD) |
Δ Värde (%) |
Portföljallokering (%) |
|
|---|---|---|---|---|---|---|---|---|---|---|
| 2025-08-12 | 13F | Global Retirement Partners, LLC | 1 453 | 923,24 | 118 | 972,73 | ||||
| 2025-07-21 | 13F | Hilltop National Bank | 0 | −100,00 | 0 | |||||
| 2025-07-24 | 13F | MSH Capital Advisors LLC | 12 504 | 1,40 | 1 020 | 2,52 | ||||
| 2025-08-14 | 13F | Avant Capital LLC | 45 974 | −3,96 | 3 748 | −2,90 | ||||
| 2025-08-14 | 13F | Susquehanna International Group, Llp | 16 872 | 1 376 | ||||||
| 2025-08-13 | 13F | Baird Financial Group, Inc. | 306 993 | 1,27 | 25 031 | 2,38 | ||||
| 2025-08-12 | 13F | Financial Advocates Investment Management | 0 | −100,00 | 0 | |||||
| 2025-08-06 | 13F | Centerpoint Advisory Group | 2 998 | 0,00 | 244 | 1,24 | ||||
| 2025-08-14 | 13F | CoreCap Advisors, LLC | 90 | 0,00 | 7 | 0,00 | ||||
| 2025-08-14 | 13F | Heritage Wealth Management, Inc. | 6 767 | 2,30 | 552 | 3,38 | ||||
| 2025-07-23 | 13F | Armstrong, Fleming & Moore, Inc | 0 | −100,00 | 0 | |||||
| 2025-08-12 | 13F | J.w. Cole Advisors, Inc. | 10 290 | 8,05 | 839 | 9,24 | ||||
| 2025-07-01 | 13F | Confluence Investment Management Llc | 300 181 | 24 475 | ||||||
| 2025-05-01 | 13F | SkyOak Wealth, LLC | 0 | −100,00 | 0 | |||||
| 2025-08-08 | 13F | Biondo Investment Advisors, LLC | 22 983 | 5,18 | 1 874 | 6,30 | ||||
| 2025-08-11 | 13F | HighTower Advisors, LLC | 23 531 | 3,80 | 1 919 | 4,92 | ||||
| 2025-08-12 | 13F | MAI Capital Management | 439 | 0,23 | 36 | 0,00 | ||||
| 2025-08-14 | 13F | Citadel Advisors Llc | 13 877 | 1 131 | ||||||
| 2025-07-30 | 13F | Roman Butler Fullerton & Co | 13 612 | 4,27 | 1 147 | 13,24 | ||||
| 2025-08-07 | 13F | Cascade Financial Partners, LLC | 53 525 | −2,64 | 4 364 | −1,56 | ||||
| 2025-08-14 | 13F | Modern Wealth Management, LLC | 63 315 | 7,18 | 5 162 | 8,35 | ||||
| 2025-07-17 | 13F | Vermillion Wealth Management, Inc. | 261 | 21 | ||||||
| 2025-08-11 | 13F | Citigroup Inc | 1 | 0,00 | 0 | |||||
| 2025-07-18 | 13F | QTR Family Wealth, LLC | 2 959 | 0,44 | 241 | 1,69 | ||||
| 2025-08-19 | 13F | Anchor Investment Management, LLC | 3 303 | −2,34 | 269 | −1,10 | ||||
| 2025-08-11 | 13F | Aptus Capital Advisors, LLC | 4 086 | 0,64 | 333 | 1,83 | ||||
| 2025-08-19 | 13F | Cape Investment Advisory, Inc. | 227 | −3,40 | 19 | 0,00 | ||||
| 2025-07-17 | 13F | PMG Wealth Management, Inc. | 23 597 | −49,15 | 1 924 | −48,61 | ||||
| 2025-08-06 | 13F | Wedbush Securities Inc | 14 797 | 6,35 | 1 | 0,00 | ||||
| 2025-04-25 | 13F | Valley National Advisers Inc | 0 | −100,00 | 0 | |||||
| 2025-08-11 | 13F | CFS Investment Advisory Services, LLC | 7 577 | 22,27 | 1 | |||||
| 2025-07-11 | 13F | Westfuller Advisors, LLC | 6 304 | 0,64 | 516 | 1,57 | ||||
| 2025-08-05 | 13F | Huntington National Bank | 264 | −17,03 | ||||||
| 2025-08-04 | 13F | Assetmark, Inc | 499 | 5,72 | 41 | 5,26 | ||||
| 2025-07-16 | 13F | Essex Financial Services, Inc. | 46 883 | −1,82 | 3 823 | −0,75 | ||||
| 2025-08-13 | 13F | American Money Management, LLC | 3 451 | 2,74 | 281 | 4,07 | ||||
| 2025-08-14 | 13F | Visionary Wealth Advisors | 39 125 | 79,86 | 3 190 | 81,87 | ||||
| 2025-08-08 | 13F | Cetera Investment Advisers | 75 968 | 1,35 | 6 194 | 2,46 | ||||
| 2025-08-04 | 13F | IFG Advisory, LLC | 3 231 | −28,83 | 263 | −28,14 | ||||
| 2025-07-24 | 13F | Blair William & Co/il | 947 | 46,37 | 77 | 48,08 | ||||
| 2025-08-14 | 13F | Stifel Financial Corp | 882 721 | 1 163,05 | 71 973 | 1 177,00 | ||||
| 2025-08-19 | 13F | Advisory Services Network, LLC | 2 631 | −1,09 | 217 | 0,93 | ||||
| 2025-08-14 | 13F | Warren Averett Asset Management, LLC | 3 901 | 0,03 | 318 | 1,27 | ||||
| 2025-07-07 | 13F | Wesbanco Bank Inc | 5 678 | 0,00 | 463 | 1,09 | ||||
| 2025-07-11 | 13F | Caldwell Securities, Inc | 3 311 | 17,04 | 270 | 17,98 | ||||
| 2025-08-08 | 13F | Thoroughbred Financial Services, Llc | 2 960 | −8,53 | 0 | |||||
| 2025-08-13 | 13F | Northwestern Mutual Wealth Management Co | 540 284 | 0,27 | 44 052 | 1,37 | ||||
| 2025-07-24 | 13F | Us Bancorp \de\ | 4 063 | 0,00 | 331 | 1,22 | ||||
| 2025-08-13 | 13F | Jones Financial Companies Lllp | 63 552 | 33,55 | 5 181 | 35,74 | ||||
| 2025-08-08 | 13F | Larson Financial Group LLC | 842 | 0,00 | 69 | 1,49 | ||||
| 2025-08-14 | 13F | Keystone Financial Services, LLC | 4 644 | 32,31 | 379 | 33,57 | ||||
| 2025-08-04 | 13F | Pensionmark Financial Group, Llc | 44 934 | −0,04 | 3 664 | 1,05 | ||||
| 2025-08-08 | 13F | Creative Planning | 0 | −100,00 | 0 | |||||
| 2025-08-12 | 13F/A | Cozad Asset Management Inc | 12 307 | −2,42 | 1 003 | −1,38 | ||||
| 2025-07-30 | 13F | Parcion Private Wealth LLC | 8 364 | −15,34 | 682 | −14,45 | ||||
| 2025-08-14 | 13F | Ameriprise Financial Inc | 199 294 | 29,52 | 16 251 | 30,81 | ||||
| 2025-07-30 | 13F | FNY Investment Advisers, LLC | 500 | 0 | ||||||
| 2025-08-12 | 13F | Proequities, Inc. | 0 | 0 | ||||||
| 2025-08-11 | 13F | Principal Securities, Inc. | 5 568 | 972,83 | 454 | 1 004,88 | ||||
| 2025-08-01 | 13F | MorganRosel Wealth Management, LLC | 300 | 0,00 | 24 | 0,00 | ||||
| 2025-08-12 | 13F | Gladstone Institutional Advisory LLC | 44 638 | −3,84 | 3 640 | −2,78 | ||||
| 2025-08-15 | 13F | Kestra Advisory Services, LLC | 2 882 | 235 | ||||||
| 2025-07-30 | 13F | Cullen/frost Bankers, Inc. | 1 828 | 0,61 | 149 | 2,05 | ||||
| 2025-08-12 | 13F | O'shaughnessy Asset Management, Llc | 1 619 | 2,66 | 132 | 3,94 | ||||
| 2025-08-12 | 13F | Retirement Planning Co of New England, Inc. | 5 201 | −3,51 | 424 | −2,30 | ||||
| 2025-07-10 | 13F | Focus Financial Network, Inc. | 4 867 | 397 | ||||||
| 2025-08-14 | 13F | Royal Bank Of Canada | 299 906 | −5,66 | 24 452 | −4,63 | ||||
| 2025-08-14 | 13F | Qube Research & Technologies Ltd | 504 | 262,59 | 41 | 272,73 | ||||
| 2025-08-14 | 13F | Wells Fargo & Company/mn | 554 003 | −17,84 | 45 171 | −16,94 | ||||
| 2025-07-14 | 13F | Armstrong Advisory Group, Inc | 148 | 0,00 | 12 | 9,09 | ||||
| 2025-08-12 | 13F | PSI Advisors, LLC | 4 968 | −1,82 | 405 | −0,74 | ||||
| 2025-08-11 | 13F | Summit Wealth Partners, LLC | 39 395 | −23,85 | 3 212 | −23,01 | ||||
| 2025-08-14 | 13F | Financial Advisory Service, Inc. | 86 539 | 3,87 | 7 056 | 5,00 | ||||
| 2025-07-28 | 13F | Tower Wealth Partners, Inc. | 13 492 | 2,44 | 1 100 | 3,58 | ||||
| 2025-04-29 | 13F | Td Private Client Wealth Llc | 0 | −100,00 | 0 | |||||
| 2025-08-11 | 13F | United Advisor Group, LLC | 47 030 | −0,56 | 3 835 | 0,52 | ||||
| 2025-07-30 | 13F/A | KPP Advisory Services LLC | 4 414 | −0,07 | 360 | 0,84 | ||||
| 2025-08-15 | 13F | Morgan Stanley | 2 356 024 | 4,88 | 192 098 | 6,03 | ||||
| 2025-07-22 | 13F | Signature Wealth Management Partners, LLC | 2 515 | 205 | ||||||
| 2025-07-16 | 13F | Kerntke Otto McGlone Wealth Management Group | 38 463 | −0,08 | 3 136 | 1,03 | ||||
| 2025-08-14 | 13F | Integrated Wealth Concepts LLC | 2 868 | 9,97 | 234 | 10,95 | ||||
| 2025-08-12 | 13F | Country Trust Bank | 130 | 0,00 | 11 | 0,00 | ||||
| 2025-08-08 | 13F | L & S Advisors Inc | 9 950 | 0,00 | 811 | 1,12 | ||||
| 2025-08-12 | 13F | Coston, McIsaac & Partners | 7 | 0 | ||||||
| 2025-07-15 | 13F | Well Done, LLC | 4 185 | −1,23 | 341 | 0,00 | ||||
| 2025-07-15 | 13F | Main Street Group, LTD | 15 | 0,00 | 1 | 0,00 | ||||
| 2025-08-13 | 13F | Continuum Advisory, LLC | 0 | −100,00 | 0 | |||||
| 2025-07-29 | 13F | LMG Wealth Partners, LLC | 38 469 | −0,96 | 3 137 | 0,13 | ||||
| 2025-07-17 | 13F | Janney Montgomery Scott LLC | 52 698 | 30,38 | 4 | 33,33 | ||||
| 2025-08-04 | 13F | Spire Wealth Management | 1 139 | 0,62 | 93 | 1,10 | ||||
| 2025-08-14 | 13F | Great Valley Advisor Group, Inc. | 6 806 | −1,02 | 555 | 0,00 | ||||
| 2025-05-01 | 13F | Cutter & CO Brokerage, Inc. | 0 | −100,00 | 0 | |||||
| 2025-07-09 | 13F | Clarus Wealth Advisors | 6 315 | −7,72 | 525 | −0,38 | ||||
| 2025-07-29 | 13F | Chicago Partners Investment Group LLC | 3 200 | 0,00 | 270 | 6,32 | ||||
| 2025-08-11 | 13F | Intrepid Financial Planning Group LLC | 14 264 | 1,49 | 1 163 | 2,65 | ||||
| 2025-07-14 | 13F | Sowell Financial Services LLC | 4 178 | 12,92 | 341 | 14,09 | ||||
| 2025-07-17 | 13F/A | Capital Investment Advisors, LLC | 9 187 | −5,80 | 749 | −4,71 | ||||
| 2025-08-13 | 13F | Colonial Trust Co / SC | 2 500 | 0,00 | 204 | 1,00 | ||||
| 2025-08-14 | 13F | Wiley Bros.-aintree Capital, Llc | 255 649 | 42,25 | 20 847 | 44,62 | ||||
| 2025-08-05 | 13F | Sigma Planning Corp | 3 200 | 0,00 | 261 | 0,78 | ||||
| 2025-08-12 | 13F | Pathstone Holdings, LLC | 72 739 | −50,17 | 5 931 | −49,63 | ||||
| 2025-07-29 | 13F | Swmg, Llc | 7 674 | 42,14 | 642 | 51,77 | ||||
| 2025-08-04 | 13F | Pinnacle Associates Ltd | 51 164 | −26,58 | 4 172 | −25,77 | ||||
| 2025-08-14 | 13F | Mml Investors Services, Llc | 16 978 | 48,75 | 1 | |||||
| 2025-08-08 | 13F | Hartland & Co., LLC | 1 350 | 170,00 | 110 | 175,00 | ||||
| 2025-08-08 | 13F | Pnc Financial Services Group, Inc. | 4 782 | 73,14 | 390 | 75,23 | ||||
| 2025-07-31 | 13F | Hartford Financial Management Inc. | 4 000 | 0,00 | 326 | 1,24 | ||||
| 2025-08-15 | 13F | Equitable Holdings, Inc. | 5 961 | 19,29 | 486 | 20,60 | ||||
| 2025-08-11 | 13F | NewEdge Wealth, LLC | 6 150 | 0,00 | 509 | 2,63 | ||||
| 2025-08-15 | 13F | Captrust Financial Advisors | 2 560 | 209 | ||||||
| 2025-08-07 | 13F | Verus Capital Partners, Llc | 20 674 | −4,31 | 1 686 | −3,27 | ||||
| 2025-08-07 | 13F | CENTRAL TRUST Co | 222 | 18 | ||||||
| 2025-08-14 | 13F | Bank Of America Corp /de/ | 538 451 | 2,30 | 43 903 | 3,42 | ||||
| 2025-08-14 | 13F | EP Wealth Advisors, Inc. | 1 563 | −23,16 | 127 | −22,56 | ||||
| 2025-07-15 | 13F | tru Independence LLC | 6 719 | −1,35 | 548 | −0,36 | ||||
| 2025-08-14 | 13F | Comerica Bank | 14 153 | 58,35 | 1 154 | 60,14 | ||||
| 2025-07-21 | 13F | Ameriflex Group, Inc. | 0 | −100,00 | 0 | |||||
| 2025-07-25 | 13F | Landmark Wealth Management, LLC | 30 092 | −5,50 | 2 | 0,00 | ||||
| 2025-07-08 | 13F | Martin Capital Partners, LLC | 3 428 | 0 | ||||||
| 2025-07-11 | 13F | SILVER OAK SECURITIES, Inc | 84 687 | 51,14 | 6 905 | 53,63 | ||||
| 2025-07-22 | 13F | DAVENPORT & Co LLC | 4 785 | 0,00 | 390 | 1,30 | ||||
| 2025-07-23 | 13F | TriaGen Wealth Management LLC | 4 165 | 0,00 | 340 | 1,19 | ||||
| 2025-08-13 | 13F | SageView Advisory Group, LLC | 0 | −100,00 | 0 | |||||
| 2025-07-15 | 13F | Avaii Wealth Management, Llc | 0 | −100,00 | 0 | |||||
| 2025-07-16 | 13F | Meridian Financial, LLC | 2 622 | 0,15 | 214 | 0,95 | ||||
| 2025-08-08 | 13F | Kingsview Wealth Management, LLC | 3 949 | −21,15 | 322 | −20,35 | ||||
| 2025-07-28 | 13F | WealthPLAN Partners, LLC | 3 916 | −16,47 | 319 | −15,61 | ||||
| 2025-08-14 | 13F | Harvest Investment Services, LLC | 10 520 | 1,34 | 858 | 2,39 | ||||
| 2025-08-14 | 13F | GWM Advisors LLC | 46 099 | 21,88 | 3 759 | 23,21 | ||||
| 2025-08-12 | 13F | Jacobi Capital Management LLC | 58 180 | 4,82 | 4 744 | 5,97 | ||||
| 2025-08-12 | 13F | Accredited Wealth Management, LLC | 50 | 0,00 | 4 | 0,00 | ||||
| 2025-08-14 | 13F | Ancora Advisors, LLC | 400 | 0,00 | 33 | 0,00 | ||||
| 2025-07-11 | 13F | Farther Finance Advisors, LLC | 365 | 0,00 | 30 | 0,00 | ||||
| 2025-07-31 | 13F | Cambridge Investment Research Advisors, Inc. | 93 467 | 8,25 | 8 | 16,67 | ||||
| 2025-07-01 | 13F | Harbor Investment Advisory, Llc | 4 440 | 0,00 | 362 | 1,12 | ||||
| 2025-08-12 | 13F | Coldstream Capital Management Inc | 2 416 257 | −3,57 | 197 010 | −2,52 | ||||
| 2025-08-12 | 13F | BlackRock, Inc. | 144 | −42,40 | 12 | −45,00 | ||||
| 2025-07-21 | 13F | Empirical Financial Services, LLC d.b.a. Empirical Wealth Management | 2 643 | −10,32 | 215 | −9,28 | ||||
| 2025-07-11 | 13F | Essex Savings Bank | 4 376 | −0,27 | 357 | 0,85 | ||||
| 2025-08-11 | 13F | TD Waterhouse Canada Inc. | 380 | 0,00 | 31 | 3,33 | ||||
| 2025-07-10 | 13F | Wealth Enhancement Advisory Services, Llc | 21 932 | −0,28 | 1 836 | 3,55 | ||||
| 2025-08-14 | 13F | Aqr Capital Management Llc | 3 104 | 253 | ||||||
| 2025-08-14 | 13F | Connecticut Wealth Management, LLC | 76 434 | −2,05 | 6 232 | −0,97 | ||||
| 2025-08-12 | 13F | Howe & Rusling Inc | 1 622 | 5,87 | 132 | 7,32 | ||||
| 2025-08-14 | 13F | Mariner, LLC | 5 913 | 85,30 | 482 | 87,55 | ||||
| 2025-08-04 | 13F | Atria Investments Llc | 9 522 | 776 | ||||||
| 2025-07-14 | 13F | S.A. Mason LLC | 5 719 | 0,18 | 466 | 1,30 | ||||
| 2025-08-12 | 13F | Park Square Financial Group, LLC | 45 | 0,00 | 4 | 0,00 | ||||
| 2025-07-25 | 13F | Cwm, Llc | 804 | −3,60 | 0 | |||||
| 2025-08-15 | 13F | CI Private Wealth, LLC | 3 644 | −30,51 | 297 | −31,57 | ||||
| 2025-07-28 | 13F | WealthPlan Investment Management, LLC | 19 021 | 42,77 | 1 551 | 44,32 | ||||
| 2025-08-14 | 13F | Acorn Wealth Advisors, LLC | 7 719 | −17,97 | 629 | −17,02 | ||||
| 2025-08-04 | 13F | L.m. Kohn & Company | 8 589 | 0,02 | 700 | 1,16 | ||||
| 2025-07-09 | 13F | Dynamic Advisor Solutions LLC | 27 923 | −1,18 | 2 277 | −0,09 | ||||
| 2025-08-19 | 13F | National Asset Management, Inc. | 4 070 | −16,36 | 332 | −15,56 | ||||
| 2025-07-29 | 13F | Private Trust Co Na | 2 349 | 5,86 | 192 | 7,30 | ||||
| 2025-07-21 | 13F | Ameritas Advisory Services, LLC | 22 402 | −17,20 | 1 827 | −16,32 | ||||
| 2025-07-14 | 13F | Toth Financial Advisory Corp | 208 751 | 0,56 | 17 020 | 1,67 | ||||
| 2025-07-07 | 13F | RDA Financial Network | 5 109 | 3,63 | 417 | 4,79 | ||||
| 2025-07-24 | 13F | IFP Advisors, Inc | 513 | 0,00 | 42 | 0,00 | ||||
| 2025-08-01 | 13F | Envestnet Asset Management Inc | 120 002 | 59,65 | 9 784 | 61,43 | ||||
| 2025-08-12 | 13F | Wealthbridge Capital Management, Llc | 7 961 | −6,63 | 649 | −5,53 | ||||
| 2025-04-16 | 13F | Hoey Investments, Inc | 0 | −100,00 | 0 | |||||
| 2025-08-12 | 13F | Steward Partners Investment Advisory, Llc | 4 107 | −31,32 | 335 | −30,71 | ||||
| 2025-08-07 | 13F | Rossmore Private Capital | 3 425 | 279 | ||||||
| 2025-08-13 | 13F | Empire Financial Management Company, LLC | 2 502 | 0,00 | 204 | 1,49 | ||||
| 2025-08-13 | 13F | Azimuth Capital Investment Management LLC | 2 650 | 0,00 | 216 | 1,41 | ||||
| 2025-08-07 | 13F | Palisade Asset Management, LLC | 0 | −100,00 | 0 | |||||
| 2025-08-12 | 13F | Integrated Advisors Network LLC | 40 048 | 3 265 | ||||||
| 2025-08-21 | 13F | Pathway Financial Advisers, LLC | 5 979 | 1,03 | 487 | 2,10 | ||||
| 2025-07-22 | 13F | Kraematon Investment Advisors, Inc | 10 923 | −2,40 | 891 | −1,33 | ||||
| 2025-08-04 | 13F | Northwest Financial Advisors | 10 578 | −2,14 | 862 | −1,03 | ||||
| 2025-08-14 | 13F | Two Sigma Investments, Lp | 43 200 | −1,59 | 3 522 | −0,51 | ||||
| 2025-07-28 | 13F | BRYN MAWR TRUST Co | 337 | −11,32 | 27 | −10,00 | ||||
| 2025-04-11 | 13F | Insight Advisors, LLC/ PA | 0 | −100,00 | 0 | |||||
| 2025-08-14 | 13F/A | Rockefeller Capital Management L.P. | 35 711 | 15,39 | 2 912 | 16,67 | ||||
| 2025-08-18 | 13F | Tyler-Stone Wealth Management | 13 884 | 0,41 | 1 132 | 1,52 | ||||
| 2025-04-30 | 13F | Rehmann Capital Advisory Group | 0 | −100,00 | 0 | −100,00 | ||||
| 2025-08-14 | 13F | Raymond James Financial Inc | 663 035 | 2,31 | 54 061 | 3,43 | ||||
| 2025-07-07 | 13F | Thurston, Springer, Miller, Herd & Titak, Inc. | 0 | −100,00 | 0 | |||||
| 2025-07-31 | 13F | Oppenheimer & Co Inc | 4 942 | 0,22 | 403 | 1,26 | ||||
| 2025-07-15 | 13F | Bfsg, Llc | 351 | 0,00 | 29 | 0,00 | ||||
| 2025-08-07 | 13F | PFG Advisors | 7 238 | 8,16 | 590 | 9,46 | ||||
| 2025-08-08 | 13F | Gts Securities Llc | 0 | −100,00 | 0 | |||||
| 2025-08-14 | 13F | Royal Capital Wealth Management, LLC | 16 627 | 0,05 | 1 356 | 1,12 | ||||
| 2025-08-14 | 13F | UBS Group AG | 311 807 | −18,50 | 25 423 | −17,60 | ||||
| 2025-08-05 | 13F | Key FInancial Inc | 9 684 | 2,38 | 790 | 3,54 | ||||
| 2025-08-18 | 13F | Geneos Wealth Management Inc. | 6 897 | 13,89 | 562 | 15,16 | ||||
| 2025-08-11 | 13F | Nations Financial Group Inc, /ia/ /adv | 13 272 | −1,32 | 1 082 | −0,18 | ||||
| 2025-07-18 | 13F | Dogwood Wealth Management LLC | 67 009 | 6,94 | 5 576 | 10,33 | ||||
| 2025-08-06 | 13F | Aspect Partners, LLC | 460 | 0,66 | 38 | 2,78 | ||||
| 2025-05-14 | 13F | Van Hulzen Asset Management, LLC | 0 | −100,00 | 0 | |||||
| 2025-08-13 | 13F | Smith, Moore & Co. | 79 361 | 1,82 | 6 471 | 2,93 | ||||
| 2025-08-18 | 13F | Hollencrest Capital Management | 17 314 | 0,64 | 1 412 | 1,73 | ||||
| 2025-07-24 | 13F | Cyndeo Wealth Partners, LLC | 4 399 | 0,55 | 359 | 1,70 | ||||
| 2025-08-04 | 13F | Premier Path Wealth Partners, LLC | 30 585 | 1,39 | 2 494 | 2,51 | ||||
| 2025-07-18 | 13F | PFG Investments, LLC | 20 854 | −11,02 | 1 700 | −10,05 | ||||
| 2025-08-13 | 13F | Twin Peaks Wealth Advisors, LLC | 120 | 10 | ||||||
| 2025-09-04 | 13F/A | Advisor Group Holdings, Inc. | 124 250 | −1,46 | 10 151 | −0,39 | ||||
| 2025-05-12 | 13F | Sandy Spring Bank | 1 005 | 0,00 | 81 | 0,00 | ||||
| 2025-07-01 | 13F | Burkett Financial Services, Llc | 0 | −100,00 | 0 | |||||
| 2025-08-06 | 13F | Prospera Financial Services Inc | 4 667 | 381 | ||||||
| 2025-08-11 | 13F | Synergy Investment Management, LLC | 0 | −100,00 | 0 | |||||
| 2025-07-28 | 13F | Harbour Investments, Inc. | 31 072 | 27,26 | 2 533 | 28,64 | ||||
| 2025-08-06 | 13F | Moors & Cabot, Inc. | 3 372 | 0,00 | 275 | 1,11 | ||||
| 2025-07-24 | 13F | Capital Advisors, Ltd. LLC | 55 152 | −0,82 | 4 | 0,00 | ||||
| 2025-08-12 | 13F | Virtu Financial LLC | 2 563 | 0 | ||||||
| 2025-08-14 | 13F | Mercer Global Advisors Inc /adv | 11 657 | −34,40 | 950 | −33,71 | ||||
| 2025-08-15 | 13F | Tower Research Capital LLC (TRC) | 6 288 | 513 | ||||||
| 2025-07-09 | 13F | Key Client Fiduciary Advisors, LLC | 3 615 | 5,46 | 295 | 6,52 | ||||
| 2025-07-23 | 13F | Clear Creek Financial Management, LLC | 25 508 | 4,76 | 2 080 | 5,91 | ||||
| 2025-08-05 | 13F | BEAM Asset Management, LLC | 11 795 | 11,43 | 962 | 12,66 | ||||
| 2025-08-07 | 13F | Kestra Private Wealth Services, Llc | 6 086 | −0,52 | 496 | 0,61 | ||||
| 2025-07-07 | 13F | Nova Wealth Management, Inc. | 4 281 | 167,06 | 349 | 170,54 | ||||
| 2025-07-21 | 13F | DHJJ Financial Advisors, Ltd. | 798 | 0,00 | 65 | 1,56 | ||||
| 2025-07-10 | 13F | Western Pacific Wealth Management, LP | 1 040 | 85 | ||||||
| 2025-08-19 | 13F | Asset Dedication, LLC | 450 | 0,00 | 37 | 0,00 | ||||
| 2025-07-23 | 13F | Pure Portfolios Holdings Llc | 5 184 | −6,24 | 423 | −5,17 | ||||
| 2025-08-06 | 13F | Atlantic Union Bankshares Corp | 1 005 | 82 | ||||||
| 2025-08-08 | 13F | Avantax Advisory Services, Inc. | 9 303 | 1,43 | 759 | 2,57 | ||||
| 2025-08-05 | 13F | GPS Wealth Strategies Group, LLC | 3 093 | 0,03 | 252 | 1,20 | ||||
| 2025-08-04 | 13F | Flagship Harbor Advisors, Llc | 5 121 | 0,10 | 418 | 1,21 | ||||
| 2025-08-14 | 13F | Jane Street Group, Llc | 0 | −100,00 | 0 | |||||
| 2025-07-11 | 13F | Quad-Cities Investment Group, LLC | 13 104 | −2,48 | 1 068 | −1,39 | ||||
| 2025-07-17 | 13F | Jackson, Grant Investment Advisers, Inc. | 10 105 | 0,23 | 824 | 1,23 | ||||
| 2025-07-28 | 13F | Copia Wealth Management | 167 | 14 | ||||||
| 2025-08-13 | 13F | Dana Investment Advisors, Inc. | 3 675 | −34,66 | 300 | −34,00 | ||||
| 2025-08-11 | 13F | Private Advisor Group, LLC | 17 777 | −0,94 | 1 449 | 0,14 | ||||
| 2025-07-25 | 13F | Atria Wealth Solutions, Inc. | 28 440 | −34,07 | 2 378 | −31,69 | ||||
| 2025-08-14 | 13F | Benjamin Edwards Inc | 757 485 | 1 753,67 | 61 762 | 1 774,39 | ||||
| 2025-07-17 | 13F | Tempus Wealth Planning, LLC | 11 448 | −0,21 | 933 | 0,86 | ||||
| 2025-07-18 | 13F | Truist Financial Corp | 56 773 | −0,55 | 4 629 | 0,54 | ||||
| 2025-07-14 | 13F | Chapin Davis, Inc. | 2 491 | −4,52 | 203 | −3,33 | ||||
| 2025-08-05 | 13F | Bank of New York Mellon Corp | 4 639 | 378 | ||||||
| 2025-08-12 | 13F | CIBC Private Wealth Group, LLC | 446 | 36 | ||||||
| 2025-08-14 | 13F | Smartleaf Asset Management LLC | 1 027 | 84 | ||||||
| 2025-08-14 | 13F | Ausdal Financial Partners, Inc. | 0 | −100,00 | 0 | |||||
| 2025-07-08 | 13F | Atlas Brown,Inc. | 15 958 | 0,38 | 1 301 | 1,48 | ||||
| 2025-08-14 | 13F | Fmr Llc | 6 167 | −8,37 | 503 | −7,38 | ||||
| 2025-08-12 | 13F | LPL Financial LLC | 709 756 | 3,82 | 57 870 | 4,96 | ||||
| 2025-08-13 | 13F | Russell Investments Group, Ltd. | 789 | 4,23 | 64 | 4,92 | ||||
| 2025-08-14 | 13F | Core Wealth Advisors, Inc. | 12 176 | 13,83 | 993 | 15,08 | ||||
| 2025-08-14 | 13F | Headinvest, Llc | 5 992 | 0,00 | 489 | 1,04 | ||||
| 2025-07-28 | 13F | Rosenberg Matthew Hamilton | 1 071 | 13,94 | 87 | 16,00 | ||||
| 2025-08-14 | 13F | IHT Wealth Management, LLC | 3 285 | 0,12 | 268 | 1,14 | ||||
| 2025-08-06 | 13F | Commonwealth Equity Services, Llc | 259 076 | −10,63 | 21 | −8,70 | ||||
| 2025-08-12 | 13F | Jpmorgan Chase & Co | 5 737 | −4,18 | 468 | −3,11 | ||||
| 2025-07-11 | 13F | Pinnacle Bancorp, Inc. | 100 | 0,00 | 8 | 0,00 | ||||
| 2025-07-30 | 13F | Patten Group, Inc. | 5 106 | −5,81 | 416 | −4,81 | ||||
| 2025-08-08 | 13F | Flaharty Asset Management, LLC | 220 | 18 | ||||||
| 2025-08-12 | 13F | Mystic Asset Management, Inc. | 5 945 | −1,33 | 485 | −0,21 | ||||
| 2025-08-01 | 13F | Anson Capital, Inc. | 7 049 | 2,35 | 575 | 3,42 |