Grundläggande statistik
| Institutionella ägare | 213 total, 213 long only, 0 short only, 0 long/short - change of −2,29% MRQ |
| Genomsnittlig portföljallokering | 0.2554 % - change of −8,16% MRQ |
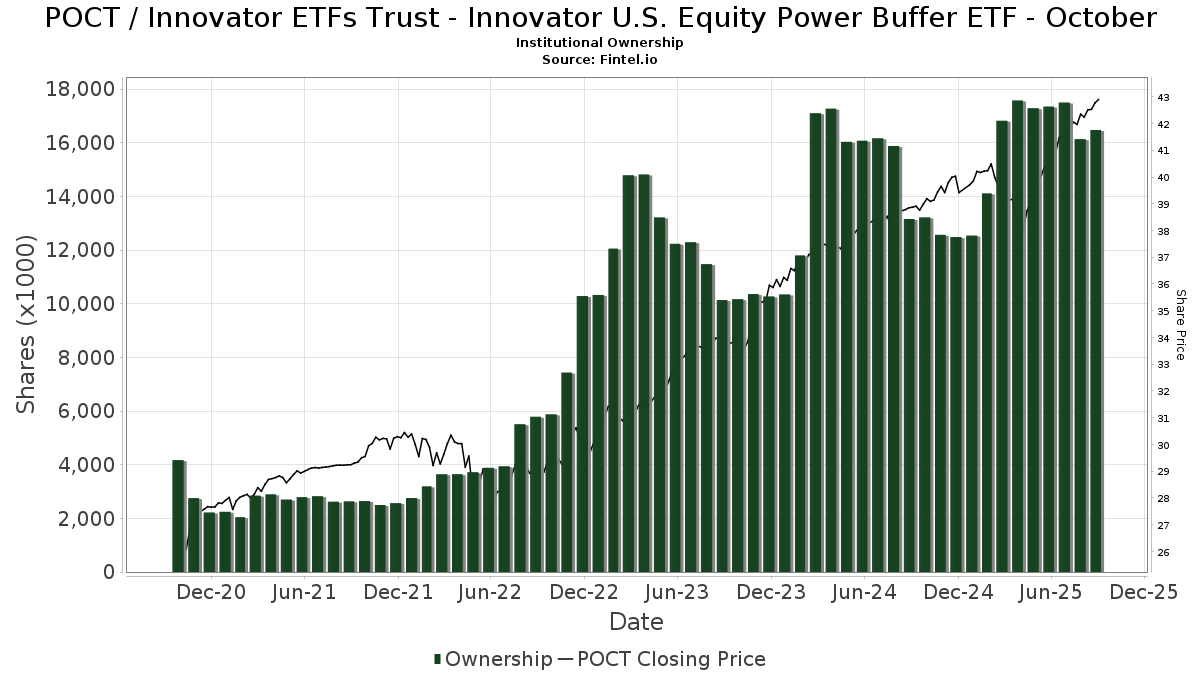
| Institutionella aktier (lång) | 16 478 557 (ex 13D/G) - change of −0,88MM shares −5,06% MRQ |
| Institutionellt värde (lång) | $ 562 721 USD ($1000) |
Institutionellt ägande och aktieägare
Innovator ETFs Trust - Innovator U.S. Equity Power Buffer ETF - October (US:POCT) har 213 Institutionella ägare och aktieägare som har lämnat in 13D/G- eller 13F-formulär till Securities Exchange Commission (SEC). Dessa institut innehar totalt 16,478,557 aktier. Största aktieägare inkluderar Alliancebernstein L.p., Penserra Capital Management LLC, Innovator ETFs Trust - Innovator Laddered Fund of U.S. Equity Power Buffer ETFs, Advisor Group Holdings, Inc., Raymond James Financial Inc, Envestnet Asset Management Inc, Commonwealth Equity Services, Llc, LPL Financial LLC, Stephens Inc /ar/, and Janney Montgomery Scott LLC .
Innovator ETFs Trust - Innovator U.S. Equity Power Buffer ETF - October (BATS:POCT) Institutionell ägarstruktur visar institutioners och fonders nuvarande positioner i företaget, samt de senaste förändringarna i positionernas storlek. Större aktieägare kan vara enskilda investerare, fonder, hedgefonder eller institutioner. Bilaga 13D visar att investeraren äger (eller ägde) mer än 5% av företaget och avser (eller avsåg) att aktivt eftersträva en förändring av affärsstrategin. Schedule 13G indikerar en passiv investering på över 5%.
The share price as of September 18, 2025 is 42,96 / share. Previously, on September 18, 2024, the share price was 38,87 / share. This represents an increase of 10,52% over that period.
Fondsentimentets poäng
Fondsentimentet poängen(fka Ägarackumulation-poäng) visar vilka aktier som är mest köpta av fonder. Det är resultatet av en sofistikerad kvantitativ flerfaktormodell som identifierar företag med de högsta nivåerna av institutionell ackumulering. Poängsättningsmodellen använder en kombination av den totala ökningen av redovisade ägare, förändringarna i portföljallokeringarna för dessa ägare och andra mått. Siffran sträcker sig från 0 till 100, där högre siffror indikerar en högre nivå av ackumulering i förhållande till sina konkurrenter, och 50 är genomsnittet.
Uppdateringsfrekvens: Dagligen
Se Ownership Explorer, som innehåller en lista över de högst rankade företagen.
Institutionell sälj/köp-kvot
Förutom att rapportera vanliga eget kapital- och skuldemissioner måste institutioner med mer än 100MM tillgångar under förvaltning också avslöja sina innehav av sälj- och köpoptioner. Eftersom säljoptioner i allmänhet indikerar ett negativt sentiment och köpoptioner indikerar ett positivt sentiment, kan vi få en uppfattning om det övergripande institutionella sentimentet genom att plotta förhållandet mellan säljoptioner och köpoptioner. Diagrammet till höger visar det historiska förhållandet mellan sälj- och köpoptioner för detta instrument.
Genom att använda sälj/köp-kvoten som en indikator på aktieägarnas sentiment undviker man en av de största bristerna med att använda det totala institutionella ägandet, nämligen att en betydande del av de förvaltade tillgångarna investeras passivt för att följa index. Passivt förvaltade fonder köper vanligtvis inte optioner, så indikatorn för sälj/köp-kvoten ger en bättre bild av stämningen i aktivt förvaltade fonder.
13D/G-Arkiveringar
Vi presenterar 13D/G-arkiveringar separat från 13F-arkiveringar på grund av att de behandlas olika av SEC. 13D/G-arkiveringar kan lämnas in av grupper av investerare (med en ledare), medan 13F-arkiveringar inte kan det. Detta leder till situationer där en investerare kan lämna in en 13D/G-ansökan med ett värde för de totala aktierna (vilket motsvarar alla aktier som ägs av investerargruppen), men sedan lämna in en 13F-ansökan med ett annat värde för de totala aktierna (vilket motsvarar enbart deras eget ägande). Detta innebär att aktieägandet i 13D/G-arkiveringar och 13F-arkiveringar ofta inte är direkt jämförbara, så vi presenterar dem separat.
Notera: Från och med den 16 maj 2021 visar vi inte längre ägare som inte har lämnat in en 13D/G under det senaste året. Tidigare visade vi hela historiken för 13D/G-arkiveringar. I allmänhet måste enheter som är skyldiga att lämna in 13D/G-arkiveringar lämna in minst en gång per år innan de lämnar in en stängningsarkivering. Fonder avslutar dock ibland positioner utan att lämna in en avslutande arkivering (dvs. de avvecklar), så att visa hela historiken resulterade ibland i förvirring om det nuvarande ägandet. För att förhindra förvirring visar vi nu endast "nuvarande" ägare - det vill säga ägare som har lämnat in en ansökan under det senaste året.
Upgrade to unlock premium data.
| Fil Datum | Formulär | Investerare | Föregående aktier |
Senaste aktier |
Δ Aktier (Procent) |
Ägande (Procent) |
Δ Ägande (Procent) |
|
|---|---|---|---|---|---|---|---|---|
| 2025-01-08 | Brookstone Capital Management | 952,733 | 4.24 |
13F- och NPORT-arkiveringar
Detaljer om 13F-arkiveringar är gratis. Detaljer om NP-arkiveringar kräver ett premiummedlemskap. Gröna rader indikerar nya positioner. Röda rader indikerar stängda positioner. Klicka på länk symbolen för att se hela transaktionshistoriken.
Uppgradera
för att låsa upp premiumdata och exportera till Excel ![]() .
.
| Fil Datum | Källa | Investerare | Typ | Genomsnittligt pris (beräknat) |
Aktier | Δ Aktier (%) |
Rapporterat värde (1000 USD) |
Δ Värde (%) |
Portföljallokering (%) |
|
|---|---|---|---|---|---|---|---|---|---|---|
| 2025-07-22 | 13F | Merit Financial Group, LLC | 11 089 | 458 | ||||||
| 2025-08-04 | 13F | Savvy Advisors, Inc. | 10 480 | 0,00 | 433 | 6,14 | ||||
| 2025-08-08 | 13F | Hartland & Co., LLC | 0 | −100,00 | 0 | |||||
| 2025-08-14 | 13F | Helium Advisors LLC | 15 044 | 0,00 | 621 | 6,34 | ||||
| 2025-07-22 | 13F | Siligmueller & Norvid Wealth Advisors LLC | 136 746 | 1,44 | 5 683 | 8,52 | ||||
| 2025-07-25 | 13F | Apollon Wealth Management, LLC | 5 000 | 206 | ||||||
| 2025-07-09 | 13F | HFG Wealth Management, LLC | 17 531 | −12,35 | 681 | −13,91 | ||||
| 2025-08-11 | 13F | Rothschild Investment Llc | 54 | 0,00 | 2 | 0,00 | ||||
| 2025-07-14 | 13F | AdvisorNet Financial, Inc | 17 305 | 11,90 | 715 | 19,00 | ||||
| 2025-07-23 | 13F | Valmark Advisers, Inc. | 26 329 | 0,00 | 1 087 | 6,36 | ||||
| 2025-08-11 | 13F | Summit Wealth Partners, LLC | 8 610 | 0,00 | 356 | 6,29 | ||||
| 2025-07-14 | 13F | CRA Financial Services, LLC | 36 590 | −0,25 | 1 511 | 6,04 | ||||
| 2025-07-22 | 13F | Berkshire Money Management, Inc. | 7 046 | 0,00 | 291 | 6,59 | ||||
| 2025-08-13 | 13F | BCJ Capital Management, LLC | 98 586 | −6,06 | 4 072 | −0,15 | ||||
| 2025-07-09 | 13F | Reyes Financial Architecture, Inc. | 2 618 | 64,14 | 108 | 77,05 | ||||
| 2025-07-09 | 13F | Central Valley Advisors, Llc | 12 476 | 0,00 | 515 | 6,40 | ||||
| 2025-08-12 | 13F | Coldstream Capital Management Inc | 22 196 | 0,00 | 917 | 6,26 | ||||
| 2025-04-08 | 13F | Lantz Financial LLC | 0 | −100,00 | 0 | |||||
| 2025-04-23 | 13F | Global Assets Advisory, LLC | 0 | −100,00 | 0 | |||||
| 2025-07-11 | 13F | SILVER OAK SECURITIES, Inc | 33 966 | 0,00 | 1 403 | 6,62 | ||||
| 2025-08-14 | 13F | Wells Fargo & Company/mn | 623 | 0,00 | 26 | 4,17 | ||||
| 2025-08-11 | 13F | Blue Bell Private Wealth Management, Llc | 88 886 | −0,40 | 3 671 | 5,86 | ||||
| 2025-08-14 | 13F | UBS Group AG | 0 | −100,00 | 0 | |||||
| 2025-08-14 | 13F | IHT Wealth Management, LLC | 9 719 | 0,00 | 401 | 6,37 | ||||
| 2025-08-14 | 13F | CoreCap Advisors, LLC | 233 843 | 100,42 | 9 658 | 113,08 | ||||
| 2025-08-08 | 13F | Collaborative Wealth Managment Inc. | 5 015 | 207 | ||||||
| 2025-08-12 | 13F | Change Path, LLC | 92 977 | −0,81 | 3 840 | 5,44 | ||||
| 2025-07-25 | 13F | Atria Wealth Solutions, Inc. | 27 820 | −51,01 | 1 150 | −47,87 | ||||
| 2025-07-21 | 13F | Ameriflex Group, Inc. | 129 | −85,86 | 5 | −85,71 | ||||
| 2025-08-14 | 13F/A | Skopos Labs, Inc. | 51 | 2 | ||||||
| 2025-07-29 | 13F | Stephens Inc /ar/ | 261 142 | −1,04 | 10 785 | 5,20 | ||||
| 2025-08-14 | 13F | Royal Bank Of Canada | 900 | 0,00 | 37 | 5,71 | ||||
| 2025-08-11 | 13F | Nations Financial Group Inc, /ia/ /adv | 19 095 | −0,02 | 789 | 6,34 | ||||
| 2025-08-12 | 13F | Jacobi Capital Management LLC | 35 675 | −49,18 | 1 473 | −45,98 | ||||
| 2025-08-11 | 13F | Brown Wealth Management, Llc | 0 | −100,00 | 0 | |||||
| 2025-08-15 | 13F | First Heartland Consultants, Inc. | 6 478 | −26,39 | 268 | −21,70 | ||||
| 2025-08-14 | 13F | Garden State Investment Advisory Services LLC | 6 930 | −23,47 | 286 | −18,52 | ||||
| 2025-08-08 | 13F | Avantax Advisory Services, Inc. | 21 269 | −6,44 | 878 | −0,57 | ||||
| 2025-08-04 | 13F | Creative Financial Designs Inc /adv | 500 | −7,06 | 21 | 0,00 | ||||
| 2025-08-12 | 13F | Ascent Wealth Partners, LLC | 11 065 | 0,00 | 457 | 6,29 | ||||
| 2025-08-04 | 13F | Arkadios Wealth Advisors | 0 | −100,00 | 0 | |||||
| 2025-08-06 | 13F | Valtinson Bruner Financial Planning LLC | 14 297 | 0,00 | 590 | 6,31 | ||||
| 2025-07-24 | 13F | Weaver Capital Management LLC | 9 546 | 0,00 | 394 | 6,49 | ||||
| 2025-07-09 | 13F | Keystone Wealth Services, LLC | 6 668 | −0,04 | 275 | 6,18 | ||||
| 2025-07-03 | 13F | City Center Advisors, LLC | 11 851 | −7,44 | 489 | −1,61 | ||||
| 2025-07-09 | 13F | Triumph Capital Management | 29 809 | 11,54 | 1 231 | 18,59 | ||||
| 2025-07-22 | 13F | Global Strategic Investment Solutions, LLC | 122 866 | −13,26 | 5 074 | −7,78 | ||||
| 2025-08-12 | 13F | Waterloo Capital, L.P. | 6 525 | −2,77 | 269 | 3,46 | ||||
| 2025-08-06 | 13F | Penserra Capital Management LLC | 1 420 155 | 16,13 | 59 | 23,40 | ||||
| 2025-06-24 | NP | Innovator ETFs Trust - Innovator Laddered Fund of U.S. Equity Power Buffer ETFs | 1 240 871 | 12,75 | 48 059 | 8,92 | ||||
| 2025-08-13 | 13F | Per Stirling Capital Management, LLC. | 13 004 | 1,98 | 537 | 8,48 | ||||
| 2025-08-14 | 13F | Ausdal Financial Partners, Inc. | 45 555 | −25,89 | 1 881 | −21,23 | ||||
| 2025-08-01 | 13F | Advisory Alpha, LLC | 94 157 | 1,58 | 3 889 | 7,97 | ||||
| 2025-08-08 | 13F | Pnc Financial Services Group, Inc. | 12 181 | 503 | ||||||
| 2025-08-12 | 13F | Proequities, Inc. | 0 | 0 | ||||||
| 2025-07-16 | 13F | Dakota Wealth Management | 16 488 | 0,00 | 681 | 6,25 | ||||
| 2025-08-14 | 13F | Arete Wealth Advisors, LLC | 12 936 | −3,72 | 1 | |||||
| 2025-08-13 | 13F | Navis Wealth Advisors, LLC | 11 047 | 0,00 | 456 | 6,29 | ||||
| 2025-07-21 | 13F | Keystone Financial Group, Inc. | 0 | −100,00 | 0 | |||||
| 2025-08-06 | 13F | Commonwealth Equity Services, Llc | 479 466 | 0,57 | 20 | 5,56 | ||||
| 2025-07-11 | 13F | Cypress Financial Planning Llc | 12 044 | 1,29 | 497 | 7,81 | ||||
| 2025-08-14 | 13F | Camden Capital, LLC | 8 530 | 0,00 | 352 | 6,34 | ||||
| 2025-08-14 | 13F | First Commonwealth Financial Corp /pa/ | 77 556 | −18,86 | 3 203 | −13,74 | ||||
| 2025-07-22 | 13F | MBL Wealth, LLC | 6 056 | 0,00 | 250 | 6,38 | ||||
| 2025-07-28 | 13F | RFG Advisory, LLC | 46 902 | −20,94 | 1 937 | −15,93 | ||||
| 2025-07-29 | 13F | Koshinski Asset Management, Inc. | 8 250 | −8,24 | 341 | −2,58 | ||||
| 2025-07-07 | 13F | Vishria Bird Financial Group, LLC | 11 031 | −1,72 | 456 | 4,36 | ||||
| 2025-08-11 | 13F | Outlook Wealth Advisors, LLC | 20 882 | 0,00 | 862 | 6,29 | ||||
| 2025-07-24 | 13F | Ronald Blue Trust, Inc. | 761 | 0,00 | 31 | 6,90 | ||||
| 2025-07-08 | 13F | Advance Capital Management, Inc. | 5 769 | 0,00 | 238 | 6,25 | ||||
| 2025-08-14 | 13F | Raymond James Financial Inc | 699 389 | −5,37 | 28 885 | 0,60 | ||||
| 2025-08-13 | 13F | Townsquare Capital Llc | 0 | −100,00 | 0 | |||||
| 2025-08-14 | 13F | Susquehanna International Group, Llp | 28 637 | −66,53 | 1 183 | −64,44 | ||||
| 2025-07-18 | 13F | Truist Financial Corp | 156 776 | 2,17 | 6 475 | 8,61 | ||||
| 2025-08-12 | 13F | Steward Partners Investment Advisory, Llc | 7 703 | 0,00 | 318 | 6,35 | ||||
| 2025-07-31 | 13F | Orion Capital Management LLC | 24 512 | −1,66 | 1 012 | 4,55 | ||||
| 2025-08-14 | 13F | Jane Street Group, Llc | 0 | −100,00 | 0 | |||||
| 2025-07-10 | 13F | Focus Financial Network, Inc. | 19 313 | 0,00 | 798 | 6,27 | ||||
| 2025-07-17 | 13F | City Holding Co | 16 692 | −9,14 | 689 | −3,37 | ||||
| 2025-07-24 | 13F | Stonebridge Financial Group, LLC | 0 | −100,00 | 0 | |||||
| 2025-08-19 | 13F | Cape Investment Advisory, Inc. | 35 600 | −17,09 | 1 470 | −11,87 | ||||
| 2025-08-14 | 13F | Mercer Global Advisors Inc /adv | 50 776 | −2,18 | 2 097 | 4,02 | ||||
| 2025-08-06 | 13F | Soltis Investment Advisors LLC | 236 401 | 9 763 | ||||||
| 2025-07-21 | 13F | DHJJ Financial Advisors, Ltd. | 745 | 0,00 | 31 | 7,14 | ||||
| 2025-08-29 | 13F | Centaurus Financial, Inc. | 40 777 | −3,56 | 2 | 0,00 | ||||
| 2025-08-12 | 13F | Bedel Financial Consulting, Inc. | 40 086 | 0,00 | 1 656 | 6,23 | ||||
| 2025-07-15 | 13F | Retirement Income Solutions, Inc | 39 920 | −3,36 | 1 649 | 2,74 | ||||
| 2025-05-01 | 13F | Quest 10 Wealth Builders, Inc. | 11 495 | −19,37 | 447 | −20,92 | ||||
| 2025-07-10 | 13F | Wealth Enhancement Advisory Services, Llc | 226 233 | −71,85 | 9 411 | −69,85 | ||||
| 2025-07-17 | 13F | Clay Northam Wealth Management, LLC | 14 065 | 0,00 | 581 | 6,23 | ||||
| 2025-08-04 | 13F | Assetmark, Inc | 105 | 0,00 | 4 | 0,00 | ||||
| 2025-07-28 | 13F | WealthPLAN Partners, LLC | 14 664 | 0,00 | 606 | 6,33 | ||||
| 2025-07-31 | 13F | Blue Sky Capital Consultants Group, Inc. | 5 994 | 248 | ||||||
| 2025-08-07 | 13F | Encompass More Asset Management | 48 350 | 19,60 | 1 997 | 27,13 | ||||
| 2025-08-01 | 13F | Envestnet Asset Management Inc | 509 494 | 24,36 | 21 042 | 32,21 | ||||
| 2025-04-22 | 13F | Synergy Financial Management, LLC | 0 | −100,00 | 0 | |||||
| 2025-07-23 | 13F | Defined Financial Planning LLC | 0 | −100,00 | 0 | |||||
| 2025-07-08 | 13F | Ptm Wealth Management, Llc | 19 712 | −0,41 | 820 | 14,05 | ||||
| 2025-08-04 | 13F | Pensionmark Financial Group, Llc | 5 523 | −7,30 | 228 | −1,30 | ||||
| 2025-07-28 | 13F | Cornerstone Wealth Group, LLC | 26 599 | −0,46 | 1 099 | 5,78 | ||||
| 2025-08-06 | 13F | Capasso Planning Partners LLC | 7 134 | −89,96 | 295 | −89,35 | ||||
| 2025-08-08 | 13F | Capital Investment Advisory Services, LLC | 704 | −0,56 | 29 | 7,41 | ||||
| 2025-07-31 | 13F | Pinnacle Wealth Management Group, Inc. | 11 040 | 0,00 | 456 | 6,31 | ||||
| 2025-07-07 | 13F | O'Connor Financial Group LLC | 35 955 | 0,13 | 1 496 | 7,25 | ||||
| 2025-07-31 | 13F | Cambridge Investment Research Advisors, Inc. | 81 653 | −10,13 | 3 | 0,00 | ||||
| 2025-08-14 | 13F | GWM Advisors LLC | 54 656 | −1,38 | 2 257 | 4,88 | ||||
| 2025-08-27 | 13F/A | Brinker Capital Investments, LLC | 175 393 | 53,54 | 7 244 | 63,24 | ||||
| 2025-08-07 | 13F | Sound View Wealth Advisors Group, LLC | 17 323 | 0,00 | 715 | 6,40 | ||||
| 2025-07-22 | 13F | Diligent Investors, LLC | 50 956 | −1,17 | 2 104 | 5,04 | ||||
| 2025-08-14 | 13F | Old Mission Capital Llc | 61 337 | 2 533 | ||||||
| 2025-07-16 | 13F | Leading Edge Financial Planning LLC | 0 | −100,00 | 0 | |||||
| 2025-08-12 | 13F | Jpmorgan Chase & Co | 0 | −100,00 | 0 | |||||
| 2025-08-13 | 13F | SageView Advisory Group, LLC | 136 818 | 75,33 | 5 752 | 89,77 | ||||
| 2025-08-25 | 13F | Silverlake Wealth Management Llc | 6 253 | 258 | ||||||
| 2025-08-14 | 13F | Citadel Advisors Llc | 16 410 | 118,16 | 678 | 131,85 | ||||
| 2025-08-13 | 13F | Virtue Capital Management, LLC | 0 | −100,00 | 0 | |||||
| 2025-07-28 | 13F | Elmwood Wealth Management, Inc. | 67 349 | −0,98 | 2 782 | 5,26 | ||||
| 2025-08-08 | 13F | Wealth Alliance | 72 904 | 0,00 | 3 011 | 6,29 | ||||
| 2025-08-11 | 13F | WPWealth LLP | 112 483 | 0,00 | 4 646 | 6,32 | ||||
| 2025-07-30 | 13F | Brookstone Capital Management | 212 505 | −78,17 | 8 776 | −76,80 | ||||
| 2025-05-14 | 13F | Caitlin John, LLC | 0 | −100,00 | 0 | |||||
| 2025-08-11 | 13F | Avantax Planning Partners, Inc. | 5 952 | 0,00 | 246 | 6,06 | ||||
| 2025-08-12 | 13F | LPL Financial LLC | 326 323 | 7,89 | 13 477 | 14,69 | ||||
| 2025-08-06 | 13F | Founders Financial Securities Llc | 43 088 | 31,04 | 1 780 | 39,97 | ||||
| 2025-07-28 | 13F | Mutual Advisors, LLC | 8 000 | −14,61 | 336 | −7,18 | ||||
| 2025-08-12 | 13F | SRS Capital Advisors, Inc. | 6 610 | −2,81 | 273 | 3,03 | ||||
| 2025-07-21 | 13F | Patriot Financial Group Insurance Agency, LLC | 32 427 | −0,72 | 1 339 | 5,60 | ||||
| 2025-04-15 | 13F | Noble Wealth Management PBC | 1 000 | 39 | ||||||
| 2025-07-15 | 13F | McAdam, LLC | 8 317 | 0,00 | 343 | 6,19 | ||||
| 2025-05-08 | 13F | Cardinal Point Capital Management, ULC | 0 | −100,00 | 0 | |||||
| 2025-07-23 | 13F | Motiv8 Investments LLC | 177 358 | −1,87 | 7 325 | 4,32 | ||||
| 2025-07-21 | 13F | Seros Financial, LLC | 6 132 | 0,00 | 253 | 6,30 | ||||
| 2025-08-15 | 13F | Kestra Advisory Services, LLC | 222 724 | 7,26 | 9 199 | 14,02 | ||||
| 2025-07-30 | 13F | Retirement Planning Group | 9 325 | 0,00 | 385 | 6,35 | ||||
| 2025-08-21 | 13F | Winnow Wealth Llc | 0 | 0 | ||||||
| 2025-08-01 | 13F | FSA Advisors, Inc. | 24 514 | 2,82 | 1 012 | 9,29 | ||||
| 2025-07-15 | 13F | Optima Capital Llc | 0 | −100,00 | 0 | |||||
| 2025-07-15 | 13F | Armis Advisers, LLC | 31 481 | 1,31 | 1 300 | 7,71 | ||||
| 2025-07-17 | 13F | XML Financial, LLC | 7 989 | 0,00 | 330 | 6,13 | ||||
| 2025-08-07 | 13F | Resources Investment Advisors, LLC. | 67 063 | 87,18 | 2 770 | 99,07 | ||||
| 2025-08-14 | 13F | Talon Private Wealth, LLC | 0 | −100,00 | 0 | |||||
| 2025-08-07 | 13F | Atala Financial Inc | 8 409 | 0,00 | 347 | 6,44 | ||||
| 2025-08-14 | 13F | Colony Group, LLC | 146 718 | −1,98 | 6 059 | 4,20 | ||||
| 2025-07-09 | 13F | Fragasso Group Inc. | 17 199 | −5,82 | 710 | 0,14 | ||||
| 2025-07-25 | 13F | Cwm, Llc | 206 666 | 28,01 | 9 | 33,33 | ||||
| 2025-08-01 | 13F | Integral Investment Advisors, Inc. | 5 285 | 0,00 | 218 | 6,34 | ||||
| 2025-08-01 | 13F | Corrado Advisors, Llc | 71 344 | −0,33 | 2 947 | 5,97 | ||||
| 2025-08-14 | 13F | Aqr Capital Management Llc | 0 | −100,00 | 0 | |||||
| 2025-08-15 | 13F | Sugar Maple Asset Management, LLC | 28 043 | −4,67 | 1 158 | 1,40 | ||||
| 2025-05-15 | 13F/A | Morgan Stanley | 0 | −100,00 | 0 | −100,00 | ||||
| 2025-07-17 | 13F | Wagner Wealth Management, Llc | 2 000 | 0,00 | 83 | 6,49 | ||||
| 2025-08-06 | 13F | AE Wealth Management LLC | 46 030 | −8,99 | 1 901 | −3,21 | ||||
| 2025-08-11 | 13F | Bellwether Advisors, LLC | 43 437 | 23,84 | 1 794 | 31,64 | ||||
| 2025-07-28 | 13F | Compass Advisory Group LLC | 14 567 | −1,69 | 602 | 4,52 | ||||
| 2025-08-12 | 13F | MAI Capital Management | 24 025 | −59,85 | 992 | −57,31 | ||||
| 2025-07-29 | 13F | International Assets Investment Management, Llc | 27 911 | 0,00 | 1 153 | 6,27 | ||||
| 2025-08-14 | 13F | Mml Investors Services, Llc | 148 102 | −2,55 | 6 | 20,00 | ||||
| 2025-07-16 | 13F | Maridea Wealth Management LLC | 47 386 | −11,16 | 1 957 | −5,55 | ||||
| 2025-08-05 | 13F | Sigma Planning Corp | 5 757 | 238 | ||||||
| 2025-07-11 | 13F | AA Financial Advisors, LLC | 202 001 | −0,54 | 8 343 | 5,73 | ||||
| 2025-08-01 | 13F | Ashton Thomas Private Wealth, LLC | 8 958 | 17,96 | 370 | 25,08 | ||||
| 2025-05-15 | 13F/A | Orion Portfolio Solutions, LLC | 114 232 | 35,97 | 4 438 | 33,48 | ||||
| 2025-08-12 | 13F | Long Island Wealth Management, Inc. | 12 025 | −5,94 | 497 | 0,00 | ||||
| 2025-08-05 | 13F | Tsfg, Llc | 0 | −100,00 | 0 | |||||
| 2025-08-11 | 13F | Brown Brothers Harriman & Co | 1 735 | 0,00 | 72 | 5,97 | ||||
| 2025-07-16 | 13F | Signaturefd, Llc | 27 949 | 0,00 | 1 154 | 6,36 | ||||
| 2025-07-10 | 13F | Three Seasons Wealth, LLC | 59 100 | 0,00 | 2 441 | 6,27 | ||||
| 2025-08-05 | 13F | WorthPointe, LLC | 40 917 | 0,00 | 1 690 | 6,29 | ||||
| 2025-03-24 | 13F | Fulcrum Equity Management | 0 | −100,00 | 0 | |||||
| 2025-07-14 | 13F | Kfg Wealth Management, Llc | 132 163 | −1,61 | 5 458 | 4,60 | ||||
| 2025-07-23 | 13F | Castle Rock Wealth Management, LLC | 27 371 | −3,32 | 1 144 | 3,91 | ||||
| 2025-07-10 | 13F | Atticus Wealth Management, Llc | 8 461 | 0,00 | 349 | 6,40 | ||||
| 2025-08-13 | 13F | Cresset Asset Management, LLC | 119 753 | −1,08 | 4 946 | 5,15 | ||||
| 2025-08-13 | 13F | Continuum Advisory, LLC | 11 713 | 59,17 | 484 | 69,47 | ||||
| 2025-04-28 | 13F | Castle Wealth Management Llc | 0 | −100,00 | 0 | |||||
| 2025-08-04 | 13F | Integrity Alliance, Llc. | 5 950 | 4,24 | 246 | 10,86 | ||||
| 2025-07-28 | 13F | Harbour Investments, Inc. | 21 094 | −22,17 | 871 | −17,21 | ||||
| 2025-07-29 | 13F | Goldstein Advisors, LLC | 8 398 | 0,00 | 347 | 6,13 | ||||
| 2025-08-14 | 13F | Kovitz Investment Group Partners, LLC | 193 254 | −3,30 | 7 981 | 2,79 | ||||
| 2025-07-25 | 13F | Sequoia Financial Advisors, LLC | 6 310 | −21,94 | 261 | −17,20 | ||||
| 2025-08-13 | 13F | Beacon Pointe Advisors, LLC | 168 719 | −9,56 | 6 968 | −3,85 | ||||
| 2025-08-14 | 13F/A | Barclays Plc | 3 381 | −34,51 | 0 | |||||
| 2025-08-14 | 13F | Financial Network Wealth Advisors LLC | 6 050 | 62,24 | 250 | 72,92 | ||||
| 2025-08-14 | 13F | Sunbelt Securities, Inc. | 3 979 | 2 122,91 | 157 | 2 516,67 | ||||
| 2025-08-14 | 13F | Alliancebernstein L.p. | 1 793 481 | −2,18 | 74 071 | 3,99 | ||||
| 2025-08-08 | 13F | Kingsview Wealth Management, LLC | 6 811 | −0,29 | 281 | 6,04 | ||||
| 2025-07-30 | 13F | Red Crane Wealth Management, Llc | 58 745 | −3,11 | 2 426 | 3,01 | ||||
| 2025-08-11 | 13F | HighTower Advisors, LLC | 228 616 | −1,56 | 9 442 | 4,64 | ||||
| 2025-08-19 | 13F | Advisory Services Network, LLC | 99 871 | −0,65 | 4 186 | 7,17 | ||||
| 2025-07-14 | 13F | Chris Bulman Inc | 44 638 | −13,33 | 1 844 | −7,85 | ||||
| 2025-05-12 | 13F | Fmr Llc | 0 | −100,00 | 0 | |||||
| 2025-07-17 | 13F | Janney Montgomery Scott LLC | 243 947 | 7,70 | 10 | 25,00 | ||||
| 2025-07-21 | 13F | Triad Wealth Partners, LLC | 55 967 | 90,48 | 2 311 | 102,54 | ||||
| 2025-08-13 | 13F | Capital Analysts, Inc. | 18 195 | 0,00 | 1 | |||||
| 2025-08-13 | 13F | Cerity Partners LLC | 42 599 | 0,90 | 1 759 | 7,26 | ||||
| 2025-08-14 | 13F | Mariner, LLC | 7 398 | 0,00 | 306 | 6,27 | ||||
| 2025-07-15 | 13F | BCS Wealth Management | 42 140 | −12,64 | 2 | 0,00 | ||||
| 2025-08-07 | 13F | Runnymede Capital Advisors, Inc. | 0 | −100,00 | 0 | |||||
| 2025-08-08 | 13F | Gts Securities Llc | 0 | −100,00 | 0 | |||||
| 2025-07-29 | 13F | Straight Path Wealth Management | 5 218 | 216 | ||||||
| 2025-08-12 | 13F | Wood Tarver Financial Group, LLC | 18 582 | 20,86 | 1 | −100,00 | ||||
| 2025-04-30 | 13F | Stratos Wealth Advisors, LLC | 0 | −100,00 | 0 | −100,00 | ||||
| 2025-07-16 | 13F | Crown Wealth Group, LLC | 6 045 | 250 | ||||||
| 2025-07-24 | 13F | IFP Advisors, Inc | 52 252 | −2,04 | 2 158 | 4,15 | ||||
| 2025-07-24 | 13F | Bernard Wealth Management Corp. | 3 594 | 0,00 | 148 | 6,47 | ||||
| 2025-08-08 | 13F | Cetera Investment Advisers | 163 454 | 1,29 | 6 751 | 7,67 | ||||
| 2025-07-10 | 13F | ARS Wealth Advisors Group, LLC | 19 968 | −5,57 | 825 | 0,37 | ||||
| 2025-08-04 | 13F | Spire Wealth Management | 107 | 0,00 | 4 | 0,00 | ||||
| 2025-08-13 | 13F | EverSource Wealth Advisors, LLC | 2 592 | 0,00 | 107 | 7,00 | ||||
| 2025-08-13 | 13F | Nicolet Bankshares Inc | 0 | −100,00 | 0 | |||||
| 2025-05-14 | 13F | ZEGA Investments, LLC | 0 | −100,00 | 0 | |||||
| 2025-08-14 | 13F | Frisch Financial Group, Inc. | 36 497 | 0,00 | 2 | 0,00 | ||||
| 2025-07-25 | 13F | Mitchell Capital Management Co | 5 652 | −26,60 | 236 | −21,40 | ||||
| 2025-07-29 | 13F | BKD Wealth Advisors, LLC | 227 778 | −5,24 | 9 407 | 0,74 | ||||
| 2025-07-31 | 13F | Gill Capital Partners, Llc | 26 044 | −0,78 | 1 076 | 5,50 | ||||
| 2025-07-22 | 13F | Beacon Financial Advisory LLC | 33 345 | −1,77 | 1 377 | 4,48 | ||||
| 2025-07-22 | 13F | Macroview Investment Management Llc | 0 | −100,00 | 0 | |||||
| 2025-07-14 | 13F | U.S. Capital Wealth Advisors, LLC | 27 618 | −6,68 | 1 141 | −0,78 | ||||
| 2025-08-05 | 13F | BCGM Wealth Management, LLC | 12 425 | 0,00 | 513 | 6,43 | ||||
| 2025-08-08 | 13F | Emerald Investment Partners, Llc | 3 912 | 0,00 | 162 | 6,62 | ||||
| 2025-07-21 | 13F | Ameritas Advisory Services, LLC | 1 360 | −77,95 | 56 | −76,95 | ||||
| 2025-08-11 | 13F | Principal Securities, Inc. | 124 690 | −2,14 | 5 150 | 2,14 | ||||
| 2025-07-14 | 13F | Southland Equity Partners LLC | 92 225 | 1,04 | 3 809 | 7,39 | ||||
| 2025-05-16 | 13F | Signature Estate & Investment Advisors Llc | 0 | −100,00 | 0 | |||||
| 2025-08-08 | 13F | Thoroughbred Financial Services, Llc | 11 471 | −11,56 | 0 | |||||
| 2025-08-01 | 13F | Stuart Chaussee & Associates, Inc. | 610 | −99,37 | 25 | −99,33 | ||||
| 2025-08-15 | 13F | Nikulski Financial, Inc. | 12 335 | −0,20 | 509 | 6,04 | ||||
| 2025-08-15 | 13F | Captrust Financial Advisors | 201 180 | 0,13 | 8 309 | 6,44 | ||||
| 2025-08-13 | 13F | Luminist Capital LLC | 4 850 | 200 | ||||||
| 2025-07-24 | 13F | Vantage Point Financial LLC | 11 413 | 37,18 | 471 | 45,82 | ||||
| 2025-08-14 | 13F | Certified Advisory Corp | 117 996 | −3,41 | 4 873 | 2,68 | ||||
| 2025-07-24 | 13F | Blair William & Co/il | 36 098 | −71,19 | 1 491 | −69,39 | ||||
| 2025-08-11 | 13F | Anfield Capital Management, LLC | 318 | 13 | ||||||
| 2025-08-08 | 13F | Advyzon Investment Management, LLC | 75 655 | 3 125 | ||||||
| 2025-08-12 | 13F | Weaver Consulting Group | 17 266 | 0,00 | 713 | 6,42 | ||||
| 2025-07-28 | 13F | Axxcess Wealth Management, Llc | 6 718 | 0,00 | 277 | 6,54 | ||||
| 2025-07-11 | 13F | Farther Finance Advisors, LLC | 81 530 | 65,80 | 3 367 | 75,73 | ||||
| 2025-08-12 | 13F | Tradition Wealth Management, LLC | 54 181 | −4,24 | 2 238 | 1,77 | ||||
| 2025-08-12 | 13F | O'shaughnessy Asset Management, Llc | 357 | 0,00 | 15 | 7,69 | ||||
| 2025-08-14 | 13F | Betterment LLC | 6 507 | −2,98 | 0 | |||||
| 2025-08-01 | 13F | Gwn Securities Inc. | 9 650 | −2,99 | 399 | 3,11 | ||||
| 2025-08-14 | 13F | Benjamin Edwards Inc | 29 248 | 1 208 | ||||||
| 2025-08-06 | 13F | Bullseye Investment Management, LLC | 78 638 | 0,00 | 3 055 | 0,00 | ||||
| 2025-07-11 | 13F | Compass Ion Advisors, LLC | 6 545 | 0,00 | 270 | 6,30 | ||||
| 2025-07-30 | 13F | Strategic Blueprint, LLC | 24 808 | 2,94 | 1 025 | 9,40 | ||||
| 2025-08-12 | 13F | American Asset Management Inc. | 6 960 | 0,00 | 287 | 6,30 | ||||
| 2025-09-04 | 13F/A | Advisor Group Holdings, Inc. | 744 342 | −1,09 | 30 741 | 5,15 |