Grundläggande statistik
| Institutionella ägare | 190 total, 190 long only, 0 short only, 0 long/short - change of 0,00% MRQ |
| Genomsnittlig portföljallokering | 0.2355 % - change of −2,28% MRQ |
| Institutionella aktier (lång) | 13 221 596 (ex 13D/G) - change of 1,13MM shares 9,39% MRQ |
| Institutionellt värde (lång) | $ 467 695 USD ($1000) |
Institutionellt ägande och aktieägare
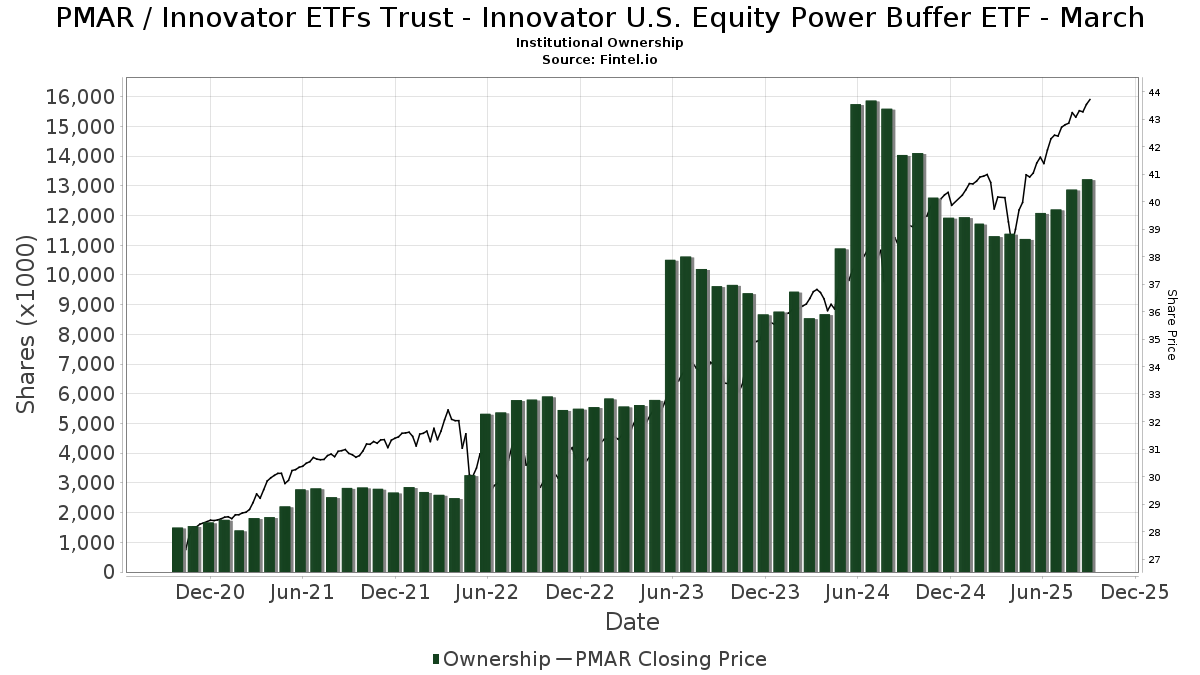
Innovator ETFs Trust - Innovator U.S. Equity Power Buffer ETF - March (US:PMAR) har 190 Institutionella ägare och aktieägare som har lämnat in 13D/G- eller 13F-formulär till Securities Exchange Commission (SEC). Dessa institut innehar totalt 13,221,596 aktier. Största aktieägare inkluderar Alliancebernstein L.p., Penserra Capital Management LLC, Innovator ETFs Trust - Innovator Laddered Fund of U.S. Equity Power Buffer ETFs, Brookstone Capital Management, Southland Equity Partners LLC, Advisor Group Holdings, Inc., Commonwealth Equity Services, Llc, Colony Group, LLC, Kovitz Investment Group Partners, LLC, and Raymond James Financial Inc .
Innovator ETFs Trust - Innovator U.S. Equity Power Buffer ETF - March (BATS:PMAR) Institutionell ägarstruktur visar institutioners och fonders nuvarande positioner i företaget, samt de senaste förändringarna i positionernas storlek. Större aktieägare kan vara enskilda investerare, fonder, hedgefonder eller institutioner. Bilaga 13D visar att investeraren äger (eller ägde) mer än 5% av företaget och avser (eller avsåg) att aktivt eftersträva en förändring av affärsstrategin. Schedule 13G indikerar en passiv investering på över 5%.
The share price as of September 10, 2025 is 43,54 / share. Previously, on September 11, 2024, the share price was 38,58 / share. This represents an increase of 12,85% over that period.
Fondsentimentets poäng
Fondsentimentet poängen(fka Ägarackumulation-poäng) visar vilka aktier som är mest köpta av fonder. Det är resultatet av en sofistikerad kvantitativ flerfaktormodell som identifierar företag med de högsta nivåerna av institutionell ackumulering. Poängsättningsmodellen använder en kombination av den totala ökningen av redovisade ägare, förändringarna i portföljallokeringarna för dessa ägare och andra mått. Siffran sträcker sig från 0 till 100, där högre siffror indikerar en högre nivå av ackumulering i förhållande till sina konkurrenter, och 50 är genomsnittet.
Uppdateringsfrekvens: Dagligen
Se Ownership Explorer, som innehåller en lista över de högst rankade företagen.
Institutionell sälj/köp-kvot
Förutom att rapportera vanliga eget kapital- och skuldemissioner måste institutioner med mer än 100MM tillgångar under förvaltning också avslöja sina innehav av sälj- och köpoptioner. Eftersom säljoptioner i allmänhet indikerar ett negativt sentiment och köpoptioner indikerar ett positivt sentiment, kan vi få en uppfattning om det övergripande institutionella sentimentet genom att plotta förhållandet mellan säljoptioner och köpoptioner. Diagrammet till höger visar det historiska förhållandet mellan sälj- och köpoptioner för detta instrument.
Genom att använda sälj/köp-kvoten som en indikator på aktieägarnas sentiment undviker man en av de största bristerna med att använda det totala institutionella ägandet, nämligen att en betydande del av de förvaltade tillgångarna investeras passivt för att följa index. Passivt förvaltade fonder köper vanligtvis inte optioner, så indikatorn för sälj/köp-kvoten ger en bättre bild av stämningen i aktivt förvaltade fonder.
13F- och NPORT-arkiveringar
Detaljer om 13F-arkiveringar är gratis. Detaljer om NP-arkiveringar kräver ett premiummedlemskap. Gröna rader indikerar nya positioner. Röda rader indikerar stängda positioner. Klicka på länk symbolen för att se hela transaktionshistoriken.
Uppgradera
för att låsa upp premiumdata och exportera till Excel ![]() .
.
| Fil Datum | Källa | Investerare | Typ | Genomsnittligt pris (beräknat) |
Aktier | Δ Aktier (%) |
Rapporterat värde (1000 USD) |
Δ Värde (%) |
Portföljallokering (%) |
|
|---|---|---|---|---|---|---|---|---|---|---|
| 2025-07-22 | 13F | Siligmueller & Norvid Wealth Advisors LLC | 6 443 | 0,00 | 273 | 6,23 | ||||
| 2025-07-09 | 13F | HFG Wealth Management, LLC | 28 035 | −2,25 | 1 120 | −2,86 | ||||
| 2025-08-06 | 13F | Penserra Capital Management LLC | 1 385 567 | 14,03 | 59 | 20,83 | ||||
| 2025-07-22 | 13F | Merit Financial Group, LLC | 11 465 | 484 | ||||||
| 2025-07-23 | 13F | Valmark Advisers, Inc. | 54 498 | 0,00 | 2 301 | 5,74 | ||||
| 2025-07-30 | 13F | Strategic Blueprint, LLC | 14 135 | 47,36 | 597 | 55,61 | ||||
| 2025-08-11 | 13F | Summit Wealth Partners, LLC | 7 962 | 0,00 | 336 | 5,99 | ||||
| 2025-05-08 | 13F | Certified Advisory Corp | 0 | −100,00 | 0 | |||||
| 2025-08-13 | 13F | BCJ Capital Management, LLC | 44 465 | −0,15 | 1 878 | 5,57 | ||||
| 2025-07-11 | 13F | SILVER OAK SECURITIES, Inc | 17 673 | 86,21 | 746 | 97,35 | ||||
| 2025-07-10 | 13F | Oliver Lagore Vanvalin Investment Group | 0 | −100,00 | 0 | |||||
| 2025-07-31 | 13F | Gill Capital Partners, Llc | 63 632 | 13,31 | 2 687 | 19,85 | ||||
| 2025-08-05 | 13F | Smith Shellnut Wilson Llc /adv | 10 000 | 0,00 | 422 | 5,76 | ||||
| 2025-08-11 | 13F | Blue Bell Private Wealth Management, Llc | 40 147 | −2,54 | 1 695 | 3,10 | ||||
| 2025-08-13 | 13F | Townsquare Capital Llc | 0 | −100,00 | 0 | |||||
| 2025-08-18 | 13F | Hollencrest Capital Management | 0 | −100,00 | 0 | |||||
| 2025-04-08 | 13F | Parallel Advisors, LLC | 0 | −100,00 | 0 | |||||
| 2025-08-14 | 13F | CoreCap Advisors, LLC | 129 298 | 3,44 | 5 460 | 9,38 | ||||
| 2025-08-11 | 13F | Annis Gardner Whiting Capital Advisors, LLC | 500 | 21 | ||||||
| 2025-07-25 | 13F | Atria Wealth Solutions, Inc. | 35 971 | 10,40 | 1 520 | 16,76 | ||||
| 2025-08-08 | 13F | Avantax Advisory Services, Inc. | 16 632 | 0,00 | 702 | 5,72 | ||||
| 2025-04-25 | 13F | Crown Wealth Group, LLC | 0 | −100,00 | 0 | |||||
| 2025-08-12 | 13F | Steward Partners Investment Advisory, Llc | 47 933 | 0,52 | 2 024 | 6,30 | ||||
| 2025-07-10 | 13F | Marshall Financial Group LLC | 5 367 | 0,00 | 227 | 6,07 | ||||
| 2025-07-30 | 13F | Schnieders Capital Management Llc | 11 600 | 0,00 | 490 | 5,62 | ||||
| 2025-08-11 | 13F | Nations Financial Group Inc, /ia/ /adv | 5 338 | 4,77 | 225 | 10,84 | ||||
| 2025-08-12 | 13F | Ascent Wealth Partners, LLC | 28 048 | 7,14 | 1 184 | 13,30 | ||||
| 2025-07-15 | 13F | First City Capital Management, Inc. | 6 750 | 0,00 | 285 | 5,95 | ||||
| 2025-08-15 | 13F | Morgan Stanley | 4 644 | −34,23 | 196 | −30,25 | ||||
| 2025-08-12 | 13F | Jacobi Capital Management LLC | 10 745 | 0,00 | 454 | 5,59 | ||||
| 2025-08-14 | 13F | Royal Bank Of Canada | 0 | −100,00 | 0 | |||||
| 2025-07-30 | 13F | LifeWealth Investments, LLC | 25 205 | 0,00 | 1 064 | 5,77 | ||||
| 2025-04-18 | 13F | Global Trust Asset Management, LLC | 0 | −100,00 | 0 | |||||
| 2025-08-12 | 13F | Proequities, Inc. | 0 | 0 | ||||||
| 2025-08-14 | 13F | Main Street Financial Solutions, LLC | 37 681 | 0,00 | 1 591 | 5,78 | ||||
| 2025-07-28 | 13F | Cypress Wealth Services, LLC | 46 429 | 0,00 | 1 961 | 5,72 | ||||
| 2025-08-05 | 13F | C2P Capital Advisory Group, LLC d.b.a. Prosperity Capital Advisors | 11 065 | 0,00 | 467 | 5,66 | ||||
| 2025-07-09 | 13F | Keystone Wealth Services, LLC | 46 000 | 0,00 | 1 943 | 5,72 | ||||
| 2025-08-06 | 13F | AE Wealth Management LLC | 30 907 | −6,88 | 1 305 | −1,51 | ||||
| 2025-07-24 | 13F | Weaver Capital Management LLC | 35 080 | 0,00 | 1 481 | 5,79 | ||||
| 2025-07-16 | 13F | Perigon Wealth Management, LLC | 5 204 | 0,00 | 220 | 5,80 | ||||
| 2025-07-22 | 13F | Global Strategic Investment Solutions, LLC | 6 967 | 0,00 | 294 | 5,76 | ||||
| 2025-09-04 | 13F | Beacon Capital Management, Inc. | 556 | 23 | ||||||
| 2025-08-14 | 13F | Jane Street Group, Llc | 10 926 | −64,64 | 461 | −62,61 | ||||
| 2025-08-13 | 13F | VestGen Advisors, LLC | 38 432 | 648,87 | 1 684 | 725,00 | ||||
| 2025-08-14 | 13F | Ausdal Financial Partners, Inc. | 9 574 | −0,30 | 404 | 5,48 | ||||
| 2025-08-01 | 13F | Advisory Alpha, LLC | 17 782 | 0,00 | 751 | 5,63 | ||||
| 2025-06-24 | NP | Innovator ETFs Trust - Innovator Laddered Fund of U.S. Equity Power Buffer ETFs | 1 210 653 | 10,70 | 48 063 | 7,88 | ||||
| 2025-08-12 | 13F | Leigh Baldwin & Co., Llc | 5 300 | −15,87 | 224 | −11,16 | ||||
| 2025-07-22 | 13F | MBL Wealth, LLC | 64 095 | −3,75 | 2 707 | 1,77 | ||||
| 2025-07-18 | 13F | Truist Financial Corp | 126 825 | −2,96 | 5 356 | 2,61 | ||||
| 2025-07-11 | 13F | Cypress Financial Planning Llc | 5 361 | −26,01 | 226 | −21,80 | ||||
| 2025-07-21 | 13F | DHJJ Financial Advisors, Ltd. | 10 783 | 0,00 | 455 | 5,81 | ||||
| 2025-08-04 | 13F | Spire Wealth Management | 51 966 | −4,61 | 2 195 | 0,87 | ||||
| 2025-08-14 | 13F | Talon Private Wealth, LLC | 45 654 | 1 928 | ||||||
| 2025-08-08 | 13F | Hartland & Co., LLC | 0 | −100,00 | 0 | |||||
| 2025-07-15 | 13F | Optima Capital Llc | 19 118 | 807 | ||||||
| 2025-07-07 | 13F | Vishria Bird Financial Group, LLC | 17 086 | −2,37 | 722 | 3,30 | ||||
| 2025-07-31 | 13F | Orion Capital Management LLC | 15 665 | 0,00 | 662 | 5,76 | ||||
| 2025-08-14 | 13F | Susquehanna International Group, Llp | 70 554 | 294,00 | 2 979 | 316,64 | ||||
| 2025-08-06 | 13F | Commonwealth Equity Services, Llc | 380 834 | 2,94 | 16 | 14,29 | ||||
| 2025-08-14 | 13F | Raymond James Financial Inc | 288 179 | 2,01 | 12 170 | 7,87 | ||||
| 2025-07-29 | 13F | Koshinski Asset Management, Inc. | 5 250 | −7,49 | 222 | −2,21 | ||||
| 2025-08-14 | 13F | Citadel Advisors Llc | 0 | −100,00 | 0 | |||||
| 2025-08-07 | 13F | Fidelis Capital Partners, LLC | 12 200 | 0,00 | 523 | 8,30 | ||||
| 2025-08-05 | 13F | Integrity Financial Corp /WA | 1 572 | 0,00 | 66 | 6,45 | ||||
| 2025-07-17 | 13F | City Holding Co | 59 382 | −0,53 | 2 507 | 5,20 | ||||
| 2025-07-10 | 13F | Wealth Enhancement Advisory Services, Llc | 59 388 | −8,56 | 2 520 | −2,82 | ||||
| 2025-05-01 | 13F | Quest 10 Wealth Builders, Inc. | 12 928 | 12,65 | 524 | 13,45 | ||||
| 2025-07-17 | 13F | Wolff Wiese Magana Llc | 51 | 0,00 | 2 | 0,00 | ||||
| 2025-07-25 | 13F | Yarger Wealth Strategies, Llc | 60 250 | −10,86 | 2 544 | −5,74 | ||||
| 2025-08-08 | 13F | Gts Securities Llc | 6 133 | 0,00 | 259 | 5,74 | ||||
| 2025-08-12 | 13F | Bedel Financial Consulting, Inc. | 9 074 | 0,00 | 383 | 6,09 | ||||
| 2025-08-19 | 13F | National Asset Management, Inc. | 0 | −100,00 | 0 | |||||
| 2025-07-28 | 13F | RFG Advisory, LLC | 18 485 | −37,48 | 781 | −33,90 | ||||
| 2025-08-14 | 13F | Wells Fargo & Company/mn | 0 | −100,00 | 0 | |||||
| 2025-07-10 | 13F | Focus Financial Network, Inc. | 7 685 | −13,51 | 325 | −8,47 | ||||
| 2025-07-24 | 13F | Stonebridge Financial Group, LLC | 0 | −100,00 | 0 | |||||
| 2025-08-13 | 13F | JT Stratford LLC | 7 520 | 0,00 | 318 | 5,67 | ||||
| 2025-08-19 | 13F | Cape Investment Advisory, Inc. | 7 560 | −1,31 | 319 | 4,59 | ||||
| 2025-07-31 | 13F | Pinnacle Wealth Management Group, Inc. | 37 910 | −0,79 | 1 601 | 4,92 | ||||
| 2025-08-12 | 13F | SRS Capital Advisors, Inc. | 7 647 | −0,29 | 323 | 5,23 | ||||
| 2025-08-05 | 13F | Jessup Wealth Management, Inc | 18 515 | −10,24 | 782 | −5,10 | ||||
| 2025-07-17 | 13F | Clay Northam Wealth Management, LLC | 6 170 | 0,00 | 261 | 5,69 | ||||
| 2025-08-06 | 13F | ORBA Wealth Advisors, L.L.C. | 19 643 | −4,38 | 830 | 1,10 | ||||
| 2025-08-01 | 13F | Envestnet Asset Management Inc | 110 148 | 2,26 | 4 652 | 8,14 | ||||
| 2025-07-31 | 13F | Blue Sky Capital Consultants Group, Inc. | 12 313 | 520 | ||||||
| 2025-08-04 | 13F | Assetmark, Inc | 290 | 308,45 | 12 | 500,00 | ||||
| 2025-08-01 | 13F | FSA Advisors, Inc. | 22 317 | 0,19 | 942 | 5,96 | ||||
| 2025-08-14 | 13F | GWM Advisors LLC | 55 393 | 0,22 | 2 339 | 5,98 | ||||
| 2025-05-15 | 13F | Hrt Financial Lp | 0 | −100,00 | 0 | |||||
| 2025-07-29 | 13F | AssuredPartners Investment Advisors, LLC | 0 | −100,00 | 0 | |||||
| 2025-07-28 | 13F | Cornerstone Wealth Group, LLC | 30 056 | 0,00 | 1 269 | 5,75 | ||||
| 2025-07-08 | 13F | Ptm Wealth Management, Llc | 8 055 | −19,99 | 342 | −8,82 | ||||
| 2025-08-04 | 13F | Pensionmark Financial Group, Llc | 6 700 | 31,37 | 283 | 38,92 | ||||
| 2025-07-22 | 13F | Macroview Investment Management Llc | 30 285 | 0,00 | 1 279 | 5,71 | ||||
| 2025-05-13 | 13F | UBS Group AG | 0 | −100,00 | 0 | |||||
| 2025-05-07 | 13F | Keystone Financial Group, Inc. | 0 | −100,00 | 0 | |||||
| 2025-07-25 | 13F | Cwm, Llc | 6 223 | 0,00 | 0 | |||||
| 2025-08-08 | 13F | Foundations Investment Advisors, LLC | 38 180 | 6,69 | 1 612 | 12,81 | ||||
| 2025-08-27 | 13F/A | Brinker Capital Investments, LLC | 19 550 | 248,80 | 826 | 269,96 | ||||
| 2025-07-22 | 13F | Diligent Investors, LLC | 89 536 | 0,56 | 3 781 | 6,36 | ||||
| 2025-05-09 | 13F | Pnc Financial Services Group, Inc. | 0 | −100,00 | 0 | |||||
| 2025-08-11 | 13F | Brown Wealth Management, Llc | 28 157 | −22,06 | 1 189 | −17,55 | ||||
| 2025-07-21 | 13F | Patriot Financial Group Insurance Agency, LLC | 33 301 | 7,07 | 1 406 | 13,20 | ||||
| 2025-07-16 | 13F | PFS Partners, LLC | 1 329 | 210,51 | 56 | 229,41 | ||||
| 2025-08-14 | 13F | Old Mission Capital Llc | 63 762 | 2 693 | ||||||
| 2025-07-22 | 13F | Belpointe Asset Management LLC | 13 971 | −0,04 | 590 | 5,56 | ||||
| 2025-07-28 | 13F | Sagespring Wealth Partners, Llc | 15 881 | 68,20 | 671 | 77,72 | ||||
| 2025-08-13 | 13F | SageView Advisory Group, LLC | 24 201 | 0,00 | 1 039 | 7,45 | ||||
| 2025-08-07 | 13F | Lakeridge Wealth Management LLC | 34 651 | 3,59 | 1 463 | 9,59 | ||||
| 2025-08-08 | 13F | Capital Investment Advisory Services, LLC | 655 | 1 210,00 | 28 | 2 600,00 | ||||
| 2025-07-09 | 13F | Lineweaver Wealth Advisors, LLC | 21 131 | 0,00 | 892 | 5,81 | ||||
| 2025-07-29 | 13F | Stratos Wealth Advisors, LLC | 17 720 | 4,27 | 748 | 10,32 | ||||
| 2025-07-31 | 13F | Cambridge Investment Research Advisors, Inc. | 107 754 | 0,53 | 5 | 0,00 | ||||
| 2025-08-14 | 13F | First Commonwealth Financial Corp /pa/ | 45 053 | −0,33 | 1 903 | 5,37 | ||||
| 2025-08-13 | 13F | Cresset Asset Management, LLC | 82 011 | 0,00 | 3 463 | 5,74 | ||||
| 2025-07-15 | 13F | Vestment Financial LLC | 13 893 | 0,00 | 587 | 5,58 | ||||
| 2025-07-25 | 13F | Hazlett, Burt & Watson, Inc. | 800 | 0,00 | 0 | |||||
| 2025-07-14 | 13F | Buska Wealth Management, LLC | 8 484 | −11,65 | 358 | −6,53 | ||||
| 2025-08-12 | 13F | LPL Financial LLC | 171 387 | 7,20 | 7 238 | 13,36 | ||||
| 2025-08-08 | 13F | Wealth Alliance | 83 745 | −0,18 | 3 537 | 5,55 | ||||
| 2025-08-15 | 13F | Kestra Advisory Services, LLC | 207 744 | 11,48 | 8 773 | 17,90 | ||||
| 2025-07-30 | 13F | Brookstone Capital Management | 846 204 | 360,08 | 35 735 | 386,59 | ||||
| 2025-07-28 | 13F | Harbour Investments, Inc. | 12 833 | 7,31 | 542 | 13,42 | ||||
| 2025-07-30 | 13F | Retirement Planning Group | 19 905 | 0,00 | 841 | 5,79 | ||||
| 2025-07-14 | 13F | AdvisorNet Financial, Inc | 9 395 | −7,44 | 397 | −2,22 | ||||
| 2025-05-05 | 13F | Riverchase Wealth Management, Llc | 0 | −100,00 | 0 | |||||
| 2025-08-13 | 13F | Millstone Evans Group, LLC | 4 230 | 0,00 | 179 | 5,95 | ||||
| 2025-07-25 | 13F | We Are One Seven, LLC | 6 424 | 271 | ||||||
| 2025-08-07 | 13F | Resources Investment Advisors, LLC. | 78 662 | 169,19 | 3 322 | 184,82 | ||||
| 2025-08-01 | 13F | Corrado Advisors, Llc | 50 804 | −0,20 | 2 145 | 5,56 | ||||
| 2025-08-11 | 13F | Bellwether Advisors, LLC | 104 429 | 0,00 | 4 410 | 5,76 | ||||
| 2025-08-04 | 13F | Arkadios Wealth Advisors | 22 975 | 152,03 | 970 | 166,48 | ||||
| 2025-08-15 | 13F | Sugar Maple Asset Management, LLC | 10 579 | −6,99 | 447 | −1,76 | ||||
| 2025-08-12 | 13F | MAI Capital Management | 82 494 | −5,98 | 3 484 | −0,57 | ||||
| 2025-05-15 | 13F | Barclays Plc | 0 | −100,00 | 0 | |||||
| 2025-04-23 | 13F | Vantage Point Financial LLC | 0 | −100,00 | 0 | |||||
| 2025-07-10 | 13F | Atticus Wealth Management, Llc | 65 615 | 0,00 | 2 771 | 5,73 | ||||
| 2025-08-05 | 13F | WorthPointe, LLC | 31 319 | −0,06 | 1 323 | 5,68 | ||||
| 2025-08-07 | 13F | Runnymede Capital Advisors, Inc. | 0 | −100,00 | 0 | |||||
| 2025-07-03 | 13F | Fiduciary Financial Group, Llc | 15 661 | 0,00 | 661 | 10,35 | ||||
| 2025-07-16 | 13F | Signaturefd, Llc | 17 277 | 0,00 | 730 | 5,81 | ||||
| 2025-05-15 | 13F/A | Orion Portfolio Solutions, LLC | 5 605 | −8,70 | 224 | −9,35 | ||||
| 2025-04-15 | 13F | Noble Wealth Management PBC | 2 000 | 80 | ||||||
| 2025-07-17 | 13F | Wagner Wealth Management, Llc | 1 990 | 0,00 | 84 | 6,33 | ||||
| 2025-08-14 | 13F | Visionary Wealth Advisors | 8 847 | −1,94 | 374 | 3,61 | ||||
| 2025-08-06 | 13F | Rps Advisory Solutions Llc | 5 819 | −68,74 | 246 | −67,03 | ||||
| 2025-07-30 | 13F | Phillips Financial Management, Llc | 1 825 | 77 | ||||||
| 2025-08-04 | 13F | Creative Financial Designs Inc /adv | 3 000 | 14,55 | 127 | 21,15 | ||||
| 2025-08-14 | 13F | Kovitz Investment Group Partners, LLC | 297 489 | 3,23 | 12 563 | 9,16 | ||||
| 2025-08-11 | 13F | WPWealth LLP | 53 104 | −37,52 | 2 243 | −33,94 | ||||
| 2025-08-05 | 13F | Sigma Planning Corp | 10 710 | −13,71 | 452 | −8,69 | ||||
| 2025-07-09 | 13F | Fiduciary Alliance LLC | 7 494 | 0,00 | 316 | 5,69 | ||||
| 2025-07-14 | 13F | Kfg Wealth Management, Llc | 142 477 | 8,35 | 6 017 | 14,57 | ||||
| 2025-07-23 | 13F | Castle Rock Wealth Management, LLC | 33 281 | −8,86 | 1 420 | −2,67 | ||||
| 2025-08-14 | 13F | Mercer Global Advisors Inc /adv | 26 387 | −1,02 | 1 114 | 4,70 | ||||
| 2025-08-18 | 13F | Geneos Wealth Management Inc. | 2 850 | 0,00 | 120 | 6,19 | ||||
| 2025-07-09 | 13F | Fragasso Group Inc. | 7 923 | 0,00 | 335 | 5,70 | ||||
| 2025-07-24 | 13F | Ronald Blue Trust, Inc. | 4 996 | 0,00 | 211 | 5,53 | ||||
| 2025-08-14 | 13F | Mml Investors Services, Llc | 54 753 | 1,33 | 2 | 0,00 | ||||
| 2025-08-05 | 13F | Bank Of Montreal /can/ | 543 | 0,00 | 23 | 4,76 | ||||
| 2025-08-14 | 13F | Aqr Capital Management Llc | 13 800 | −0,06 | 583 | 5,63 | ||||
| 2025-08-13 | 13F | Virtue Capital Management, LLC | 0 | −100,00 | 0 | |||||
| 2025-08-13 | 13F | Continuum Advisory, LLC | 12 581 | −31,61 | 531 | −27,66 | ||||
| 2025-07-25 | 13F | Sequoia Financial Advisors, LLC | 9 320 | 0,00 | 394 | 5,65 | ||||
| 2025-08-12 | 13F | Jpmorgan Chase & Co | 6 959 | −36,34 | 294 | −32,80 | ||||
| 2025-08-13 | 13F | Beacon Pointe Advisors, LLC | 89 250 | −17,32 | 3 769 | −12,55 | ||||
| 2025-07-18 | 13F | Consolidated Portfolio Review Corp | 16 062 | 7,78 | 678 | 13,95 | ||||
| 2025-07-17 | 13F | Janney Montgomery Scott LLC | 50 452 | −2,77 | 2 | 0,00 | ||||
| 2025-08-08 | 13F | Kingsview Wealth Management, LLC | 42 227 | 152,00 | 1 783 | 166,52 | ||||
| 2025-07-24 | 13F | IFP Advisors, Inc | 43 013 | 83,52 | 1 816 | 94,22 | ||||
| 2025-07-10 | 13F | ARS Wealth Advisors Group, LLC | 7 268 | −35,87 | 307 | −32,30 | ||||
| 2025-08-14 | 13F | Alliancebernstein L.p. | 1 667 939 | −2,77 | 70 437 | 2,82 | ||||
| 2025-08-13 | 13F | Capital Analysts, Inc. | 2 878 | 0,00 | 0 | |||||
| 2025-08-04 | 13F | Impact Partnership Wealth, LLC | 5 878 | 13,39 | 248 | 19,81 | ||||
| 2025-05-15 | 13F | Captrust Financial Advisors | 0 | −100,00 | 0 | |||||
| 2025-08-19 | 13F | Advisory Services Network, LLC | 17 813 | 0,00 | 762 | 7,03 | ||||
| 2025-08-14 | 13F | Financial Network Wealth Advisors LLC | 4 518 | 0,00 | 191 | 5,56 | ||||
| 2025-07-14 | 13F | Chris Bulman Inc | 34 665 | 15,09 | 1 464 | 21,71 | ||||
| 2025-08-11 | 13F | HighTower Advisors, LLC | 137 896 | −12,30 | 5 823 | −7,25 | ||||
| 2025-08-13 | 13F | Cerity Partners LLC | 28 033 | −9,08 | 1 184 | −3,90 | ||||
| 2025-08-14 | 13F | Diversify Advisory Services, LLC | 89 896 | −0,76 | 3 881 | 7,90 | ||||
| 2025-08-14 | 13F | Mariner, LLC | 15 556 | 0,00 | 657 | 5,64 | ||||
| 2025-08-12 | 13F | Wood Tarver Financial Group, LLC | 12 732 | 3,67 | 1 | −100,00 | ||||
| 2025-07-14 | 13F | Southland Equity Partners LLC | 730 584 | −0,70 | 30 853 | 5,01 | ||||
| 2025-07-24 | 13F | Bernard Wealth Management Corp. | 319 | 0,00 | 13 | 8,33 | ||||
| 2025-07-29 | 13F | Chicago Partners Investment Group LLC | 12 132 | 0,00 | 518 | 7,02 | ||||
| 2025-08-08 | 13F | Cetera Investment Advisers | 272 471 | 10,53 | 11 506 | 16,88 | ||||
| 2025-07-15 | 13F | BCS Wealth Management | 60 018 | 1,52 | 3 | 0,00 | ||||
| 2025-07-29 | 13F | Straight Path Wealth Management | 17 175 | 0,00 | 725 | 5,84 | ||||
| 2025-08-14 | 13F | Frisch Financial Group, Inc. | 12 896 | 1,89 | 1 | |||||
| 2025-07-21 | 13F | Ascent Group, LLC | 9 187 | 0,00 | 388 | 5,74 | ||||
| 2025-07-29 | 13F | BKD Wealth Advisors, LLC | 65 318 | −13,25 | 2 758 | −8,25 | ||||
| 2025-04-01 | 13F/A | Family Wealth Group, LLC | 0 | −100,00 | 0 | −100,00 | ||||
| 2025-08-14 | 13F | Sunbelt Securities, Inc. | 300 | 12 | ||||||
| 2025-04-22 | 13F | Castleview Partners, Llc | 0 | −100,00 | 0 | |||||
| 2025-08-14 | 13F | Colony Group, LLC | 310 752 | 1,51 | 13 123 | 7,35 | ||||
| 2025-07-11 | 13F | Farther Finance Advisors, LLC | 22 952 | −35,26 | 969 | −31,62 | ||||
| 2025-08-12 | 13F | Change Path, LLC | 32 776 | −0,80 | 1 384 | 4,93 | ||||
| 2025-08-01 | 13F | Stuart Chaussee & Associates, Inc. | 42 000 | 22,91 | 1 774 | 29,99 | ||||
| 2025-07-17 | 13F | Smith Anglin Financial, LLC | 11 130 | −7,62 | 470 | −2,29 | ||||
| 2025-07-21 | 13F | Ameritas Advisory Services, LLC | 2 105 | 89 | ||||||
| 2025-05-16 | 13F | Coppell Advisory Solutions LLC | 0 | −100,00 | 0 | |||||
| 2025-08-06 | 13F | Bullseye Investment Management, LLC | 23 600 | 0,00 | 942 | 0,00 | ||||
| 2025-08-15 | 13F | Nikulski Financial, Inc. | 6 865 | 0,00 | 290 | 5,47 | ||||
| 2025-08-11 | 13F | Principal Securities, Inc. | 2 262 | 208,17 | 96 | 227,59 | ||||
| 2025-08-14 | 13F | Benjamin Edwards Inc | 9 904 | 0,00 | 418 | 5,82 | ||||
| 2025-07-30 | 13F | Phoenix Holdings Ltd. | 13 755 | 0,00 | 581 | 5,65 | ||||
| 2025-07-28 | 13F | Axxcess Wealth Management, Llc | 6 208 | 1,64 | 262 | 7,82 | ||||
| 2025-08-08 | 13F | Firestone Capital Management | 8 287 | 0,00 | 350 | 5,76 | ||||
| 2025-08-12 | 13F | Winnow Wealth Llc | 0 | 0 | ||||||
| 2025-05-14 | 13F | Heritage Wealth Partners, LLC | 7 055 | 282 | ||||||
| 2025-07-24 | 13F | Blair William & Co/il | 35 895 | −53,54 | 1 516 | −50,89 | ||||
| 2025-09-04 | 13F/A | Advisor Group Holdings, Inc. | 691 542 | 5,38 | 29 204 | 11,45 | ||||
| 2025-08-11 | 13F | Anfield Capital Management, LLC | 313 | 13 | ||||||
| 2025-08-12 | 13F | Weaver Consulting Group | 9 473 | −1,72 | 400 | 4,17 | ||||
| 2025-07-14 | 13F | CRA Financial Services, LLC | 58 032 | 2,88 | 2 451 | 8,79 | ||||
| 2025-08-14 | 13F | FC Advisory LLC | 4 887 | 206 |