Grundläggande statistik
| Institutionella ägare | 247 total, 247 long only, 0 short only, 0 long/short - change of 2,48% MRQ |
| Genomsnittlig portföljallokering | 0.2007 % - change of −5,15% MRQ |
| Institutionella aktier (lång) | 13 407 302 (ex 13D/G) - change of −0,18MM shares −1,35% MRQ |
| Institutionellt värde (lång) | $ 1 157 303 USD ($1000) |
Institutionellt ägande och aktieägare
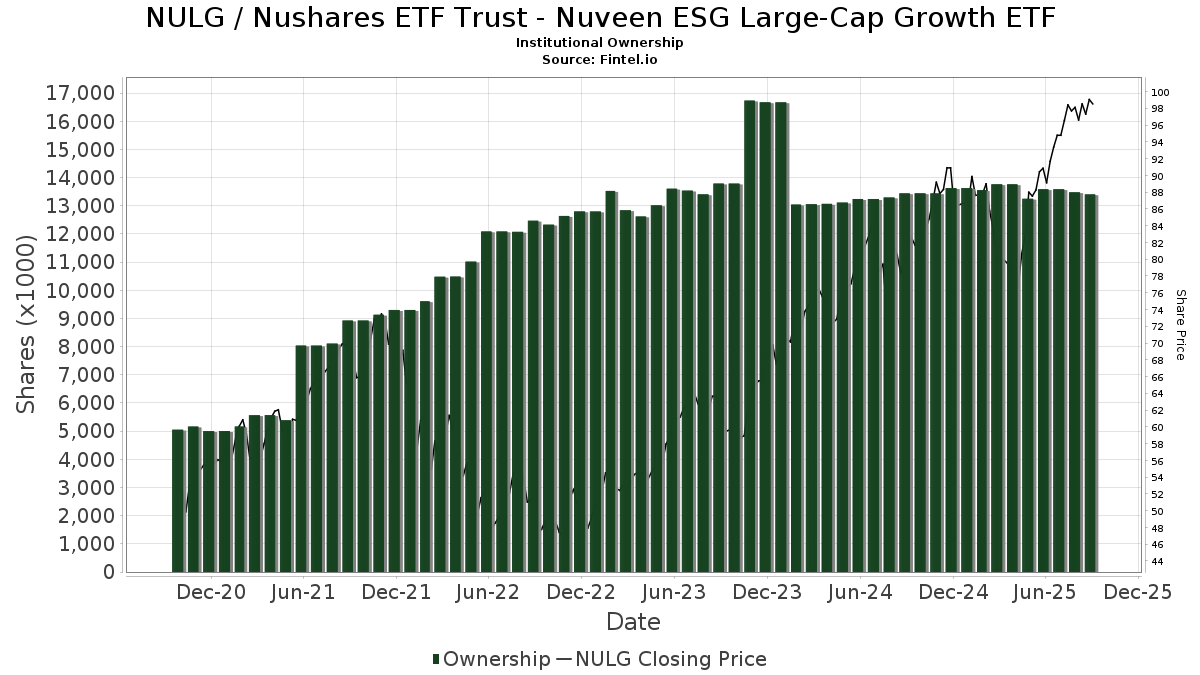
Nushares ETF Trust - Nuveen ESG Large-Cap Growth ETF (US:NULG) har 247 Institutionella ägare och aktieägare som har lämnat in 13D/G- eller 13F-formulär till Securities Exchange Commission (SEC). Dessa institut innehar totalt 13,407,302 aktier. Största aktieägare inkluderar Bank Of America Corp /de/, Tiaa Trust, National Association, LPL Financial LLC, Commonwealth Equity Services, Llc, Morgan Stanley, Envestnet Asset Management Inc, Cambridge Investment Research Advisors, Inc., UBS Group AG, Ameriprise Financial Inc, and Vestmark Advisory Solutions, Inc. .
Nushares ETF Trust - Nuveen ESG Large-Cap Growth ETF (BATS:NULG) Institutionell ägarstruktur visar institutioners och fonders nuvarande positioner i företaget, samt de senaste förändringarna i positionernas storlek. Större aktieägare kan vara enskilda investerare, fonder, hedgefonder eller institutioner. Bilaga 13D visar att investeraren äger (eller ägde) mer än 5% av företaget och avser (eller avsåg) att aktivt eftersträva en förändring av affärsstrategin. Schedule 13G indikerar en passiv investering på över 5%.
The share price as of September 16, 2025 is 98,94 / share. Previously, on September 17, 2024, the share price was 80,97 / share. This represents an increase of 22,19% over that period.
Fondsentimentets poäng
Fondsentimentet poängen(fka Ägarackumulation-poäng) visar vilka aktier som är mest köpta av fonder. Det är resultatet av en sofistikerad kvantitativ flerfaktormodell som identifierar företag med de högsta nivåerna av institutionell ackumulering. Poängsättningsmodellen använder en kombination av den totala ökningen av redovisade ägare, förändringarna i portföljallokeringarna för dessa ägare och andra mått. Siffran sträcker sig från 0 till 100, där högre siffror indikerar en högre nivå av ackumulering i förhållande till sina konkurrenter, och 50 är genomsnittet.
Uppdateringsfrekvens: Dagligen
Se Ownership Explorer, som innehåller en lista över de högst rankade företagen.
Institutionell sälj/köp-kvot
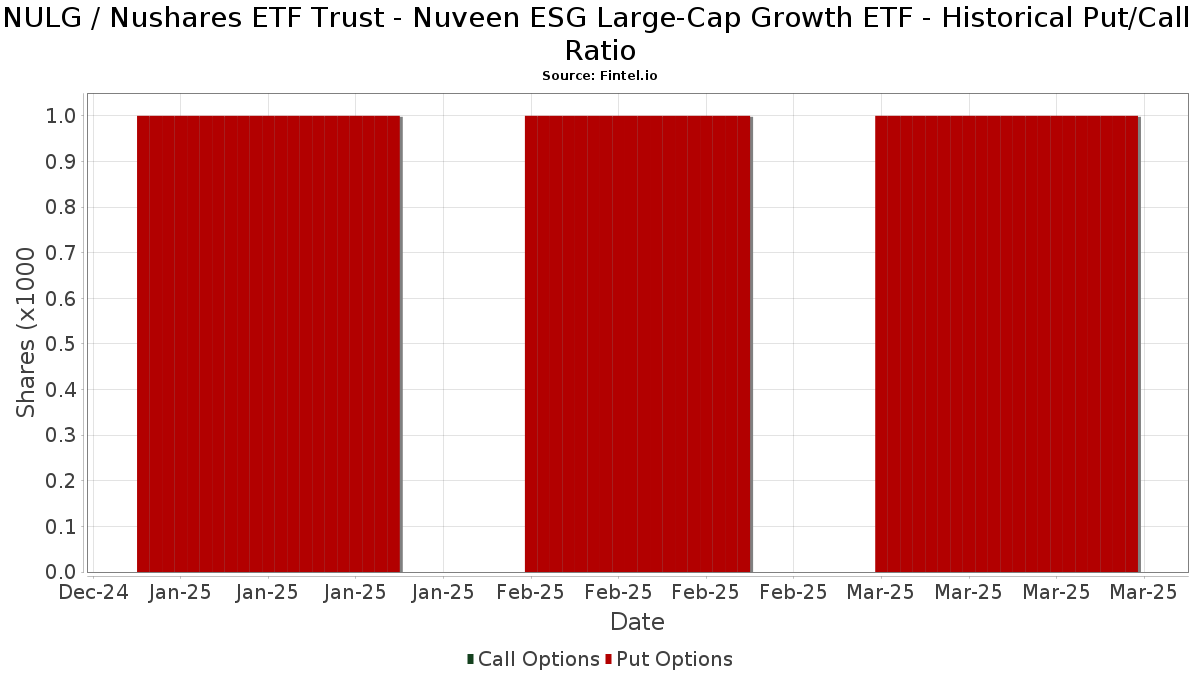
Förutom att rapportera vanliga eget kapital- och skuldemissioner måste institutioner med mer än 100MM tillgångar under förvaltning också avslöja sina innehav av sälj- och köpoptioner. Eftersom säljoptioner i allmänhet indikerar ett negativt sentiment och köpoptioner indikerar ett positivt sentiment, kan vi få en uppfattning om det övergripande institutionella sentimentet genom att plotta förhållandet mellan säljoptioner och köpoptioner. Diagrammet till höger visar det historiska förhållandet mellan sälj- och köpoptioner för detta instrument.
Genom att använda sälj/köp-kvoten som en indikator på aktieägarnas sentiment undviker man en av de största bristerna med att använda det totala institutionella ägandet, nämligen att en betydande del av de förvaltade tillgångarna investeras passivt för att följa index. Passivt förvaltade fonder köper vanligtvis inte optioner, så indikatorn för sälj/köp-kvoten ger en bättre bild av stämningen i aktivt förvaltade fonder.
13F- och NPORT-arkiveringar
Detaljer om 13F-arkiveringar är gratis. Detaljer om NP-arkiveringar kräver ett premiummedlemskap. Gröna rader indikerar nya positioner. Röda rader indikerar stängda positioner. Klicka på länk symbolen för att se hela transaktionshistoriken.
Uppgradera
för att låsa upp premiumdata och exportera till Excel ![]() .
.
| Fil Datum | Källa | Investerare | Typ | Genomsnittligt pris (beräknat) |
Aktier | Δ Aktier (%) |
Rapporterat värde (1000 USD) |
Δ Värde (%) |
Portföljallokering (%) |
|
|---|---|---|---|---|---|---|---|---|---|---|
| 2025-08-14 | 13F | Chicago Wealth Management, Inc. | 2 362 | 222 | ||||||
| 2025-07-29 | 13F | Wingate Wealth Advisors, Inc. | 2 185 | 205 | ||||||
| 2025-07-30 | 13F | Parcion Private Wealth LLC | 3 947 | 49,51 | 371 | 79,61 | ||||
| 2025-08-12 | 13F | LPL Financial LLC | 798 120 | 3,89 | 74 983 | 24,69 | ||||
| 2025-08-13 | 13F | Cerity Partners LLC | 15 466 | 4,20 | 1 453 | 25,15 | ||||
| 2025-08-14 | 13F | Integrated Wealth Concepts LLC | 3 546 | −1,20 | 333 | 18,93 | ||||
| 2025-08-14 | 13F | Clarity Asset Management, Inc. | 103 331 | −16,21 | 9 708 | 0,56 | ||||
| 2025-08-12 | 13F | Proequities, Inc. | 0 | 0 | ||||||
| 2025-08-14 | 13F | Bank Of America Corp /de/ | 3 793 820 | −0,72 | 356 429 | 19,15 | ||||
| 2025-07-28 | 13F | J.Safra Asset Management Corp | 11 113 | 0,00 | 1 034 | 18,87 | ||||
| 2025-07-16 | 13F | Signaturefd, Llc | 610 | 0,00 | 57 | 21,28 | ||||
| 2025-07-25 | 13F | Fifth Third Wealth Advisors LLC | 5 813 | 0,00 | 546 | 20,00 | ||||
| 2025-08-11 | 13F | One Capital Management, LLC | 33 936 | −28,30 | 3 188 | −13,93 | ||||
| 2025-07-29 | 13F | Monument Group Wealth Advisors, LLC | 3 673 | 0,00 | 345 | 20,21 | ||||
| 2025-08-14 | 13F | UBS Group AG | 254 778 | −1,16 | 23 936 | 18,62 | ||||
| 2025-08-14 | 13F | Horizon Investments, LLC | 0 | −100,00 | 0 | |||||
| 2025-08-26 | 13F/A | Thrivent Financial For Lutherans | 33 226 | −86,67 | 3 | −86,36 | ||||
| 2025-07-14 | 13F | Occidental Asset Management, LLC | 2 495 | 234 | ||||||
| 2025-07-23 | 13F | ETF Portfolio Partners, Inc. | 4 682 | 3,13 | 440 | 23,66 | ||||
| 2025-07-18 | 13F | Bartlett & Co. Wealth Management Llc | 59 | 0,00 | 6 | 25,00 | ||||
| 2025-08-04 | 13F | Pensionmark Financial Group, Llc | 7 549 | −1,88 | 709 | 17,77 | ||||
| 2025-08-12 | 13F | O'shaughnessy Asset Management, Llc | 929 | −44,74 | 87 | −33,59 | ||||
| 2025-07-10 | 13F | Stewardship Advisors, LLC | 2 367 | −21,93 | 222 | −6,33 | ||||
| 2025-08-08 | 13F | Creative Planning | 7 947 | 0,00 | 747 | 19,94 | ||||
| 2025-08-05 | 13F | Clarity Wealth Development LLC | 4 347 | 3,08 | 408 | 20,00 | ||||
| 2025-07-18 | 13F | Bridge Generations Wealth Management Llc | 0 | −100,00 | 0 | |||||
| 2025-05-14 | 13F | Flow Traders U.s. Llc | 0 | −100,00 | 0 | |||||
| 2025-08-15 | 13F | Equitable Holdings, Inc. | 13 567 | 6,73 | 1 275 | 28,04 | ||||
| 2025-05-02 | 13F | Cullen/frost Bankers, Inc. | 0 | −100,00 | 0 | |||||
| 2025-07-30 | 13F | Fingerlakes Wealth Management, Inc. | 4 008 | 377 | ||||||
| 2025-08-14 | 13F | Mariner, LLC | 24 834 | 0,58 | 2 333 | 20,76 | ||||
| 2025-08-13 | 13F | Cary Street Partners Financial Llc | 17 249 | 0,00 | 1 621 | 20,00 | ||||
| 2025-08-07 | 13F | BOK Financial Private Wealth, Inc. | 374 | 0,00 | 35 | 20,69 | ||||
| 2025-07-23 | 13F | Nbt Bank N A /ny | 901 | 0,00 | 85 | 20,00 | ||||
| 2025-08-08 | 13F | Empower Advisory Group, LLC | 2 287 | 215 | ||||||
| 2025-05-09 | 13F | GeoWealth Management, LLC | 0 | −100,00 | 0 | |||||
| 2025-08-14 | 13F | Qube Research & Technologies Ltd | 0 | −100,00 | 0 | |||||
| 2025-07-11 | 13F | Seacrest Wealth Management, Llc | 3 653 | 0,00 | 343 | 20,35 | ||||
| 2025-08-14 | 13F | Citadel Advisors Llc | 0 | −100,00 | 0 | |||||
| 2025-07-23 | 13F | Financial Life Advisors | 3 640 | 0,00 | 342 | 20,07 | ||||
| 2025-08-05 | 13F | Mission Wealth Management, Lp | 99 789 | 2,76 | 9 375 | 23,34 | ||||
| 2025-08-12 | 13F | Steward Partners Investment Advisory, Llc | 4 535 | −1,16 | 426 | 18,66 | ||||
| 2025-08-15 | 13F | Morgan Stanley | 446 398 | −8,06 | 41 939 | 10,35 | ||||
| 2025-08-08 | 13F | L & S Advisors Inc | 27 260 | 7,15 | 2 561 | 28,63 | ||||
| 2025-08-15 | 13F | Captrust Financial Advisors | 98 449 | −1,82 | 9 249 | 17,84 | ||||
| 2025-07-31 | 13F | Cambridge Investment Research Advisors, Inc. | 275 117 | 1,66 | 26 | 19,05 | ||||
| 2025-07-14 | 13F | McMahon Financial Advisors, LLC | 14 585 | 0,00 | 1 370 | 20,07 | ||||
| 2025-07-08 | 13F | Parallel Advisors, LLC | 1 549 | 0,00 | 146 | 19,83 | ||||
| 2025-07-15 | 13F | Garrett Investment Advisors LLC | 17 837 | 3,23 | 1 676 | 23,89 | ||||
| 2025-07-25 | 13F | Northwest Capital Management Inc | 0 | −100,00 | 0 | |||||
| 2025-07-28 | 13F | Copia Wealth Management | 172 | 0,00 | 16 | 23,08 | ||||
| 2025-08-05 | 13F | Tiaa Trust, National Association | 2 512 786 | 2,68 | 236 076 | 23,24 | ||||
| 2025-05-06 | 13F | AE Wealth Management LLC | 0 | −100,00 | 0 | |||||
| 2025-07-31 | 13F | Trademark Financial Management, LLC | 14 215 | 3,72 | 1 335 | 24,53 | ||||
| 2025-07-29 | 13F | Private Wealth Management Group, LLC | 6 213 | −1,65 | 584 | 18,02 | ||||
| 2025-07-10 | 13F | Focus Financial Network, Inc. | 3 841 | 40,54 | 361 | 69,01 | ||||
| 2025-08-14 | 13F | Jane Street Group, Llc | 24 746 | 2 325 | ||||||
| 2025-08-15 | 13F | Kestra Advisory Services, LLC | 9 122 | 3,82 | 857 | 24,60 | ||||
| 2025-08-12 | 13F/A | Cozad Asset Management Inc | 10 750 | −0,42 | 1 010 | 19,41 | ||||
| 2025-07-11 | 13F | Westfuller Advisors, LLC | 7 013 | 0,00 | 659 | 19,85 | ||||
| 2025-08-01 | 13F | Equita Financial Network, Inc. | 19 834 | −16,90 | 1 863 | −0,27 | ||||
| 2025-08-08 | 13F | Laurel Wealth Planning LLC | 36 838 | 1,76 | 3 461 | 22,13 | ||||
| 2025-05-02 | 13F | Concord Wealth Partners | 0 | −100,00 | 0 | |||||
| 2025-07-17 | 13F | Montis Financial, LLC | 5 288 | −8,61 | 497 | 9,73 | ||||
| 2025-08-13 | 13F | Continuum Advisory, LLC | 0 | −100,00 | 0 | |||||
| 2025-08-14 | 13F | Fmr Llc | 35 948 | 76,19 | 3 377 | 111,46 | ||||
| 2025-08-12 | 13F | AlphaCore Capital LLC | 0 | −100,00 | 0 | |||||
| 2025-08-06 | 13F | Vestmark Advisory Solutions, Inc. | 209 700 | 84,36 | 19 701 | 121,26 | ||||
| 2025-08-14 | 13F | Dagco, Inc. | 1 105 | 0,00 | 104 | 19,77 | ||||
| 2025-08-14 | 13F | Aprio Wealth Management, LLC | 6 125 | 5,40 | 575 | 26,65 | ||||
| 2025-05-21 | 13F/A | Geneos Wealth Management Inc. | 0 | −100,00 | 0 | −100,00 | ||||
| 2025-07-07 | 13F | Investors Research Corp | 980 | 28,78 | 92 | 55,93 | ||||
| 2025-07-07 | 13F | Trust Co | 3 583 | −13,56 | 337 | 3,70 | ||||
| 2025-08-13 | 13F | ARGI Investment Services, LLC | 79 966 | 0,00 | 7 513 | 20,02 | ||||
| 2025-08-19 | 13F | Cape Investment Advisory, Inc. | 1 306 | 9,93 | 123 | 32,61 | ||||
| 2025-07-17 | 13F | LexAurum Advisors, LLC | 8 811 | 3,99 | 828 | 24,74 | ||||
| 2025-08-11 | 13F | Cornerstone Planning Group LLC | 3 589 | 0,00 | 348 | 26,18 | ||||
| 2025-08-01 | 13F | Envestnet Asset Management Inc | 281 723 | −0,87 | 26 468 | 18,97 | ||||
| 2025-04-17 | 13F | Dynamic Advisor Solutions LLC | 0 | −100,00 | 0 | |||||
| 2025-08-13 | 13F | Millstone Evans Group, LLC | 374 | 0,00 | 35 | 20,69 | ||||
| 2025-08-14 | 13F | GWM Advisors LLC | 52 608 | 25,26 | 4 943 | 50,35 | ||||
| 2025-08-14 | 13F | Diversify Advisory Services, LLC | 2 509 | 245 | ||||||
| 2025-07-30 | 13F | Whittier Trust Co Of Nevada Inc | 850 | 0,00 | 80 | 19,70 | ||||
| 2025-08-12 | 13F | OneAscent Financial Services LLC | 2 851 | 0,04 | 0 | |||||
| 2025-07-18 | 13F | PFG Investments, LLC | 0 | −100,00 | 0 | |||||
| 2025-07-22 | 13F | Sage Financial Group Inc | 7 559 | 0,00 | 710 | 20,14 | ||||
| 2025-08-05 | 13F | Scarborough Advisors, LLC | 92 | 9 | ||||||
| 2025-08-07 | 13F | Verus Capital Partners, Llc | 3 091 | 0,10 | 290 | 20,33 | ||||
| 2025-04-24 | 13F | Beacon Financial Advisory LLC | 0 | −100,00 | 0 | |||||
| 2025-07-25 | 13F | Apollon Wealth Management, LLC | 6 006 | 0,00 | 564 | 20,00 | ||||
| 2025-08-07 | 13F | Curtis Advisory Group, LLC | 12 232 | 1,12 | 1 149 | 21,46 | ||||
| 2025-07-21 | 13F | Impact Investors, Inc | 127 538 | −1,64 | 11 982 | 18,05 | ||||
| 2025-07-16 | 13F | Beaumont Financial Advisors, LLC | 3 100 | 0,00 | 291 | 20,25 | ||||
| 2025-07-30 | 13F | Princeton Global Asset Management LLC | 2 071 | 11,28 | 195 | 33,79 | ||||
| 2025-08-19 | 13F | Anchor Investment Management, LLC | 659 | 0,00 | 62 | 19,61 | ||||
| 2025-07-17 | 13F | XY Planning Network, Inc. | 15 446 | 2,94 | 1 451 | 23,59 | ||||
| 2025-08-13 | 13F | First Trust Advisors Lp | 4 121 | −1,20 | 387 | 18,71 | ||||
| 2025-08-14 | 13F | Goldman Sachs Group Inc | 0 | −100,00 | 0 | |||||
| 2025-07-30 | 13F | White Lighthouse Investment Management Inc. | 7 110 | 25,57 | 668 | 50,56 | ||||
| 2025-08-13 | 13F | Transce3nd, LLC | 31 | 3 | ||||||
| 2025-07-30 | 13F | Eqis Capital Management, Inc. | 14 539 | −9,64 | 1 366 | 8,42 | ||||
| 2025-08-08 | 13F | Francis Financial, Inc. | 68 512 | −2,85 | 6 437 | 16,59 | ||||
| 2025-08-14 | 13F | Smartleaf Asset Management LLC | 165 | 89,66 | 15 | 150,00 | ||||
| 2025-09-04 | 13F/A | Advisor Group Holdings, Inc. | 51 312 | 37,45 | 4 709 | 61,07 | ||||
| 2025-07-16 | 13F/A | CX Institutional | 18 910 | −5,84 | 2 | 0,00 | ||||
| 2025-07-30 | 13F/A | KPP Advisory Services LLC | 2 839 | 267 | ||||||
| 2025-08-06 | 13F | DDFG, Inc | 6 036 | 0,00 | 567 | 20,13 | ||||
| 2025-07-17 | 13F | Janney Montgomery Scott LLC | 0 | −100,00 | 0 | |||||
| 2025-08-07 | 13F | Commerce Bank | 8 684 | −2,63 | 816 | 16,76 | ||||
| 2025-07-17 | 13F | Keystone Global Partners, LLC | 607 | −2,88 | 57 | 18,75 | ||||
| 2025-08-14 | 13F | Win Advisors, Inc | 4 784 | 1,33 | 449 | 21,68 | ||||
| 2025-07-21 | 13F | Ameritas Advisory Services, LLC | 12 240 | 1 150 | ||||||
| 2025-08-12 | 13F | Coldstream Capital Management Inc | 69 940 | 144,29 | 6 571 | 193,17 | ||||
| 2025-08-06 | 13F | Commonwealth Equity Services, Llc | 599 617 | −0,10 | 56 | 21,74 | ||||
| 2025-08-13 | 13F | VestGen Advisors, LLC | 8 476 | −14,47 | 818 | 5,55 | ||||
| 2025-07-10 | 13F | IMPACTfolio, LLC | 0 | −100,00 | 0 | |||||
| 2025-08-05 | 13F | Bank of New York Mellon Corp | 77 511 | −0,11 | 7 282 | 19,89 | ||||
| 2025-05-02 | 13F | Cable Hill Partners, LLC | 47 032 | 2,87 | 3 793 | −3,36 | ||||
| 2025-07-10 | 13F | Wealth Enhancement Advisory Services, Llc | 93 456 | 0,31 | 8 850 | 21,35 | ||||
| 2025-07-23 | 13F | Valmark Advisers, Inc. | 2 998 | 0,00 | 282 | 20,09 | ||||
| 2025-08-27 | 13F/A | Brinker Capital Investments, LLC | 3 135 | −3,63 | 295 | 15,75 | ||||
| 2025-07-30 | 13F | D.a. Davidson & Co. | 5 117 | −0,39 | 481 | 19,40 | ||||
| 2025-08-13 | 13F | Per Stirling Capital Management, LLC. | 2 501 | −41,08 | 235 | −29,52 | ||||
| 2025-04-28 | 13F | Mainstream Capital Management LLC | 0 | −100,00 | 0 | |||||
| 2025-07-09 | 13F | Sandbox Financial Partners, LLC | 10 008 | 12,58 | 940 | 35,25 | ||||
| 2025-07-25 | 13F | Wealth Advisory Team LLC | 23 810 | 2 237 | ||||||
| 2025-07-24 | 13F | Stonebridge Financial Group, LLC | 2 533 | 0,00 | 238 | 19,70 | ||||
| 2025-05-16 | 13F | Coppell Advisory Solutions LLC | 0 | −100,00 | 0 | |||||
| 2025-07-11 | 13F | Scott Capital Advisors, LLC | 8 990 | 852 | ||||||
| 2025-08-14 | 13F | Mercer Global Advisors Inc /adv | 14 174 | −0,03 | 1 332 | 20,02 | ||||
| 2025-08-04 | 13F | Rede Wealth, LLC | 5 584 | 0,00 | 525 | 19,91 | ||||
| 2025-08-13 | 13F | Marshall Wace, Llp | 4 476 | 421 | ||||||
| 2025-08-14 | 13F | Abound Financial, Llc | 6 821 | −11,98 | 641 | 5,61 | ||||
| 2025-08-08 | 13F | RAM Investment Partners, LLC | 6 062 | 0,00 | 570 | 20,04 | ||||
| 2025-08-14 | 13F | Wells Fargo & Company/mn | 51 527 | 1,27 | 4 841 | 21,52 | ||||
| 2025-08-15 | 13F | Tower Research Capital LLC (TRC) | 1 342 | −90,62 | 126 | −88,74 | ||||
| 2025-08-14 | 13F | Royal Bank Of Canada | 49 270 | 12,93 | 4 629 | 35,51 | ||||
| 2025-08-01 | 13F | Rossby Financial, LCC | 6 410 | −8,65 | 602 | 7,31 | ||||
| 2025-08-07 | 13F | Fountainhead AM, LLC | 3 432 | −12,43 | 322 | 5,23 | ||||
| 2025-08-08 | 13F | Avantax Advisory Services, Inc. | 9 086 | −0,59 | 854 | 19,30 | ||||
| 2025-08-04 | 13F | Quaker Wealth Management, LLC | Put | 0 | −100,00 | 0 | −100,00 | |||
| 2025-08-19 | 13F | National Asset Management, Inc. | 22 905 | −3,55 | 2 152 | 5,54 | ||||
| 2025-04-30 | 13F | M&t Bank Corp | 0 | −100,00 | 0 | |||||
| 2025-07-30 | 13F | Greenup Street Wealth Management Llc | 6 441 | 605 | ||||||
| 2025-07-16 | 13F | Novem Group | 2 819 | 0,00 | 265 | 20,00 | ||||
| 2025-08-06 | 13F | Columbia River Financial Group, LLC | 3 141 | 3,36 | 0 | |||||
| 2025-08-05 | 13F | Westside Investment Management, Inc. | 265 | 0,00 | 25 | 20,00 | ||||
| 2025-07-14 | 13F | Park Avenue Securities Llc | 13 636 | 1 | ||||||
| 2025-07-22 | 13F | Mascoma Wealth Management LLC | 25 565 | −5,46 | 2 402 | 13,47 | ||||
| 2025-07-28 | 13F | Harbour Investments, Inc. | 5 933 | 89,73 | 557 | 128,28 | ||||
| 2025-07-30 | 13F | Principle Wealth Partners Llc | 4 487 | 0,02 | 422 | 19,94 | ||||
| 2025-08-08 | 13F | Emerald Investment Partners, Llc | 12 298 | −5,42 | 1 155 | 13,57 | ||||
| 2025-07-17 | 13F | Sfm, Llc | 2 517 | −4,33 | 236 | 15,12 | ||||
| 2025-08-11 | 13F | Wescott Financial Advisory Group, LLC | 11 786 | 15,79 | 1 107 | 39,07 | ||||
| 2025-07-14 | 13F | Golden State Equity Partners | 25 789 | −10,39 | 2 423 | 7,55 | ||||
| 2025-08-08 | 13F | Cetera Investment Advisers | 92 081 | 13,19 | 8 651 | 35,85 | ||||
| 2025-07-25 | 13F | Natural Investments, Llc | 2 665 | −6,23 | 0 | |||||
| 2025-08-13 | 13F | Capital Analysts, Inc. | 6 980 | 7,20 | 1 | |||||
| 2025-07-23 | 13F | Kingswood Wealth Advisors, Llc | 12 055 | −0,40 | 1 133 | 19,54 | ||||
| 2025-05-15 | 13F | Lido Advisors, LLC | 0 | −100,00 | 0 | |||||
| 2025-07-15 | 13F | McAdam, LLC | 6 131 | 5,96 | 576 | 27,43 | ||||
| 2025-07-21 | 13F | Empirical Financial Services, LLC d.b.a. Empirical Wealth Management | 6 114 | 19,79 | 574 | 43,86 | ||||
| 2025-08-11 | 13F | HighTower Advisors, LLC | 87 504 | −3,77 | 8 221 | 15,48 | ||||
| 2025-07-18 | 13F | First Pacific Financial | 14 820 | 28,52 | 1 392 | 54,32 | ||||
| 2025-07-25 | 13F | Cwm, Llc | 16 154 | 496,09 | 2 | |||||
| 2025-07-25 | 13F | NorthRock Partners, LLC | 19 818 | −4,86 | 1 862 | 14,17 | ||||
| 2025-08-01 | 13F | May Hill Capital, LLC | 6 326 | 0,00 | 594 | 20,00 | ||||
| 2025-08-14 | 13F | IHT Wealth Management, LLC | 17 064 | 0,50 | 1 603 | 20,62 | ||||
| 2025-08-13 | 13F | Colonial Trust Advisors | 600 | 0,00 | 56 | 21,74 | ||||
| 2025-08-07 | 13F | Allworth Financial LP | 4 244 | −3,87 | 399 | 14,37 | ||||
| 2025-07-17 | 13F | Refined Wealth Management | 12 853 | −4,23 | 1 208 | 14,95 | ||||
| 2025-08-12 | 13F | Archer Investment Corp | 470 | 0,00 | 44 | 22,22 | ||||
| 2025-08-14 | 13F | McIlrath & Eck, LLC | 648 | −7,69 | 61 | 11,11 | ||||
| 2025-07-18 | 13F | Truist Financial Corp | 6 328 | 2,88 | 595 | 23,49 | ||||
| 2025-07-24 | 13F | Us Bancorp \de\ | 31 146 | −23,58 | 2 926 | −8,28 | ||||
| 2025-07-31 | 13F | Orion Capital Management LLC | 301 | 0,00 | 28 | 21,74 | ||||
| 2025-07-08 | 13F | Prism Advisors, Inc. | 5 190 | −23,15 | 488 | −7,77 | ||||
| 2025-07-16 | 13F | Falcon Wealth Planning | 15 491 | 22,69 | 1 455 | 47,27 | ||||
| 2025-07-29 | 13F | Stratos Wealth Partners, LTD. | 10 477 | −0,28 | 984 | 19,71 | ||||
| 2025-05-14 | 13F | Caitlin John, LLC | 0 | −100,00 | 0 | |||||
| 2025-07-09 | 13F | O'Brien Wealth Partners LLC | 107 487 | 0,36 | 10 098 | 20,44 | ||||
| 2025-08-05 | 13F | GPS Wealth Strategies Group, LLC | 350 | 0,00 | 33 | 18,52 | ||||
| 2025-04-23 | 13F | VisionPoint Advisory Group, LLC | 0 | −100,00 | 0 | |||||
| 2025-08-14 | 13F | CoreCap Advisors, LLC | 1 222 | 0,00 | 115 | 20,00 | ||||
| 2025-07-31 | 13F | Buckingham Strategic Partners | 3 370 | 0,00 | 317 | 20,15 | ||||
| 2025-08-08 | 13F | Pnc Financial Services Group, Inc. | 16 863 | 0,66 | 1 584 | 20,82 | ||||
| 2025-08-12 | 13F | MAI Capital Management | 2 706 | 0,33 | 254 | 20,38 | ||||
| 2025-07-15 | 13F | Legacy Financial Group LLC | 6 270 | −5,64 | 589 | 13,27 | ||||
| 2025-07-25 | 13F | Envestnet Portfolio Solutions, Inc. | 195 353 | −2,43 | 18 353 | 17,11 | ||||
| 2025-08-14 | 13F | EP Wealth Advisors, Inc. | 11 964 | 37,39 | 1 124 | 65,05 | ||||
| 2025-07-31 | 13F | Oppenheimer Asset Management Inc. | 26 793 | 1,71 | 2 517 | 22,07 | ||||
| 2025-08-14 | 13F | Susquehanna International Group, Llp | 5 716 | −82,97 | 537 | −79,56 | ||||
| 2025-07-31 | 13F | CVA Family Office, LLC | 430 | 0,00 | 40 | 21,21 | ||||
| 2025-07-25 | 13F | Atria Wealth Solutions, Inc. | 0 | −100,00 | 0 | |||||
| 2025-07-15 | 13F | RTD Financial Advisors, Inc. | 4 518 | −13,86 | 424 | 3,41 | ||||
| 2025-07-02 | 13F | Capital Market Strategies LLC | 2 304 | 216 | ||||||
| 2025-08-12 | 13F | Marshall & Sterling Wealth Advisors Inc. | 8 638 | −13,65 | 809 | 3,32 | ||||
| 2025-08-12 | 13F | Investor's Fiduciary Advisor Network, LLC | 5 603 | −1,74 | 1 | |||||
| 2025-08-14 | 13F | Raymond James Financial Inc | 31 934 | −6,13 | 3 000 | 12,65 | ||||
| 2025-05-02 | 13F | Wsfs Capital Management, Llc | 0 | −100,00 | 0 | |||||
| 2025-07-29 | 13F | Signature Estate & Investment Advisors Llc | 11 441 | −6,26 | 1 075 | 12,46 | ||||
| 2025-08-13 | 13F | Baltimore-Washington Financial Advisors, Inc. | 16 811 | 0,59 | 1 579 | 20,72 | ||||
| 2025-07-29 | 13F | Crux Wealth Advisors | 34 450 | 3 237 | ||||||
| 2025-08-04 | 13F | Savvy Advisors, Inc. | 3 161 | 297 | ||||||
| 2025-08-13 | 13F | Beacon Pointe Advisors, LLC | 83 182 | 7,58 | 7 815 | 29,11 | ||||
| 2025-05-14 | 13F | Retirement Capital Strategies | 0 | −100,00 | 0 | |||||
| 2025-07-16 | 13F | Diversified Enterprises, LLC | 2 630 | 0,00 | 247 | 20,49 | ||||
| 2025-08-13 | 13F | Northwestern Mutual Wealth Management Co | 18 286 | −5,26 | 1 718 | 13,71 | ||||
| 2025-07-11 | 13F | Colorado Capital Management, Inc. | 13 746 | −2,50 | 1 | 0,00 | ||||
| 2025-08-13 | 13F | WCG Wealth Advisors LLC | 46 690 | 45,47 | 4 387 | 74,60 | ||||
| 2025-07-28 | 13F | Revolve Wealth Partners, LLC | 23 753 | −1,36 | 2 232 | 18,36 | ||||
| 2025-04-25 | 13F | MidAtlantic Capital Management, Inc. | 0 | −100,00 | 0 | |||||
| 2025-08-05 | 13F | Uniting Wealth Partners, LLC | 70 290 | 0,47 | 6 604 | 20,58 | ||||
| 2025-08-13 | 13F | Milestone Investment Advisors LLC | 1 495 | −34,31 | 140 | −21,35 | ||||
| 2025-07-18 | 13F | Lockerman Financial Group, Inc. | 6 179 | −6,08 | 581 | 12,62 | ||||
| 2025-04-17 | 13F | RHS Financial, LLC | 0 | −100,00 | 0 | |||||
| 2025-08-14 | 13F | Betterment LLC | 2 768 | 0 | ||||||
| 2025-07-29 | 13F | Elevation Capital Advisory, LLC | 0 | −100,00 | 0 | |||||
| 2025-08-04 | 13F | Creative Financial Designs Inc /adv | 1 093 | 0,00 | 103 | 20,00 | ||||
| 2025-07-17 | 13F | HB Wealth Management, LLC | 4 908 | −3,54 | 461 | 15,83 | ||||
| 2025-07-31 | 13F | Money Design Co.,Ltd. | 39 013 | 3,18 | 4 | 50,00 | ||||
| 2025-07-22 | 13F | Financial Insights, Inc. | 16 078 | 1 511 | ||||||
| 2025-07-25 | 13F | Quantum Financial Planning Services, Inc. | 3 324 | −3,79 | 312 | 15,56 | ||||
| 2025-08-05 | 13F | Huntington National Bank | 235 | 4 600,00 | ||||||
| 2025-08-04 | 13F | Quaker Wealth Management, LLC | 1 331 | 125 | ||||||
| 2025-08-13 | 13F | Maia Wealth LLC | 6 668 | 0,00 | 626 | 21,55 | ||||
| 2025-08-14 | 13F | Ameriprise Financial Inc | 242 524 | −3,10 | 22 807 | 16,32 | ||||
| 2025-08-06 | 13F | Golden State Wealth Management, LLC | 5 492 | 19,47 | 516 | 43,45 | ||||
| 2025-08-14 | 13F | Comerica Bank | 1 588 | 0,00 | 149 | 20,16 | ||||
| 2025-07-21 | 13F | DHJJ Financial Advisors, Ltd. | 580 | 0,00 | 54 | 20,00 | ||||
| 2025-08-11 | 13F | Private Advisor Group, LLC | 60 928 | −32,85 | 5 724 | −19,41 | ||||
| 2025-08-12 | 13F | Bokf, Na | 22 642 | −3,44 | 2 127 | 15,91 | ||||
| 2025-08-11 | 13F | Aptus Capital Advisors, LLC | 23 810 | −2,07 | 2 237 | 17,50 | ||||
| 2025-08-04 | 13F | Assetmark, Inc | 55 247 | 3,19 | 5 190 | 23,84 | ||||
| 2025-08-25 | 13F | Hilltop Partners LLC | 2 192 | −28,04 | 206 | −13,87 | ||||
| 2025-05-09 | 13F | Avalon Trust Co | 0 | −100,00 | 0 | |||||
| 2025-08-11 | 13F | Avantax Planning Partners, Inc. | 5 029 | −24,79 | 472 | −9,75 | ||||
| 2025-07-18 | 13F | Vicus Capital | 7 482 | 0,58 | 703 | 20,62 | ||||
| 2025-07-09 | 13F | Lifelong Wealth Advisors, Inc. | 3 616 | −6,10 | 340 | 12,62 | ||||
| 2025-07-30 | 13F | Onyx Bridge Wealth Group LLC | 7 315 | −34,35 | 687 | −21,22 | ||||
| 2025-08-13 | 13F | EverSource Wealth Advisors, LLC | 99 | 0,00 | 9 | 28,57 | ||||
| 2025-07-23 | 13F | Clear Creek Financial Management, LLC | 3 241 | 0,00 | 304 | 20,16 | ||||
| 2025-08-06 | 13F | Walkner Condon Financial Advisors LLC | 7 927 | 0,00 | 745 | 20,00 | ||||
| 2025-07-11 | 13F/A | Umb Bank N A/mo | 28 329 | −7,66 | 2 662 | 10,83 | ||||
| 2025-07-18 | 13F | Trust Co Of Vermont | 1 959 | 0,00 | 184 | 20,26 | ||||
| 2025-07-29 | 13F | Kelman-Lazarov, Inc. | 3 912 | 0,00 | 368 | 19,93 | ||||
| 2025-07-29 | 13F | DeDora Capital, Inc. | 75 317 | −0,59 | 7 076 | 19,33 | ||||
| 2025-08-06 | 13F | Paulson Wealth Management Inc. | 5 180 | 1,11 | 487 | 21,20 | ||||
| 2025-08-12 | 13F | SRS Capital Advisors, Inc. | 200 | 19 | ||||||
| 2025-05-15 | 13F/A | Orion Portfolio Solutions, LLC | 3 253 | 20,35 | 255 | 9,48 | ||||
| 2025-07-15 | 13F | RVW Wealth, LLC | 141 133 | −1,04 | 13 259 | 18,78 | ||||
| 2025-08-04 | 13F | Daymark Wealth Partners, Llc | 0 | −100,00 | 0 | |||||
| 2025-08-12 | 13F | BlueStem Wealth Partners, LLC | 11 544 | 4,18 | 1 085 | 25,03 | ||||
| 2025-08-07 | 13F | Parkside Financial Bank & Trust | 5 069 | 0,00 | 476 | 20,20 | ||||
| 2025-08-14 | 13F | Mml Investors Services, Llc | 9 166 | −10,65 | 1 | |||||
| 2025-08-15 | 13F | CI Private Wealth, LLC | 32 867 | −0,41 | 3 088 | 19,51 | ||||
| 2025-04-22 | 13F | Synergy Financial Management, LLC | 0 | −100,00 | 0 | |||||
| 2025-07-15 | 13F | Aspire Capital Advisors LLC | 0 | −100,00 | 0 | |||||
| 2025-07-09 | 13F | Berkshire Bank | 5 944 | −7,90 | 558 | 10,50 | ||||
| 2025-07-23 | 13F | SGL Investment Advisors, Inc. | 22 365 | −1,51 | 2 102 | 10,70 | ||||
| 2025-08-07 | 13F | Legacy Financial Advisors, Inc. | 3 758 | 8,27 | 353 | 30,26 | ||||
| 2025-07-11 | 13F | Farther Finance Advisors, LLC | 1 966 | 0,00 | 185 | 18,71 | ||||
| 2025-08-01 | 13F | American Financial & Tax Strategies Inc | 3 299 | 6,15 | 310 | 27,16 | ||||
| 2025-07-22 | 13F | Merit Financial Group, LLC | 2 814 | 8,27 | 264 | 30,05 | ||||
| 2025-07-09 | 13F | Wolff Financial Management Llc | 2 990 | 0,00 | 0 | |||||
| 2025-07-29 | 13F | Harbor Asset Planning, Inc. | 1 207 | 113 | ||||||
| 2025-07-22 | 13F | USAdvisors Wealth Management, LLC | 3 534 | 33,97 | 0 | |||||
| 2025-07-25 | 13F | Evolution Advisers, Inc. | 31 653 | −0,90 | 3 | 0,00 | ||||
| 2025-08-11 | 13F | Western Wealth Management, LLC | 4 470 | 1,13 | 420 | 21,45 | ||||
| 2025-08-12 | 13F | Global Retirement Partners, LLC | 56 284 | −5,62 | 5 288 | 3,28 | ||||
| 2025-08-11 | 13F | Principal Securities, Inc. | 3 564 | 168,78 | 335 | 195,58 | ||||
| 2025-07-17 | 13F | Alpine Bank Wealth Management | 672 | 0,00 | 63 | 21,15 | ||||
| 2025-08-05 | 13F | Strategic Financial Concepts, LLC | 0 | −100,00 | 0 | |||||
| 2025-08-12 | 13F | Jpmorgan Chase & Co | 79 338 | 23,96 | 7 454 | 48,76 | ||||
| 2025-05-14 | 13F | Estate Counselors, LLC | 0 | −100,00 | 0 | |||||
| 2025-07-11 | 13F | Skyline Advisors, Inc. | 8 060 | 2,06 | 757 | 22,49 | ||||
| 2025-07-18 | 13F | Marino, Stram & Associates Llc | 15 781 | 45,17 | 1 483 | 74,35 | ||||
| 2025-04-29 | 13F | Financial Network Wealth Management LLC | 964 | 0 | ||||||
| 2025-07-14 | 13F | Sterling Group Wealth Management, LLC | 2 554 | −28,78 | 240 | −14,64 | ||||
| 2025-08-14 | 13F | Redwood Financial Network Corp | 3 506 | −7,71 | 329 | 10,77 | ||||
| 2025-08-04 | 13F | Flagship Harbor Advisors, Llc | 12 158 | 10,72 | 1 142 | 32,95 | ||||
| 2025-08-14 | 13F | Stifel Financial Corp | 2 679 | 252 | ||||||
| 2025-07-18 | 13F | Institute for Wealth Management, LLC. | 8 515 | 0,46 | 800 | 20,51 | ||||
| 2025-07-23 | 13F | Heck Capital Advisors, LLC | 15 236 | −0,03 | 1 431 | 19,95 | ||||
| 2025-08-05 | 13F | Cherry Tree Wealth Management, LLC | 951 | 0,00 | 89 | 20,27 | ||||
| 2025-08-07 | 13F | Rollins Financial Advisors, LLC | 3 097 | 0,00 | 291 | 19,83 | ||||
| 2025-08-05 | 13F | Flynn Zito Capital Management, Llc | 4 271 | 3,01 | 401 | 23,77 |