Grundläggande statistik
| Institutionella ägare | 263 total, 259 long only, 0 short only, 4 long/short - change of 3,52% MRQ |
| Genomsnittlig portföljallokering | 0.1710 % - change of −26,66% MRQ |
| Institutionella aktier (lång) | 53 647 277 (ex 13D/G) - change of 0,99MM shares 1,89% MRQ |
| Institutionellt värde (lång) | $ 672 142 USD ($1000) |
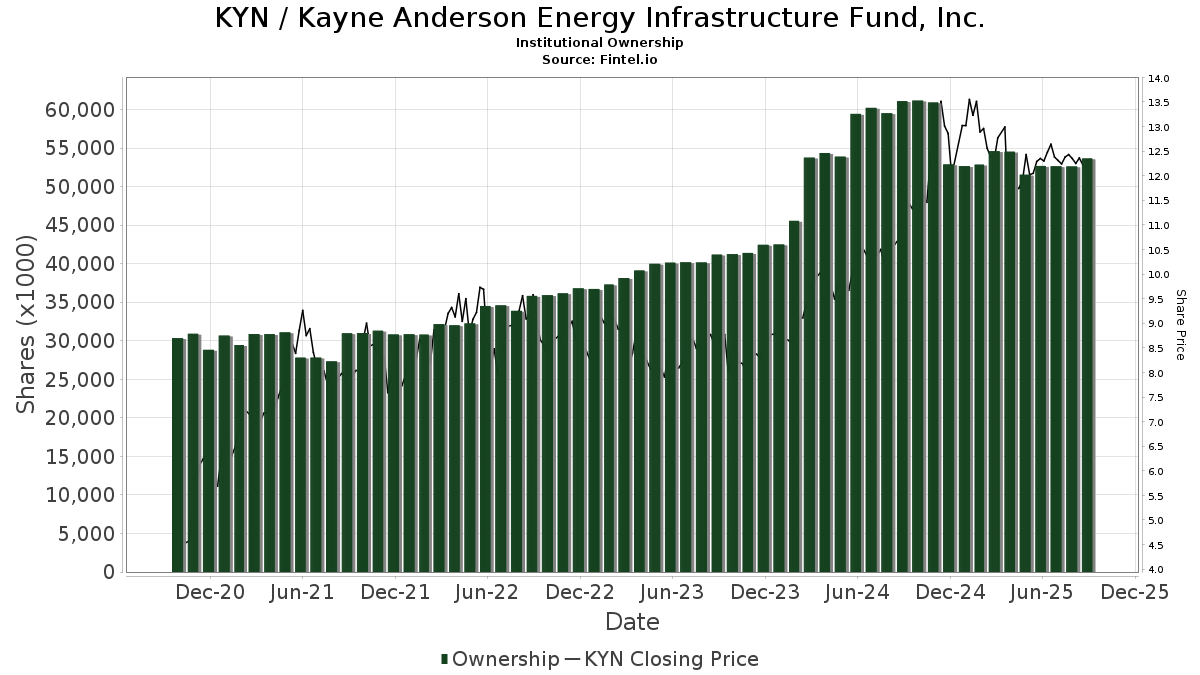
Institutionellt ägande och aktieägare
Kayne Anderson Energy Infrastructure Fund, Inc. (US:KYN) har 263 Institutionella ägare och aktieägare som har lämnat in 13D/G- eller 13F-formulär till Securities Exchange Commission (SEC). Dessa institut innehar totalt 53,647,277 aktier. Största aktieägare inkluderar Morgan Stanley, Cetera Investment Advisers, Bank Of America Corp /de/, Wells Fargo & Company/mn, Raymond James Financial Inc, Royal Bank Of Canada, Advisors Asset Management, Inc., UBS Group AG, Pathstone Holdings, LLC, and Stifel Financial Corp .
Kayne Anderson Energy Infrastructure Fund, Inc. (NYSE:KYN) Institutionell ägarstruktur visar institutioners och fonders nuvarande positioner i företaget, samt de senaste förändringarna i positionernas storlek. Större aktieägare kan vara enskilda investerare, fonder, hedgefonder eller institutioner. Bilaga 13D visar att investeraren äger (eller ägde) mer än 5% av företaget och avser (eller avsåg) att aktivt eftersträva en förändring av affärsstrategin. Schedule 13G indikerar en passiv investering på över 5%.
The share price as of September 8, 2025 is 12,22 / share. Previously, on September 9, 2024, the share price was 10,71 / share. This represents an increase of 14,10% over that period.
Fondsentimentets poäng
Fondsentimentet poängen(fka Ägarackumulation-poäng) visar vilka aktier som är mest köpta av fonder. Det är resultatet av en sofistikerad kvantitativ flerfaktormodell som identifierar företag med de högsta nivåerna av institutionell ackumulering. Poängsättningsmodellen använder en kombination av den totala ökningen av redovisade ägare, förändringarna i portföljallokeringarna för dessa ägare och andra mått. Siffran sträcker sig från 0 till 100, där högre siffror indikerar en högre nivå av ackumulering i förhållande till sina konkurrenter, och 50 är genomsnittet.
Uppdateringsfrekvens: Dagligen
Se Ownership Explorer, som innehåller en lista över de högst rankade företagen.
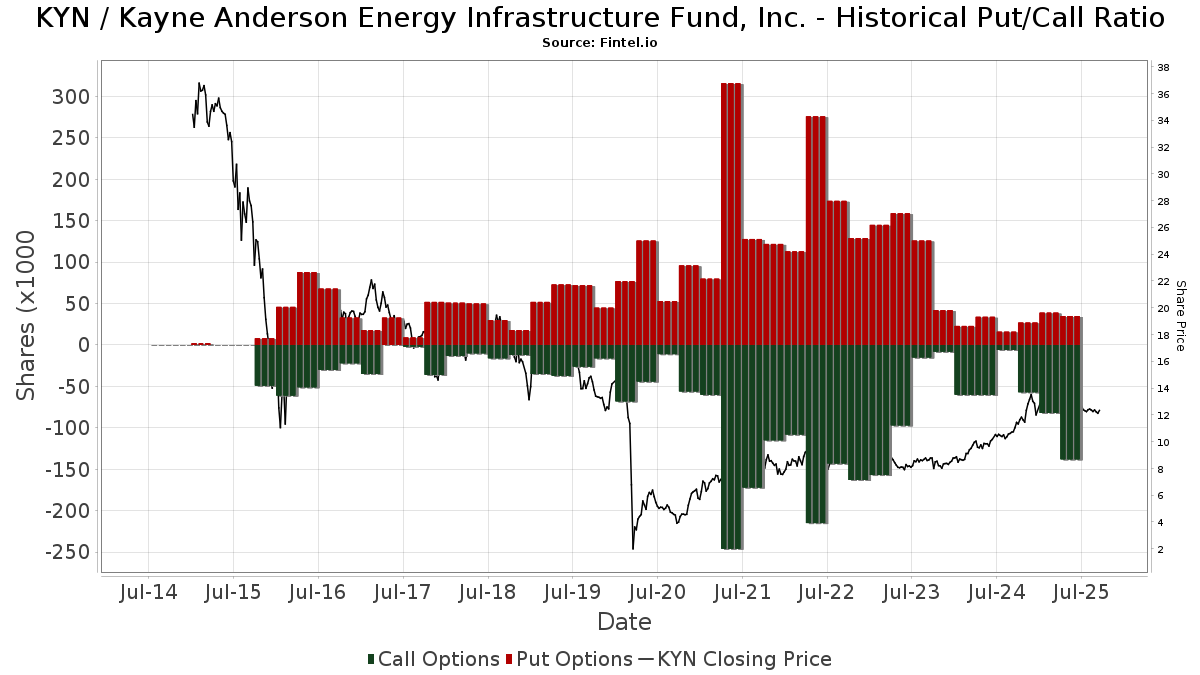
Institutionell sälj/köp-kvot
Förutom att rapportera vanliga eget kapital- och skuldemissioner måste institutioner med mer än 100MM tillgångar under förvaltning också avslöja sina innehav av sälj- och köpoptioner. Eftersom säljoptioner i allmänhet indikerar ett negativt sentiment och köpoptioner indikerar ett positivt sentiment, kan vi få en uppfattning om det övergripande institutionella sentimentet genom att plotta förhållandet mellan säljoptioner och köpoptioner. Diagrammet till höger visar det historiska förhållandet mellan sälj- och köpoptioner för detta instrument.
Genom att använda sälj/köp-kvoten som en indikator på aktieägarnas sentiment undviker man en av de största bristerna med att använda det totala institutionella ägandet, nämligen att en betydande del av de förvaltade tillgångarna investeras passivt för att följa index. Passivt förvaltade fonder köper vanligtvis inte optioner, så indikatorn för sälj/köp-kvoten ger en bättre bild av stämningen i aktivt förvaltade fonder.
13D/G-Arkiveringar
Vi presenterar 13D/G-arkiveringar separat från 13F-arkiveringar på grund av att de behandlas olika av SEC. 13D/G-arkiveringar kan lämnas in av grupper av investerare (med en ledare), medan 13F-arkiveringar inte kan det. Detta leder till situationer där en investerare kan lämna in en 13D/G-ansökan med ett värde för de totala aktierna (vilket motsvarar alla aktier som ägs av investerargruppen), men sedan lämna in en 13F-ansökan med ett annat värde för de totala aktierna (vilket motsvarar enbart deras eget ägande). Detta innebär att aktieägandet i 13D/G-arkiveringar och 13F-arkiveringar ofta inte är direkt jämförbara, så vi presenterar dem separat.
Notera: Från och med den 16 maj 2021 visar vi inte längre ägare som inte har lämnat in en 13D/G under det senaste året. Tidigare visade vi hela historiken för 13D/G-arkiveringar. I allmänhet måste enheter som är skyldiga att lämna in 13D/G-arkiveringar lämna in minst en gång per år innan de lämnar in en stängningsarkivering. Fonder avslutar dock ibland positioner utan att lämna in en avslutande arkivering (dvs. de avvecklar), så att visa hela historiken resulterade ibland i förvirring om det nuvarande ägandet. För att förhindra förvirring visar vi nu endast "nuvarande" ägare - det vill säga ägare som har lämnat in en ansökan under det senaste året.
Upgrade to unlock premium data.
| Fil Datum | Formulär | Investerare | Föregående aktier |
Senaste aktier |
Δ Aktier (Procent) |
Ägande (Procent) |
Δ Ägande (Procent) |
|
|---|---|---|---|---|---|---|---|---|
| 2024-11-14 | Voya Financial, Inc. | 2,520,000 | 507,541 | -79.86 | 6.90 | -67.14 | ||
| 2024-11-14 | GUARDIAN LIFE INSURANCE CO OF AMERICA | 440,000 | 440,000 | 0.00 | 7.20 | -27.27 | ||
| 2024-11-13 | PRINCIPAL LIFE INSURANCE CO | 646,973 | 766,973 | 18.55 | 11.80 | -18.62 | ||
| 2024-11-08 | MetLife Investment Management, LLC | 1,208,000 | 1,168,000 | -3.31 | 17.90 | -9.14 |
13F- och NPORT-arkiveringar
Detaljer om 13F-arkiveringar är gratis. Detaljer om NP-arkiveringar kräver ett premiummedlemskap. Gröna rader indikerar nya positioner. Röda rader indikerar stängda positioner. Klicka på länk symbolen för att se hela transaktionshistoriken.
Uppgradera
för att låsa upp premiumdata och exportera till Excel ![]() .
.
| Fil Datum | Källa | Investerare | Typ | Genomsnittligt pris (beräknat) |
Aktier | Δ Aktier (%) |
Rapporterat värde (1000 USD) |
Δ Värde (%) |
Portföljallokering (%) |
|
|---|---|---|---|---|---|---|---|---|---|---|
| 2025-07-31 | 13F | Oppenheimer & Co Inc | 263 864 | 18,24 | 3 356 | 17,22 | ||||
| 2025-08-19 | 13F | National Asset Management, Inc. | 109 365 | −3,93 | 1 391 | −3,94 | ||||
| 2025-08-13 | 13F | Invesco Ltd. | 124 495 | −7,60 | 1 584 | −8,39 | ||||
| 2025-08-18 | 13F | Hollencrest Capital Management | 20 380 | 0,00 | 259 | −0,77 | ||||
| 2025-08-06 | 13F | North Capital, Inc. | 18 119 | −0,92 | 230 | −1,71 | ||||
| 2025-08-11 | 13F | NewEdge Wealth, LLC | 25 100 | −37,60 | 315 | −39,15 | ||||
| 2025-08-04 | 13F | Spire Wealth Management | 902 | 0,00 | 11 | 0,00 | ||||
| 2025-07-24 | 13F | IFP Advisors, Inc | 1 456 | 8,74 | 19 | 5,88 | ||||
| 2025-07-30 | 13F | Cullen/frost Bankers, Inc. | 21 905 | 1,98 | 279 | 1,09 | ||||
| 2025-08-12 | 13F | FourThought Financial Partners, LLC | 197 826 | 7,67 | 2 516 | 6,75 | ||||
| 2025-08-14 | 13F | Group One Trading, L.p. | Call | 57 300 | 223,73 | 729 | 220,70 | |||
| 2025-07-29 | 13F | Chicago Partners Investment Group LLC | 26 872 | 1,30 | 329 | 3,80 | ||||
| 2025-08-14 | 13F | Comerica Bank | 118 486 | −5,22 | 1 507 | −5,99 | ||||
| 2025-08-04 | 13F | Wolverine Asset Management Llc | 6 150 | −96,78 | 78 | −96,82 | ||||
| 2025-08-14 | 13F | Group One Trading, L.p. | Put | 300 | 0,00 | 4 | 0,00 | |||
| 2025-08-15 | 13F | Morgan Stanley | 9 723 496 | 3,27 | 123 683 | 2,38 | ||||
| 2025-08-01 | 13F | Envestnet Asset Management Inc | 61 298 | −0,23 | 780 | −1,14 | ||||
| 2025-07-16 | 13F | Independent Wealth Network Inc. | 103 390 | −0,09 | 1 315 | −0,90 | ||||
| 2025-08-07 | 13F | Parkside Financial Bank & Trust | 2 595 | 33 | ||||||
| 2025-08-25 | NP | MDCEX - Matisse Discounted Closed-End Fund Strategy Institutional Class Shares | 150 000 | 93,74 | 1 908 | 181,00 | ||||
| 2025-07-28 | 13F | Mutual Advisors, LLC | 47 496 | 0,02 | 579 | 2,48 | ||||
| 2025-08-12 | 13F | LPL Financial LLC | 580 792 | 79,32 | 7 388 | 77,79 | ||||
| 2025-08-14 | 13F | Herold Advisors, Inc. | 31 800 | 404 | ||||||
| 2025-08-07 | 13F | Commerce Bank | 66 142 | 9,07 | 841 | 8,10 | ||||
| 2025-05-14 | 13F | South Plains Financial, Inc. | 0 | −100,00 | 0 | |||||
| 2025-08-11 | 13F | Principal Securities, Inc. | 3 775 | 0,00 | 48 | 2,13 | ||||
| 2025-07-28 | 13F | Axxcess Wealth Management, Llc | 10 220 | −22,69 | 130 | −23,67 | ||||
| 2025-08-21 | NP | LUSIX - Lazard US Systematic Small Cap Equity Portfolio Institutional Shares | 11 114 | −3,47 | 141 | −4,08 | ||||
| 2025-08-13 | 13F | Collar Capital Management, LLC | 118 917 | −1,16 | 1 513 | −2,01 | ||||
| 2025-07-30 | 13F | D.a. Davidson & Co. | 25 623 | 3,54 | 326 | 2,52 | ||||
| 2025-08-05 | 13F | Welch & Forbes Llc | 0 | −100,00 | 0 | |||||
| 2025-08-08 | 13F | Calamos Advisors LLC | 31 505 | −24,32 | 401 | −25,09 | ||||
| 2025-08-14 | 13F | Raymond James Financial Inc | 2 609 694 | −2,51 | 33 195 | −3,35 | ||||
| 2025-07-25 | NP | FCEF - First Trust CEF Income Opportunity ETF This fund is a listed as child fund of First Trust Advisors Lp and if that institution has disclosed ownership in this security, then these positions will not be double counted when calculating total shares and total value | 45 379 | 10,81 | 552 | 5,56 | ||||
| 2025-07-22 | 13F | DAVENPORT & Co LLC | 14 310 | 14,49 | 182 | 13,75 | ||||
| 2025-08-07 | 13F | BHK Investment Advisors, LLC | 33 500 | 8,06 | 426 | 7,30 | ||||
| 2025-07-18 | 13F | Truist Financial Corp | 53 631 | −2,23 | 682 | −2,99 | ||||
| 2025-08-14 | 13F | Saba Capital Management, L.P. | 32 266 | 410 | ||||||
| 2025-04-14 | 13F | Griffith & Werner, Inc. | 16 173 | 0,00 | 208 | 0,98 | ||||
| 2025-08-05 | 13F | Carolinas Wealth Consulting Llc | 0 | −100,00 | 0 | −100,00 | ||||
| 2025-05-02 | 13F | Whittier Trust Co | 0 | −100,00 | 0 | |||||
| 2025-08-05 | 13F | Bridgewater Advisors Inc. | 191 283 | 0,00 | 2 351 | 2,66 | ||||
| 2025-08-28 | NP | Cohen & Steers Closed-end Opportunity Fund, Inc. | 88 000 | 0,00 | 1 119 | −0,89 | ||||
| 2025-05-05 | 13F | Eagle Bay Advisors LLC | 0 | −100,00 | 0 | |||||
| 2025-08-11 | 13F | Private Advisor Group, LLC | 14 739 | 0,00 | 187 | −1,06 | ||||
| 2025-07-22 | 13F | Chung Wu Investment Group, LLC | 719 | 9 | ||||||
| 2025-08-05 | 13F | Blue Barn Wealth, LLC | 0 | −100,00 | 0 | −100,00 | ||||
| 2025-08-14 | 13F | Polar Asset Management Partners Inc. | 390 812 | 373,12 | 4 971 | 369,41 | ||||
| 2025-06-27 | NP | Calamos ETF Trust - Calamos CEF Income & Arbitrage ETF | 31 505 | −46,13 | 370 | −52,87 | ||||
| 2025-08-13 | 13F | Cresset Asset Management, LLC | 12 931 | 164 | ||||||
| 2025-08-08 | 13F | Beck Bode, LLC | 11 665 | −36,66 | 148 | −37,29 | ||||
| 2025-08-13 | 13F | Cary Street Partners Financial Llc | 20 808 | 30,83 | 265 | 29,41 | ||||
| 2025-08-04 | 13F | Pinnacle Associates Ltd | 26 631 | −0,33 | 339 | −1,17 | ||||
| 2025-08-18 | 13F/A | National Bank Of Canada /fi/ | 6 000 | 0,00 | 76 | 0,00 | ||||
| 2025-07-29 | 13F | Salomon & Ludwin, LLC | 1 650 | 0,00 | 21 | −4,76 | ||||
| 2025-08-08 | 13F | Good Life Advisors, LLC | 56 608 | 2,44 | 720 | 1,69 | ||||
| 2025-08-14 | 13F | Millennium Management Llc | 0 | −100,00 | 0 | |||||
| 2025-08-08 | 13F | Cornerstone Advisors, LLC | 205 708 | 109,46 | 2 617 | 107,62 | ||||
| 2025-07-30 | 13F | Sanders Morris Harris Llc | 61 200 | 0,00 | 778 | −0,89 | ||||
| 2025-07-30 | 13F | Evermay Wealth Management Llc | 1 266 | 0,00 | 16 | 0,00 | ||||
| 2025-08-14 | 13F | Glenmede Investment Management, LP | 12 904 | 164 | ||||||
| 2025-08-27 | NP | RYDEX VARIABLE TRUST - Multi-Hedge Strategies Fund Variable Annuity | 65 | 0,00 | 1 | |||||
| 2025-08-29 | NP | Felicitas Private Markets Fund | 20 788 | −93,83 | 317 | −5,93 | ||||
| 2025-05-14 | 13F | Group One Trading, L.p. | 0 | −100,00 | 0 | −100,00 | ||||
| 2025-08-14 | 13F | Two Sigma Investments, Lp | 320 354 | 4 075 | ||||||
| 2025-08-15 | 13F | Chapman Financial Group, Llc | 14 602 | −14,12 | 186 | −14,35 | ||||
| 2025-05-01 | 13F | Schechter Investment Advisors, LLC | 0 | −100,00 | 0 | |||||
| 2025-08-14 | 13F | Stansberry Asset Management, Llc | 829 048 | −31,43 | 10 545 | −32,02 | ||||
| 2025-08-22 | NP | Cornerstone Strategic Value Fund Inc | 89 721 | 62,77 | 1 141 | 61,39 | ||||
| 2025-07-10 | 13F | Wealth Enhancement Advisory Services, Llc | 19 796 | −47,66 | 250 | −48,66 | ||||
| 2025-08-11 | 13F | TSP Capital Management Group, LLC | 3 369 | −2,52 | ||||||
| 2025-07-08 | 13F | Hickory Point Bank & Trust | 27 050 | 9,96 | 344 | 9,21 | ||||
| 2025-08-12 | 13F | Fortis Capital Management LLC | 12 434 | 1,98 | 158 | 1,28 | ||||
| 2025-07-16 | 13F | Magnus Financial Group LLC | 219 341 | −0,40 | 2 790 | −1,24 | ||||
| 2025-09-02 | 13F | Pvg Asset Management Corp | 19 200 | 244 | ||||||
| 2025-08-14 | 13F | GWM Advisors LLC | 96 350 | 1 727,93 | 1 226 | 1 728,36 | ||||
| 2025-08-06 | 13F | Golden State Wealth Management, LLC | 903 | 0,22 | 11 | 0,00 | ||||
| 2025-08-12 | 13F | Jpmorgan Chase & Co | 6 883 | 114 616,67 | 88 | |||||
| 2025-08-11 | 13F | Promethium Advisors,llc | 103 150 | 298,26 | 1 312 | 295,18 | ||||
| 2025-08-18 | 13F | Geneos Wealth Management Inc. | 12 234 | 1,58 | 156 | 0,65 | ||||
| 2025-07-15 | 13F | Jeppson Wealth Management, Llc | 78 747 | 4,90 | 1 002 | 3,95 | ||||
| 2025-08-14 | 13F | Cohen & Steers, Inc. | 88 000 | 0,00 | 1 | 0,00 | ||||
| 2025-08-12 | 13F | Waterloo Capital, L.P. | 19 671 | 0,73 | 250 | 0,00 | ||||
| 2025-07-30 | 13F | Schnieders Capital Management Llc | 10 015 | 0,03 | 127 | −0,78 | ||||
| 2025-07-08 | 13F | Parallel Advisors, LLC | 13 500 | 45,16 | 172 | 43,70 | ||||
| 2025-07-14 | 13F | AdvisorNet Financial, Inc | 9 | 12,50 | 0 | |||||
| 2025-07-25 | 13F | Tranquility Partners, LLC | 16 117 | 0,00 | 205 | −0,49 | ||||
| 2025-08-19 | 13F | Advisory Services Network, LLC | 24 800 | −1,98 | 309 | −4,94 | ||||
| 2025-08-12 | 13F | SRS Capital Advisors, Inc. | 2 667 | 34 | ||||||
| 2025-08-19 | 13F | Anchor Investment Management, LLC | 900 | 0,00 | 11 | 0,00 | ||||
| 2025-07-30 | 13F | Whittier Trust Co Of Nevada Inc | 0 | −100,00 | 0 | |||||
| 2025-08-11 | 13F | Rothschild Investment Llc | 1 177 | 0,00 | 15 | −6,67 | ||||
| 2025-08-05 | 13F | Westside Investment Management, Inc. | 422 | 0,00 | 5 | 0,00 | ||||
| 2025-07-14 | 13F | Wealth Advisory Solutions, LLC | 224 150 | 44,47 | 2 851 | 43,27 | ||||
| 2025-08-14 | 13F/A | Rockefeller Capital Management L.P. | 184 458 | 8,98 | 2 346 | 8,06 | ||||
| 2025-04-17 | 13F | Bayshore Asset Management, Llc | 0 | −100,00 | 0 | |||||
| 2025-07-30 | 13F | Princeton Global Asset Management LLC | 22 500 | −1,53 | 286 | −2,39 | ||||
| 2025-08-12 | 13F | Park Square Financial Group, LLC | 771 | −25,94 | 10 | −30,77 | ||||
| 2025-08-13 | 13F | Northern Trust Corp | 67 529 | −7,16 | 859 | −8,04 | ||||
| 2025-07-09 | 13F | Post Resch Tallon Group Inc. | 75 728 | 4,04 | 963 | 2,77 | ||||
| 2025-07-22 | 13F | JSF Financial, LLC | 10 795 | 1,70 | 137 | 0,74 | ||||
| 2025-08-12 | 13F | Advisors Asset Management, Inc. | 1 973 450 | −4,19 | 25 102 | −5,01 | ||||
| 2025-08-11 | 13F/A | Kayne Anderson Capital Advisors Lp | 808 748 | −49,90 | 10 287 | −50,29 | ||||
| 2025-08-11 | 13F | Nations Financial Group Inc, /ia/ /adv | 26 993 | 0,00 | 343 | −0,87 | ||||
| 2025-08-13 | 13F | Truvestments Capital Llc | 68 | 0,00 | 1 | |||||
| 2025-08-14 | 13F | Css Llc/il | 30 249 | 153,55 | 385 | 150,98 | ||||
| 2025-08-14 | 13F | Operose Advisors LLC | 38 146 | 0,00 | 485 | −0,82 | ||||
| 2025-08-27 | NP | RYMSX - Guggenheim Multi-Hedge Strategies Fund Class P | 38 | −22,45 | 0 | |||||
| 2025-07-30 | 13F | Cornerstone Advisory, LLC | 47 969 | −7,76 | 610 | −0,16 | ||||
| 2025-08-12 | 13F | Steward Partners Investment Advisory, Llc | 47 565 | −0,45 | 605 | −1,31 | ||||
| 2025-07-11 | 13F | Rockwood Wealth Management, LLC | 12 531 | 0,00 | 159 | −0,62 | ||||
| 2025-09-09 | 13F | NWF Advisory Services Inc. | 324 294 | 1,29 | 4 125 | 0,44 | ||||
| 2025-08-14 | 13F | Citadel Advisors Llc | Call | 18 700 | 1 458,33 | 238 | 1 480,00 | |||
| 2025-08-14 | 13F | Citadel Advisors Llc | 14 895 | −57,58 | 189 | −58,00 | ||||
| 2025-08-14 | 13F | Citadel Advisors Llc | Put | 17 900 | −35,61 | 228 | −36,24 | |||
| 2025-08-04 | 13F | Terril Brothers, Inc. | 1 066 750 | 133,04 | 13 570 | −76,90 | ||||
| 2025-08-12 | 13F | Leigh Baldwin & Co., Llc | 24 221 | −0,30 | 308 | −0,96 | ||||
| 2025-08-12 | 13F | BlackRock, Inc. | 22 402 | 317,79 | 285 | 317,65 | ||||
| 2025-08-06 | 13F | Moors & Cabot, Inc. | 31 729 | 0,00 | 404 | −0,98 | ||||
| 2025-08-13 | 13F | Walleye Capital LLC | 54 063 | −12,94 | 688 | −13,69 | ||||
| 2025-08-07 | 13F | Nwam Llc | 25 537 | 2,32 | 316 | −1,25 | ||||
| 2025-08-08 | 13F | City Of London Investment Management Co Ltd | 343 155 | 508,44 | 4 365 | 503,60 | ||||
| 2025-08-11 | 13F | Mosaic Family Wealth Partners, Llc | 10 576 | 0,00 | 135 | −0,74 | ||||
| 2025-08-14 | 13F | Bank Of America Corp /de/ | 4 667 222 | 5,82 | 59 367 | 4,91 | ||||
| 2025-07-17 | 13F | HB Wealth Management, LLC | 122 962 | −2,99 | 1 564 | −3,81 | ||||
| 2025-07-18 | 13F | PFG Investments, LLC | 102 205 | −31,68 | 1 300 | −32,26 | ||||
| 2025-08-11 | 13F | Delta Asset Management Llc/tn | 325 | 0,00 | 4 | 0,00 | ||||
| 2025-07-16 | 13F | ORG Wealth Partners, LLC | 136 031 | 36,82 | 1 711 | 32,74 | ||||
| 2025-07-22 | 13F | Olistico Wealth, LLC | 620 | 0,00 | 8 | 0,00 | ||||
| 2025-08-11 | 13F | Edgemoor Investment Advisors, Inc. | 175 428 | 16,02 | 2 231 | 15,00 | ||||
| 2025-07-24 | 13F | Trust Co Of Toledo Na /oh/ | 359 | 5 | ||||||
| 2025-08-11 | 13F | Pin Oak Investment Advisors Inc | 20 175 | −8,15 | 0 | |||||
| 2025-08-22 | NP | Cornerstone Total Return Fund Inc | 115 987 | 169,19 | 1 475 | 167,21 | ||||
| 2025-07-25 | 13F | Cwm, Llc | 3 646 | 10,25 | 0 | |||||
| 2025-08-14 | 13F | First Foundation Advisors | 33 233 | 0,00 | 423 | −0,94 | ||||
| 2025-08-07 | 13F | Fidelis Capital Partners, LLC | 13 603 | 1,70 | 169 | 6,29 | ||||
| 2025-08-11 | 13F | Platform Technology Partners | 15 176 | −5,45 | 193 | −5,85 | ||||
| 2025-08-13 | 13F | Baker Avenue Asset Management, LP | 56 800 | 722 | ||||||
| 2025-07-10 | 13F | Secure Asset Management, LLC | 89 448 | 0,00 | 1 138 | −0,87 | ||||
| 2025-07-23 | 13F | Matisse Capital | 222 839 | 2 835 | ||||||
| 2025-08-05 | 13F | Wellington Shields Capital Management, LLC | 2 220 | 0,00 | 28 | 0,00 | ||||
| 2025-08-12 | 13F | Bokf, Na | 0 | −100,00 | 0 | |||||
| 2025-07-31 | 13F | Cambridge Investment Research Advisors, Inc. | 139 519 | −45,45 | 2 | −66,67 | ||||
| 2025-07-28 | 13F | IFC Advisors LLC | 21 354 | 272 | ||||||
| 2025-08-04 | 13F | Creative Financial Designs Inc /adv | 1 819 | 0,00 | 23 | 0,00 | ||||
| 2025-04-24 | 13F | Decker Retirement Planning Inc. | 0 | −100,00 | 0 | |||||
| 2025-08-13 | 13F | Garner Asset Management Corp | 283 823 | −2,36 | 3 610 | −3,19 | ||||
| 2025-08-14 | 13F | Susquehanna International Group, Llp | Call | 39 000 | −27,64 | 496 | −28,22 | |||
| 2025-08-07 | 13F | Sollinda Capital Management LLC | 10 000 | 0,00 | 127 | −0,78 | ||||
| 2025-08-14 | 13F | Susquehanna International Group, Llp | Put | 14 400 | 183 | |||||
| 2025-07-17 | 13F | Sonora Investment Management Group, LLC | 55 025 | 1,48 | 700 | 0,58 | ||||
| 2025-08-13 | 13F | Baird Financial Group, Inc. | 46 014 | 13,47 | 585 | 12,50 | ||||
| 2025-08-11 | 13F | FSA Wealth Management LLC | 3 100 | 0,00 | 39 | 0,00 | ||||
| 2025-08-14 | 13F | Monetary Management Group Inc | 48 250 | −4,93 | 614 | −5,84 | ||||
| 2025-07-18 | 13F | SOA Wealth Advisors, LLC. | 76 | 1,33 | 1 | |||||
| 2025-05-09 | 13F | Powell Investment Advisors, LLC | 0 | −100,00 | 0 | |||||
| 2025-07-24 | NP | CEFS - Saba Closed-End Funds ETF | 3 621 | 79,17 | 44 | 62,96 | ||||
| 2025-07-29 | 13F | Koshinski Asset Management, Inc. | 44 773 | 0,00 | 570 | −0,87 | ||||
| 2025-05-13 | 13F | Thrivent Financial For Lutherans | 0 | −100,00 | 0 | |||||
| 2025-08-04 | 13F | Bay Colony Advisory Group, Inc d/b/a Bay Colony Advisors | 19 284 | 2,57 | 245 | 1,24 | ||||
| 2025-08-13 | 13F | Guggenheim Capital Llc | 290 520 | −26,96 | 3 695 | −27,59 | ||||
| 2025-07-24 | 13F | Mengis Capital Management, Inc. | 0 | −100,00 | 0 | |||||
| 2025-08-08 | 13F | Hartland & Co., LLC | 2 350 | 0,00 | 30 | −3,33 | ||||
| 2025-08-07 | 13F | Atala Financial Inc | 31 586 | −10,61 | 402 | −11,48 | ||||
| 2025-07-23 | 13F | Eagle Rock Investment Company, Llc | 10 721 | 0,00 | 136 | −0,73 | ||||
| 2025-04-01 | 13F | Massmutual Trust Co Fsb/adv | 0 | −100,00 | 0 | |||||
| 2025-08-05 | 13F | Huntington National Bank | 0 | |||||||
| 2025-07-17 | 13F | Janney Montgomery Scott LLC | 106 885 | −1,85 | 1 | 0,00 | ||||
| 2025-08-13 | 13F | Brown Advisory Inc | 8 229 | 105 | ||||||
| 2025-08-12 | 13F | Horizon Kinetics Asset Management Llc | 0 | −100,00 | 0 | |||||
| 2025-07-25 | 13F | Johnson Investment Counsel Inc | 40 130 | 0,63 | 510 | −0,20 | ||||
| 2025-08-06 | 13F | Commonwealth Equity Services, Llc | 160 187 | 12,60 | 2 | 100,00 | ||||
| 2025-08-13 | 13F | StoneX Group Inc. | 34 013 | 38,29 | 433 | 37,14 | ||||
| 2025-08-01 | 13F | Motco | 2 446 | 30 | ||||||
| 2025-07-16 | 13F | Cadent Capital Advisors, LLC | 626 751 | −29,43 | 7 972 | −30,03 | ||||
| 2025-08-14 | 13F | Leisure Capital Management | 23 290 | 0,00 | 296 | −0,67 | ||||
| 2025-08-06 | 13F | Prospera Financial Services Inc | 175 275 | 1,37 | 2 230 | 0,50 | ||||
| 2025-08-14 | 13F | Quantedge Capital Pte Ltd | 234 594 | 20,00 | 2 984 | 18,98 | ||||
| 2025-08-07 | 13F | HighPoint Advisor Group LLC | 0 | −100,00 | 0 | |||||
| 2025-05-15 | 13F | Glenmede Trust Co Na | 12 902 | −2,62 | 166 | −1,79 | ||||
| 2025-08-14 | 13F | Wetherby Asset Management Inc | 83 672 | 20,81 | 1 064 | 20,91 | ||||
| 2025-07-24 | 13F | Us Bancorp \de\ | 52 537 | 0,00 | 668 | −0,89 | ||||
| 2025-08-13 | 13F | Aristides Capital LLC | 91 134 | 0,00 | 1 159 | −0,86 | ||||
| 2025-08-14 | 13F | Sit Investment Associates Inc | 46 967 | −42,70 | 1 | −100,00 | ||||
| 2025-08-08 | 13F | Tanglewood Legacy Advisors, LLC | 3 338 | 0,00 | 42 | 0,00 | ||||
| 2025-07-31 | 13F | Whipplewood Advisors, LLC | 22 966 | 43 232,08 | 292 | −0,68 | ||||
| 2025-08-14 | 13F | Mariner, LLC | 41 257 | 2,50 | 525 | 1,55 | ||||
| 2025-08-14 | 13F | Royal Bank Of Canada | 2 239 061 | −0,11 | 28 482 | −0,97 | ||||
| 2025-07-29 | 13F | First National Bank of Mount Dora, Trust Investment Services | 10 399 | 0,00 | 132 | −0,75 | ||||
| 2025-07-31 | 13F/A | Avion Wealth | 216 | −51,13 | 0 | |||||
| 2025-07-25 | 13F | Concurrent Investment Advisors, LLC | 14 204 | 3,39 | 181 | 2,27 | ||||
| 2025-08-12 | 13F | TCTC Holdings, LLC | 73 205 | 0,00 | 931 | −0,85 | ||||
| 2025-07-07 | 13F | Centurion Wealth Management LLC | 33 024 | −1,13 | 420 | −0,94 | ||||
| 2025-08-14 | 13F | Vivaldi Capital Management, LLC | 22 034 | 73,09 | 280 | 71,78 | ||||
| 2025-08-15 | 13F | Captrust Financial Advisors | 50 476 | 170,50 | 642 | 168,62 | ||||
| 2025-08-15 | 13F | Kestra Advisory Services, LLC | 22 959 | 4,31 | 292 | 3,55 | ||||
| 2025-07-25 | 13F | Apollon Wealth Management, LLC | 12 377 | 0,00 | 157 | −0,63 | ||||
| 2025-08-07 | 13F | Samalin Investment Counsel, LLC | 0 | −100,00 | 0 | |||||
| 2025-08-14 | 13F | Lazard Asset Management Llc | 121 886 | 1,98 | 2 | 0,00 | ||||
| 2025-08-13 | 13F | Cerity Partners LLC | 22 613 | 1,30 | 288 | 0,35 | ||||
| 2025-08-11 | 13F | Brown Brothers Harriman & Co | 216 | 0,00 | 3 | 0,00 | ||||
| 2025-09-04 | 13F/A | Advisor Group Holdings, Inc. | 821 883 | −0,80 | 10 454 | −1,65 | ||||
| 2025-08-12 | 13F | MAI Capital Management | 5 271 | 0,00 | 67 | 0,00 | ||||
| 2025-07-08 | 13F | Nbc Securities, Inc. | 2 165 | −0,60 | 0 | |||||
| 2025-07-28 | 13F | RFG Advisory, LLC | 208 001 | 22,25 | 2 646 | 21,16 | ||||
| 2025-08-19 | 13F | Asset Dedication, LLC | 254 | 0,00 | 3 | 0,00 | ||||
| 2025-05-14 | 13F | BOK Financial Private Wealth, Inc. | 0 | −100,00 | 0 | |||||
| 2025-08-13 | 13F | Cary Street Partner Investment Advisory Llc | 1 000 | 0,00 | 13 | 0,00 | ||||
| 2025-07-29 | 13F | Stratos Wealth Advisors, LLC | 35 852 | −12,49 | 456 | −13,14 | ||||
| 2025-07-17 | 13F | Guyasuta Investment Advisors Inc | 22 200 | 0,00 | 282 | −0,70 | ||||
| 2025-08-14 | 13F | Cura Wealth Advisors, Llc | 79 047 | 0,01 | 1 005 | −0,89 | ||||
| 2025-08-12 | 13F | Pathstone Holdings, LLC | 1 353 935 | 1,09 | 17 222 | 0,38 | ||||
| 2025-08-13 | 13F | Summit Financial, LLC | 461 001 | 44,04 | 5 864 | 42,79 | ||||
| 2025-08-14 | 13F | Zimmer Partners, LP | 100 000 | 1 272 | ||||||
| 2025-08-01 | 13F | Chilton Capital Management Llc | 7 000 | 0,00 | 89 | 0,00 | ||||
| 2025-08-14 | 13F | Hilltop Holdings Inc. | 49 628 | −6,13 | 631 | −6,93 | ||||
| 2025-04-29 | 13F | Penserra Capital Management LLC | 0 | −100,00 | 0 | |||||
| 2025-08-08 | 13F | Meridian Wealth Management, LLC | 343 290 | −1,14 | 4 367 | −2,00 | ||||
| 2025-07-01 | 13F | Harbor Investment Advisory, Llc | 1 209 | 0,00 | 15 | 0,00 | ||||
| 2025-08-11 | 13F | HighTower Advisors, LLC | 323 520 | −5,45 | 4 115 | −6,26 | ||||
| 2025-07-10 | 13F | Global Financial Private Client, LLC | 0 | −100,00 | 0 | |||||
| 2025-07-16 | 13F | ORG Partners LLC | 430 | 0,00 | 5 | 0,00 | ||||
| 2025-07-21 | 13F | Ameritas Advisory Services, LLC | 2 423 | −81,29 | 31 | −81,71 | ||||
| 2025-07-17 | 13F | Eagle Bluffs Wealth Management LLC | 22 378 | 0,00 | 285 | −1,05 | ||||
| 2025-07-18 | 13F | Parkside Investments, LLC | 18 450 | −48,40 | 235 | −48,91 | ||||
| 2025-08-14 | 13F | Ariadne Wealth Management, LP | 21 302 | 0,00 | 263 | 1,94 | ||||
| 2025-08-14 | 13F | Mercer Global Advisors Inc /adv | 18 258 | 232 | ||||||
| 2025-08-13 | 13F | Thomas J. Herzfeld Advisors, Inc. | 292 877 | −13,13 | 3 725 | −13,87 | ||||
| 2025-05-15 | 13F | Buckingham Strategic Partners | 0 | −100,00 | 0 | |||||
| 2025-07-23 | 13F | Pure Portfolios Holdings Llc | 32 051 | 1,70 | 408 | 0,74 | ||||
| 2025-08-04 | 13F | WNY Asset Management, LLC | 186 772 | −40,96 | 2 376 | −41,47 | ||||
| 2025-08-05 | 13F | Wellington Shields & Co., LLC | 10 625 | 23,19 | 135 | 22,73 | ||||
| 2025-04-21 | 13F | Means Investment Co., Inc. | 0 | −100,00 | 0 | |||||
| 2025-07-11 | 13F | Grant Private Wealth Management Inc | 16 173 | 206 | ||||||
| 2025-08-14 | 13F | Sunbelt Securities, Inc. | 1 823 | 0,00 | 23 | 0,00 | ||||
| 2025-08-08 | 13F | Larson Financial Group LLC | 386 | 0,00 | 5 | 0,00 | ||||
| 2025-08-27 | NP | HCINX - The Institutional International Equity Portfolio HC Strategic Shares | 105 253 | 1 339 | ||||||
| 2025-07-23 | 13F | Stonegate Investment Group, LLC | 75 429 | 532,85 | 959 | 530,92 | ||||
| 2025-07-17 | 13F | Sound Income Strategies, LLC | 575 | 0,00 | 7 | 0,00 | ||||
| 2025-08-06 | 13F | Csenge Advisory Group | 15 415 | 0,11 | 187 | 3,89 | ||||
| 2025-08-12 | 13F | Journey Strategic Wealth Llc | 20 871 | 265 | ||||||
| 2025-08-13 | 13F | Rsm Us Wealth Management Llc | 31 627 | −2,37 | 402 | −3,13 | ||||
| 2025-08-07 | 13F | Kestra Private Wealth Services, Llc | 139 828 | 4,58 | 1 779 | 3,67 | ||||
| 2025-08-13 | 13F | WealthTrust Axiom LLC | 14 000 | 178 | ||||||
| 2025-07-14 | 13F | Argentarii, LLC | 31 674 | 0,00 | 403 | −0,99 | ||||
| 2025-07-28 | 13F | BRYN MAWR TRUST Co | 1 000 | −19,29 | 13 | −20,00 | ||||
| 2025-08-14 | 13F | Visionary Wealth Advisors | 329 262 | 10,65 | 4 188 | 9,72 | ||||
| 2025-08-15 | 13F | Tower Research Capital LLC (TRC) | 207 | 1 193,75 | 3 | |||||
| 2025-07-28 | 13F | Harbour Investments, Inc. | 16 156 | −0,26 | 206 | −0,97 | ||||
| 2025-08-26 | NP | MCTOX - Modern Capital Tactical Opportunities Fund Class A Shares | 71 963 | −67,47 | 915 | −58,67 | ||||
| 2025-05-15 | 13F | Concorde Asset Management, LLC | 25 440 | 26,57 | 287 | 12,16 | ||||
| 2025-07-11 | 13F | Caldwell Securities, Inc | 153 960 | −2,19 | 1 958 | −3,02 | ||||
| 2025-07-21 | 13F | Hilltop National Bank | 380 | 0,00 | 5 | 0,00 | ||||
| 2025-08-14 | 13F | Susquehanna International Group, Llp | 0 | −100,00 | 0 | −100,00 | ||||
| 2025-08-04 | 13F | Flagship Harbor Advisors, Llc | 250 996 | 6,52 | 3 193 | 5,59 | ||||
| 2025-08-14 | 13F/A | Zazove Associates Llc | 485 533 | −18,12 | 6 176 | −18,82 | ||||
| 2025-08-08 | 13F | Creative Planning | 14 227 | −8,11 | 181 | −9,09 | ||||
| 2025-05-05 | 13F | Lindbrook Capital, Llc | 0 | −100,00 | 0 | −100,00 | ||||
| 2025-07-30 | 13F | Journey Advisory Group, LLC | 30 000 | 0,00 | 382 | −0,78 | ||||
| 2025-08-08 | 13F | Advyzon Investment Management, LLC | 19 722 | −27,81 | 251 | −28,57 | ||||
| 2025-08-11 | 13F | Citigroup Inc | 55 | 0,00 | 1 | |||||
| 2025-08-14 | 13F | Wells Fargo & Company/mn | 3 270 193 | 5,89 | 41 597 | 4,98 | ||||
| 2025-07-31 | 13F | Moloney Securities Asset Management, LLC | 93 869 | 6,04 | 1 194 | 5,20 | ||||
| 2025-04-21 | 13F | Nelson, Van Denburg & Campbell Wealth Management Group, LLC | 0 | −100,00 | 0 | |||||
| 2025-08-13 | 13F | First Trust Advisors Lp | 94 074 | 3,73 | 1 197 | 2,84 | ||||
| 2025-08-13 | 13F | Kayne Anderson Rudnick Investment Management Llc | 63 615 | 1,98 | 809 | 1,13 | ||||
| 2025-08-13 | 13F | McGowan Group Asset Management, Inc. | 306 581 | 0,55 | 3 900 | −0,31 | ||||
| 2025-08-13 | 13F | Lido Advisors, LLC | 345 466 | 1,46 | 4 394 | 0,60 | ||||
| 2025-08-08 | 13F | Pnc Financial Services Group, Inc. | 31 510 | −20,46 | 401 | −21,26 | ||||
| 2025-07-21 | 13F | Catalina Capital Group, LLC | 32 592 | 0,00 | 415 | −0,96 | ||||
| 2025-08-05 | 13F | Bard Associates Inc | 69 844 | 4,32 | 888 | 3,38 | ||||
| 2025-08-05 | 13F | Mountain Hill Investment Partners Corp. | 294 | 2,08 | 4 | 0,00 | ||||
| 2025-08-11 | 13F | Traub Capital Management LLC | 1 500 | 19 | ||||||
| 2025-08-05 | 13F | Pointe Capital Management LLC | 17 718 | 0,00 | 225 | −0,88 | ||||
| 2025-08-14 | 13F | UBS Group AG | 1 398 889 | −3,12 | 17 794 | −3,95 | ||||
| 2025-08-08 | 13F | Cetera Investment Advisers | 5 422 353 | −0,56 | 68 972 | −1,41 | ||||
| 2025-08-05 | 13F | Simplex Trading, Llc | Put | 3 100 | −72,57 | 0 | ||||
| 2025-08-05 | 13F | Simplex Trading, Llc | Call | 23 600 | 145,83 | 0 | ||||
| 2025-08-13 | 13F | EverSource Wealth Advisors, LLC | 2 195 | 0,00 | 28 | −3,57 | ||||
| 2025-07-11 | 13F | Farther Finance Advisors, LLC | 26 734 | 490,81 | 340 | 486,21 | ||||
| 2025-08-13 | 13F | Northwestern Mutual Wealth Management Co | 22 261 | −44,00 | 283 | −44,40 | ||||
| 2025-08-05 | 13F | Intellectus Partners, LLC | 13 250 | 0,00 | 169 | −0,59 | ||||
| 2025-08-14 | 13F | CIBC World Markets Inc. | 0 | −100,00 | 0 | |||||
| 2025-08-14 | 13F | Stifel Financial Corp | 1 140 426 | 5,53 | 14 506 | 4,63 | ||||
| 2025-08-12 | 13F | Proequities, Inc. | Put | 0 | 0 | |||||
| 2025-08-12 | 13F | Proequities, Inc. | Call | 0 | 0 | |||||
| 2025-08-12 | 13F | Proequities, Inc. | 0 | 0 | ||||||
| 2025-07-17 | 13F | Camelot Portfolios, LLC | 92 323 | −5,47 | 1 174 | −6,23 | ||||
| 2025-07-29 | 13F | Beverly Hills Private Wealth, LLC | 195 455 | 0,07 | 2 486 | −0,76 | ||||
| 2025-07-17 | 13F | Vermillion Wealth Management, Inc. | 1 142 | 0,00 | 15 | 0,00 | ||||
| 2025-07-25 | 13F | Northwest Capital Management Inc | 2 200 | 0,00 | 28 | −3,57 | ||||
| 2025-08-07 | 13F | 1620 Investment Advisors, Inc. | 100 | 0,00 | 1 | 0,00 | ||||
| 2025-08-14 | 13F | BI Asset Management Fondsmaeglerselskab A/S | 93 008 | 0,65 | 1 | 0,00 | ||||
| 2025-08-12 | 13F | CIBC Private Wealth Group, LLC | 6 930 | 5,48 | 88 | 29,41 | ||||
| 2025-07-24 | 13F | Ronald Blue Trust, Inc. | 285 | 0,00 | 4 | 0,00 | ||||
| 2025-07-16 | 13F | Essex Financial Services, Inc. | 79 000 | 19,74 | 1 005 | 18,68 | ||||
| 2025-08-19 | 13F | Cape Investment Advisory, Inc. | 1 313 | 0,00 | 17 | 0,00 | ||||
| 2025-08-05 | 13F | Mission Wealth Management, Lp | 35 683 | 0,00 | 454 | −0,88 |
Other Listings
| GB:0A1J |