Grundläggande statistik
| Institutionella ägare | 231 total, 230 long only, 0 short only, 1 long/short - change of 8,45% MRQ |
| Genomsnittlig portföljallokering | 0.7283 % - change of −11,97% MRQ |
| Institutionella aktier (lång) | 61 856 294 (ex 13D/G) - change of 3,90MM shares 6,72% MRQ |
| Institutionellt värde (lång) | $ 3 821 083 USD ($1000) |
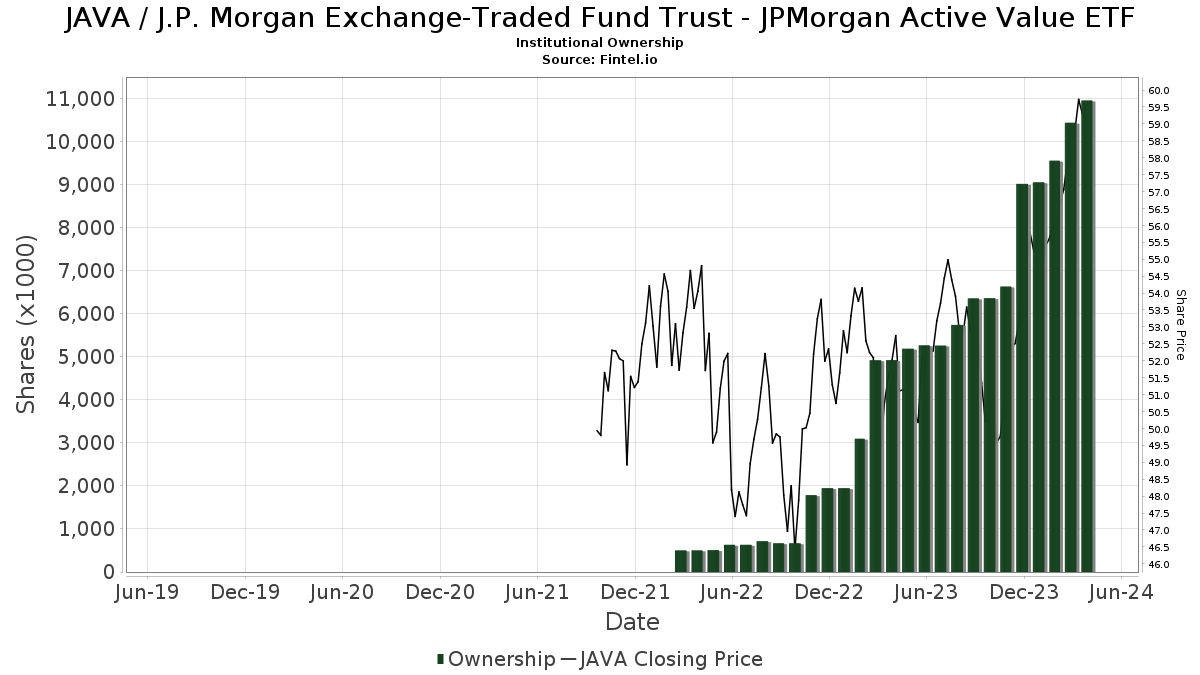
Institutionellt ägande och aktieägare
J.P. Morgan Exchange-Traded Fund Trust - JPMorgan Active Value ETF (US:JAVA) har 231 Institutionella ägare och aktieägare som har lämnat in 13D/G- eller 13F-formulär till Securities Exchange Commission (SEC). Dessa institut innehar totalt 61,856,294 aktier. Största aktieägare inkluderar Jpmorgan Chase & Co, LPL Financial LLC, Sagespring Wealth Partners, Llc, Dynasty Wealth Management, Llc, ADVANCED SERIES TRUST - AST T. Rowe Price Growth Opportunities Portfolio, Advanced Series Trust - Ast J.p. Morgan Strategic Opportunities Portfolio, Ameriprise Financial Inc, ADVANCED SERIES TRUST - AST J.P. Morgan Global Thematic Portfolio, Morgan Stanley, and Janney Montgomery Scott LLC .
J.P. Morgan Exchange-Traded Fund Trust - JPMorgan Active Value ETF (ARCA:JAVA) Institutionell ägarstruktur visar institutioners och fonders nuvarande positioner i företaget, samt de senaste förändringarna i positionernas storlek. Större aktieägare kan vara enskilda investerare, fonder, hedgefonder eller institutioner. Bilaga 13D visar att investeraren äger (eller ägde) mer än 5% av företaget och avser (eller avsåg) att aktivt eftersträva en förändring av affärsstrategin. Schedule 13G indikerar en passiv investering på över 5%.
The share price as of September 8, 2025 is 68,05 / share. Previously, on September 9, 2024, the share price was 61,93 / share. This represents an increase of 9,88% over that period.
Fondsentimentets poäng
Fondsentimentet poängen(fka Ägarackumulation-poäng) visar vilka aktier som är mest köpta av fonder. Det är resultatet av en sofistikerad kvantitativ flerfaktormodell som identifierar företag med de högsta nivåerna av institutionell ackumulering. Poängsättningsmodellen använder en kombination av den totala ökningen av redovisade ägare, förändringarna i portföljallokeringarna för dessa ägare och andra mått. Siffran sträcker sig från 0 till 100, där högre siffror indikerar en högre nivå av ackumulering i förhållande till sina konkurrenter, och 50 är genomsnittet.
Uppdateringsfrekvens: Dagligen
Se Ownership Explorer, som innehåller en lista över de högst rankade företagen.
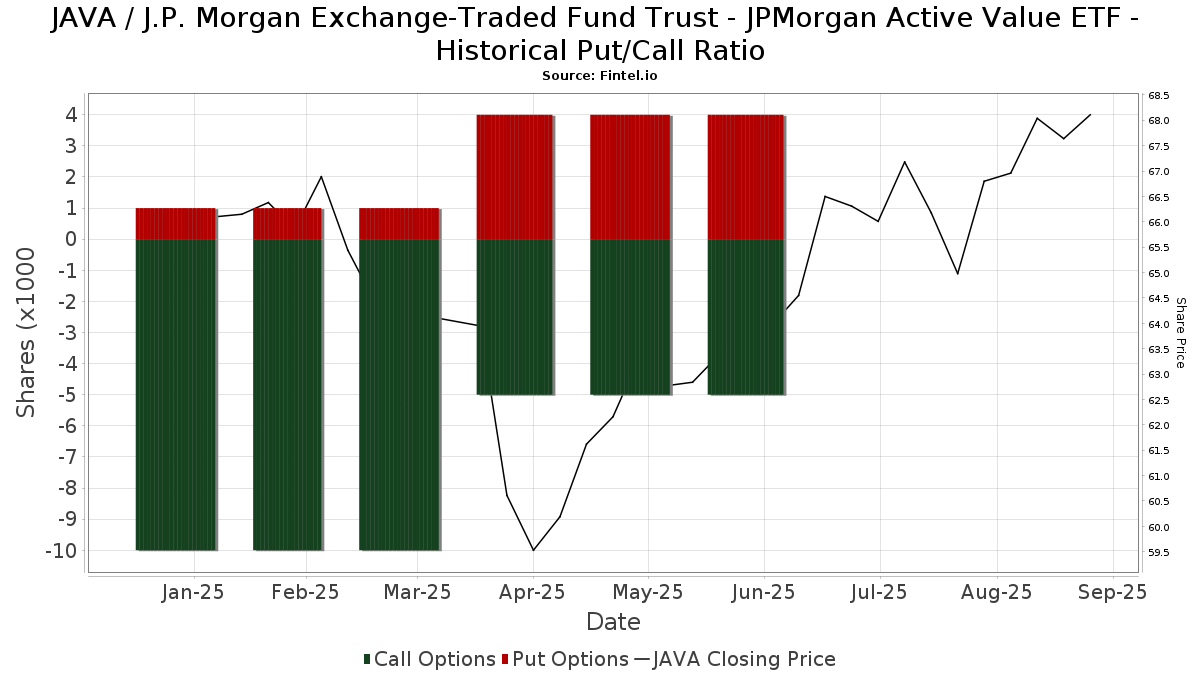
Institutionell sälj/köp-kvot
Förutom att rapportera vanliga eget kapital- och skuldemissioner måste institutioner med mer än 100MM tillgångar under förvaltning också avslöja sina innehav av sälj- och köpoptioner. Eftersom säljoptioner i allmänhet indikerar ett negativt sentiment och köpoptioner indikerar ett positivt sentiment, kan vi få en uppfattning om det övergripande institutionella sentimentet genom att plotta förhållandet mellan säljoptioner och köpoptioner. Diagrammet till höger visar det historiska förhållandet mellan sälj- och köpoptioner för detta instrument.
Genom att använda sälj/köp-kvoten som en indikator på aktieägarnas sentiment undviker man en av de största bristerna med att använda det totala institutionella ägandet, nämligen att en betydande del av de förvaltade tillgångarna investeras passivt för att följa index. Passivt förvaltade fonder köper vanligtvis inte optioner, så indikatorn för sälj/köp-kvoten ger en bättre bild av stämningen i aktivt förvaltade fonder.
13F- och NPORT-arkiveringar
Detaljer om 13F-arkiveringar är gratis. Detaljer om NP-arkiveringar kräver ett premiummedlemskap. Gröna rader indikerar nya positioner. Röda rader indikerar stängda positioner. Klicka på länk symbolen för att se hela transaktionshistoriken.
Uppgradera
för att låsa upp premiumdata och exportera till Excel ![]() .
.
| Fil Datum | Källa | Investerare | Typ | Genomsnittligt pris (beräknat) |
Aktier | Δ Aktier (%) |
Rapporterat värde (1000 USD) |
Δ Värde (%) |
Portföljallokering (%) |
|
|---|---|---|---|---|---|---|---|---|---|---|
| 2025-07-21 | 13F | Fairvoy Private Wealth, LLC | 10 169 | −1,32 | 666 | 1,83 | ||||
| 2025-07-25 | 13F | M.e. Allison & Co., Inc. | 10 365 | −1,44 | 679 | 1,50 | ||||
| 2025-08-11 | 13F | Principal Securities, Inc. | 921 | 145,60 | 60 | 160,87 | ||||
| 2025-08-13 | 13F | Gateway Wealth Partners, LLC | 6 716 | −29,51 | 440 | −27,44 | ||||
| 2025-08-14 | 13F | Benjamin Edwards Inc | 83 618 | 317,26 | 5 477 | 330,24 | ||||
| 2025-08-08 | 13F | Good Life Advisors, LLC | 11 601 | −7,23 | 760 | −4,41 | ||||
| 2025-07-31 | 13F | MN Wealth Advisors, LLC | 119 706 | −3,23 | 7 841 | −0,25 | ||||
| 2025-07-17 | 13F | Worth Financial Advisory Group, LLC | 9 465 | 5,99 | 620 | 9,17 | ||||
| 2025-08-11 | 13F | Private Advisor Group, LLC | 183 071 | 23,33 | 11 991 | 27,14 | ||||
| 2025-08-12 | 13F | Wayfinding Financial, LLC | 16 312 | −3,04 | 1 | 0,00 | ||||
| 2025-08-04 | 13F | Spire Wealth Management | 384 | 7,26 | 25 | 13,64 | ||||
| 2025-07-17 | 13F | Sound Income Strategies, LLC | 63 | 0,00 | 4 | 0,00 | ||||
| 2025-07-14 | 13F | Farmers & Merchants Investments Inc | 239 | 0,00 | 16 | 0,00 | ||||
| 2025-08-13 | 13F | Custom Index Systems, Llc | 7 598 | −5,47 | 498 | −2,55 | ||||
| 2025-05-13 | 13F | Quadrant Capital Group Llc | 0 | −100,00 | 0 | |||||
| 2025-08-29 | 13F | Total Investment Management Inc | 607 | 40 | ||||||
| 2025-07-28 | 13F | Mutual Advisors, LLC | 10 371 | −5,53 | 695 | 3,89 | ||||
| 2025-08-04 | 13F | IFG Advisory, LLC | 15 048 | 20,45 | 986 | 24,21 | ||||
| 2025-07-22 | 13F | DAVENPORT & Co LLC | 88 564 | 6,81 | 5 801 | 10,10 | ||||
| 2025-08-11 | 13F | Landaas & Co /wi /adv | 18 068 | 313,64 | 1 183 | 325,54 | ||||
| 2025-08-12 | 13F | Jpmorgan Chase & Co | 13 865 481 | 3,24 | 908 189 | 6,42 | ||||
| 2025-07-14 | 13F | CRA Financial Services, LLC | 4 061 | 21,73 | 266 | 25,59 | ||||
| 2025-08-11 | 13F | Synergy Investment Management, LLC | 0 | −100,00 | 0 | |||||
| 2025-07-31 | 13F | Oppenheimer & Co Inc | 6 568 | 27,07 | 430 | 31,10 | ||||
| 2025-08-05 | 13F | BCGM Wealth Management, LLC | 149 549 | 10,39 | 9 795 | 13,80 | ||||
| 2025-08-14 | 13F | Atomi Financial Group, Inc. | 23 982 | 1 571 | ||||||
| 2025-08-14 | 13F | Synovus Financial Corp | 44 414 | 28,37 | 2 911 | 32,39 | ||||
| 2025-07-31 | 13F | Gill Capital Partners, Llc | 129 507 | 14,64 | 8 483 | 18,18 | ||||
| 2025-07-22 | 13F | Miracle Mile Advisors, LLC | 98 789 | 6 471 | ||||||
| 2025-07-23 | 13F | Country Club Bank /gfn | 35 173 | 8,26 | 2 299 | 12,31 | ||||
| 2025-07-15 | 13F | Avaii Wealth Management, Llc | 6 214 | −50,19 | 407 | −48,61 | ||||
| 2025-04-11 | 13F | Principia Wealth Advisory, LLC | 0 | −100,00 | 0 | −100,00 | ||||
| 2025-08-14 | 13F | Heritage Wealth Management, Inc. | 25 358 | 41,36 | 1 661 | 45,74 | ||||
| 2025-08-05 | 13F | GPS Wealth Strategies Group, LLC | 6 422 | 0,12 | 421 | 3,19 | ||||
| 2025-08-07 | 13F | Weil Company, Inc. | 146 126 | 128,72 | 9 571 | 135,80 | ||||
| 2025-08-12 | 13F | Resolute Wealth Strategies, LLC | 171 641 | 3,02 | 11 242 | 6,20 | ||||
| 2025-08-14 | 13F | Bank Of America Corp /de/ | 666 072 | 23,27 | 43 628 | 27,07 | ||||
| 2025-05-13 | 13F | SFI Advisors, LLC | 0 | −100,00 | 0 | |||||
| 2025-08-08 | 13F | Kingsview Wealth Management, LLC | 34 672 | 0,23 | 2 271 | 3,28 | ||||
| 2025-07-16 | 13F | Signaturefd, Llc | 140 | 0,00 | 9 | 12,50 | ||||
| 2025-07-17 | 13F | Clear Point Advisors Inc. | 8 736 | 0,37 | 572 | 3,44 | ||||
| 2025-07-22 | 13F | Siligmueller & Norvid Wealth Advisors LLC | 11 029 | 10,29 | 728 | 14,65 | ||||
| 2025-07-29 | 13F | Stratos Wealth Partners, LTD. | 6 860 | 1,57 | 449 | 4,66 | ||||
| 2025-08-13 | 13F | Cary Street Partners Financial Llc | 1 812 | 13,25 | 119 | 16,83 | ||||
| 2025-07-21 | 13F | Ascent Group, LLC | 21 450 | 4,67 | 1 405 | 7,83 | ||||
| 2025-07-30 | 13F | D.a. Davidson & Co. | 27 113 | −19,02 | 1 776 | −16,55 | ||||
| 2025-07-10 | 13F | Exchange Traded Concepts, Llc | 119 988 | 24,53 | 7 859 | 28,37 | ||||
| 2025-08-18 | 13F | Geneos Wealth Management Inc. | 3 564 | 20,81 | 233 | 24,60 | ||||
| 2025-07-10 | 13F | Triangle Securities Wealth Management | 240 257 | 0,97 | 15 737 | 4,08 | ||||
| 2025-08-14 | 13F | Qube Research & Technologies Ltd | 1 939 | 127 | ||||||
| 2025-07-02 | 13F | Crumly & Associates Inc. | 40 571 | −41,91 | 2 657 | −40,12 | ||||
| 2025-07-29 | 13F | Quotient Wealth Partners, LLC | 24 223 | 16,90 | 1 587 | 20,52 | ||||
| 2025-08-01 | 13F | Private Wealth Partners, LLC | 13 150 | 0,00 | 861 | 3,11 | ||||
| 2025-08-04 | 13F | Assetmark, Inc | 39 | −93,09 | 3 | −94,29 | ||||
| 2025-08-13 | 13F | Renaissance Technologies Llc | 3 800 | 249 | ||||||
| 2025-07-16 | 13F | Beaumont Financial Advisors, LLC | 16 606 | −0,95 | 1 088 | 2,07 | ||||
| 2025-08-12 | 13F | Gladstone Institutional Advisory LLC | 44 123 | 69,24 | 2 890 | 74,52 | ||||
| 2025-07-16 | 13F | Stephenson National Bank & Trust | 732 726 | 1,32 | 47 994 | 4,45 | ||||
| 2025-08-04 | 13F | Arkadios Wealth Advisors | 48 031 | 47,18 | 3 146 | 51,76 | ||||
| 2025-07-28 | 13F | Axxcess Wealth Management, Llc | 4 332 | 284 | ||||||
| 2025-07-25 | 13F | LRI Investments, LLC | 21 350 | 16,35 | 1 398 | 20,00 | ||||
| 2025-07-22 | 13F | Gemmer Asset Management LLC | 81 380 | 3,11 | 5 330 | 6,30 | ||||
| 2025-07-14 | 13F | Strategic Planning Group, Llc | 26 010 | −11,60 | 1 704 | −8,88 | ||||
| 2025-07-14 | 13F | AdvisorNet Financial, Inc | 6 713 | 10,23 | 440 | 13,73 | ||||
| 2025-08-05 | 13F | Simplex Trading, Llc | 175 | 0 | ||||||
| 2025-07-25 | 13F | Priebe Wealth Holdings LLC | 32 577 | −5,61 | 2 134 | −2,69 | ||||
| 2025-08-08 | 13F | Emerald Investment Partners, Llc | 159 | 0,00 | 10 | 0,00 | ||||
| 2025-08-12 | 13F | Change Path, LLC | 32 037 | −9,94 | 2 098 | −7,17 | ||||
| 2025-07-22 | 13F | Firethorn Wealth Partners, Llc | 7 871 | 9,52 | 516 | 12,94 | ||||
| 2025-07-09 | 13F | Massmutual Trust Co Fsb/adv | 25 229 | −8,87 | 1 652 | −6,08 | ||||
| 2025-08-05 | 13F | Huntington National Bank | 1 | 0,00 | 0 | |||||
| 2025-08-12 | 13F | Steward Partners Investment Advisory, Llc | 2 704 | −2,77 | 177 | 0,57 | ||||
| 2025-08-12 | 13F | Proequities, Inc. | 0 | 0 | ||||||
| 2025-08-13 | 13F | Capital Analysts, Inc. | 31 637 | 355,73 | 2 | |||||
| 2025-07-11 | 13F | SILVER OAK SECURITIES, Inc | 17 971 | −1,71 | 1 177 | 2,17 | ||||
| 2025-08-08 | 13F | Pnc Financial Services Group, Inc. | 1 030 558 | −0,19 | 67 502 | 2,89 | ||||
| 2025-08-14 | 13F | Stifel Financial Corp | 232 309 | 8,47 | 15 216 | 11,82 | ||||
| 2025-08-14 | 13F | Compass Wealth Management, LLC/GA | 74 815 | 4 900 | ||||||
| 2025-08-15 | 13F | Captrust Financial Advisors | 77 662 | −6,01 | 5 087 | −3,12 | ||||
| 2025-05-12 | 13F | Greenwich Wealth Management LLC | 0 | −100,00 | 0 | |||||
| 2025-07-16 | 13F | ORG Partners LLC | 17 585 | 1 166 | ||||||
| 2025-07-28 | 13F | Rosenberg Matthew Hamilton | 311 | −29,32 | 20 | −25,93 | ||||
| 2025-08-18 | 13F | Arq Wealth Advisors, Llc | 156 817 | 0,00 | 9 964 | 0,00 | ||||
| 2025-08-14 | 13F | Mml Investors Services, Llc | 77 973 | 9,42 | 5 | 25,00 | ||||
| 2025-08-14 | 13F | UBS Group AG | 744 703 | 1,92 | 48 778 | 5,06 | ||||
| 2025-07-25 | 13F | Commonwealth Financial Services, LLC | 112 198 | 8,67 | 7 349 | 12,01 | ||||
| 2025-07-08 | 13F | Parallel Advisors, LLC | 1 840 | 0,00 | 121 | 3,45 | ||||
| 2025-08-19 | 13F | Advisory Services Network, LLC | 11 205 | −13,73 | 736 | −10,91 | ||||
| 2025-08-08 | 13F | Fortis Group Advisors, LLC | 7 712 | 506 | ||||||
| 2025-08-07 | 13F | Resources Investment Advisors, LLC. | 9 389 | 0,37 | 615 | 3,37 | ||||
| 2025-09-04 | 13F/A | Advisor Group Holdings, Inc. | 470 924 | 8,94 | 30 855 | 12,30 | ||||
| 2025-08-13 | 13F | WCG Wealth Advisors LLC | 429 236 | 4,02 | 28 115 | 7,24 | ||||
| 2025-08-08 | 13F | Hartland & Co., LLC | 35 | 0,00 | 2 | 0,00 | ||||
| 2025-08-12 | 13F | O'shaughnessy Asset Management, Llc | 6 939 | 266,56 | 455 | 278,33 | ||||
| 2025-08-19 | 13F | National Asset Management, Inc. | 0 | −100,00 | 0 | |||||
| 2025-07-31 | 13F | Cambridge Investment Research Advisors, Inc. | 139 197 | 38,05 | 9 | 50,00 | ||||
| 2025-07-17 | 13F | Nelson, Van Denburg & Campbell Wealth Management Group, LLC | 1 061 689 | 4,70 | 69 541 | 7,93 | ||||
| 2025-07-22 | 13F | Unique Wealth, Llc | 200 067 | −7,47 | 13 104 | −4,61 | ||||
| 2025-08-14 | 13F | GWM Advisors LLC | 72 593 | 394,37 | 4 755 | 409,54 | ||||
| 2025-08-01 | 13F | Rossby Financial, LCC | 122 | 0,00 | 8 | 0,00 | ||||
| 2025-08-13 | 13F | Twin Peaks Wealth Advisors, LLC | 10 511 | 4,24 | 695 | 14,52 | ||||
| 2025-07-11 | 13F | Orrstown Financial Services Inc | 639 323 | 5,53 | 41 876 | 8,78 | ||||
| 2025-08-06 | 13F | Prospera Financial Services Inc | 4 682 | 31,52 | 307 | 35,84 | ||||
| 2025-08-05 | 13F | Westside Investment Management, Inc. | 4 631 | 0,00 | 307 | 4,78 | ||||
| 2025-08-05 | 13F | EPG Wealth Management LLC | 0 | −100,00 | 0 | |||||
| 2025-08-05 | 13F | Bank Of Montreal /can/ | 737 | 210,97 | 48 | 220,00 | ||||
| 2025-08-13 | 13F | MONECO Advisors, LLC | 8 967 | 0,58 | 587 | 3,71 | ||||
| 2025-07-23 | 13F | HMV Wealth Advisors, LLC | 0 | −100,00 | 0 | |||||
| 2025-08-06 | 13F | Commonwealth Equity Services, Llc | 1 025 317 | 6,12 | 67 | 9,84 | ||||
| 2025-08-07 | 13F | Nwam Llc | 4 541 | −15,42 | 301 | −12,02 | ||||
| 2025-05-12 | 13F | Aveo Capital Partners, LLC | 0 | −100,00 | 0 | |||||
| 2025-08-15 | 13F | Kestra Advisory Services, LLC | 542 816 | 15,41 | 35 554 | 18,97 | ||||
| 2025-07-25 | 13F | Northwest Capital Management Inc | 8 331 | −41,05 | 546 | −39,31 | ||||
| 2025-07-28 | 13F | WealthPlan Investment Management, LLC | 21 463 | 1 406 | ||||||
| 2025-07-17 | 13F | Albion Financial Group /ut | 4 850 | 0,00 | 318 | 2,92 | ||||
| 2025-08-04 | 13F | Daymark Wealth Partners, Llc | 348 530 | −4,95 | 22 829 | −2,02 | ||||
| 2025-07-25 | 13F | Bill Few Associates, Inc. | 6 949 | 455 | ||||||
| 2025-07-28 | 13F | Arlington Financial Advisors, LLC | 334 644 | 7,54 | 21 919 | 10,86 | ||||
| 2025-08-11 | 13F | Perennial Investment Advisors, LLC | 53 410 | 282,18 | 3 498 | 294,36 | ||||
| 2025-08-14 | 13F | Susquehanna International Group, Llp | 24 809 | −67,29 | 1 625 | −66,29 | ||||
| 2025-08-01 | 13F/A | GGM Financials LLC | 84 736 | −0,33 | 5 550 | 2,76 | ||||
| 2025-08-13 | 13F | Summit Wealth Group Llc / Co | 11 688 | 766 | ||||||
| 2025-08-14 | 13F | TCG Advisory Services, LLC | 7 881 | 516 | ||||||
| 2025-07-29 | 13F | Stephens Inc /ar/ | 6 260 | 0,00 | 410 | 3,27 | ||||
| 2025-07-24 | 13F | 3Chopt Investment Partners, LLC | 21 818 | −30,77 | 1 429 | −28,62 | ||||
| 2025-07-22 | 13F | Merit Financial Group, LLC | 7 990 | 523 | ||||||
| 2025-07-24 | 13F | Us Bancorp \de\ | 2 311 | 151 | ||||||
| 2025-07-21 | 13F | Ameriflex Group, Inc. | 315 | 0,32 | 21 | 5,26 | ||||
| 2025-07-15 | 13F | Centerline Wealth Advisors, LLC | 127 225 | 8 333 | ||||||
| 2025-07-25 | 13F | Envestnet Portfolio Solutions, Inc. | 0 | −100,00 | 0 | |||||
| 2025-07-17 | 13F | Janney Montgomery Scott LLC | 1 477 592 | 0,02 | 97 | 3,23 | ||||
| 2025-07-29 | 13F | Signature Estate & Investment Advisors Llc | 8 813 | 577 | ||||||
| 2025-08-08 | 13F/A | Ignite Planners, LLC | 9 311 | 11,26 | 617 | 19,38 | ||||
| 2025-08-14 | 13F | Integrated Wealth Concepts LLC | 6 886 | −93,21 | 451 | −93,00 | ||||
| 2025-08-11 | 13F | Aptus Capital Advisors, LLC | 1 546 | 6,92 | 101 | 10,99 | ||||
| 2025-04-29 | 13F | Financial Network Wealth Management LLC | 2 861 | 0 | ||||||
| 2025-08-12 | 13F | J.w. Cole Advisors, Inc. | 7 609 | −10,28 | 498 | −7,43 | ||||
| 2025-08-13 | 13F | Northwestern Mutual Wealth Management Co | 14 208 | 213,43 | 931 | 222,92 | ||||
| 2025-05-13 | 13F | Eaton Financial Holdings Company, LLC | 0 | −100,00 | 0 | |||||
| 2025-05-15 | 13F | Smith, Moore & Co. | 0 | −100,00 | 0 | |||||
| 2025-07-24 | 13F | Cyndeo Wealth Partners, LLC | 44 708 | −1,73 | 2 928 | 1,31 | ||||
| 2025-08-12 | 13F | Intellus Advisors LLC | 460 972 | 2,47 | 30 194 | 5,64 | ||||
| 2025-08-07 | 13F | Americana Partners, LLC | 537 843 | 1,20 | 35 229 | 4,32 | ||||
| 2025-07-29 | 13F | Independence Asset Advisors, LLC | 8 404 | 78,85 | 550 | 84,56 | ||||
| 2025-07-25 | 13F | Concurrent Investment Advisors, LLC | 35 495 | 534,18 | 2 325 | 554,65 | ||||
| 2025-07-16 | 13F | Perigon Wealth Management, LLC | 60 011 | 12,53 | 3 931 | 16,00 | ||||
| 2025-07-25 | 13F | Atria Wealth Solutions, Inc. | 29 469 | −11,48 | 1 931 | −8,70 | ||||
| 2025-08-08 | 13F | Keyvantage Wealth, Llc | 201 693 | 3,50 | 13 211 | 6,69 | ||||
| 2025-08-14 | 13F | Mariner, LLC | 24 096 | 31,33 | 1 578 | 35,45 | ||||
| 2025-07-22 | 13F | Sutton Place Investors Llc | 12 635 | −4,08 | 828 | −1,08 | ||||
| 2025-07-25 | 13F | NorthRock Partners, LLC | 0 | −100,00 | 0 | |||||
| 2025-08-05 | 13F | 5T Wealth, LLC | 43 752 | −11,01 | 2 866 | −8,26 | ||||
| 2025-07-23 | 13F | Clear Creek Financial Management, LLC | 13 369 | 2,22 | 876 | 5,29 | ||||
| 2025-08-11 | 13F | HighTower Advisors, LLC | 63 749 | 6,48 | 4 176 | 9,75 | ||||
| 2025-07-08 | 13F | Prism Advisors, Inc. | 221 610 | −4,96 | 14 515 | −2,03 | ||||
| 2025-07-25 | 13F | Apollon Wealth Management, LLC | 3 100 | 203 | ||||||
| 2025-07-30 | 13F | Wbh Advisory Inc | 20 812 | 1 363 | ||||||
| 2025-07-21 | 13F | Ameritas Advisory Services, LLC | 735 | 48 | ||||||
| 2025-08-14 | 13F | Vista Private Wealth Partners. LLC | 84 580 | 0,84 | 5 540 | 3,94 | ||||
| 2025-08-13 | 13F | Cary Street Partner Investment Advisory Llc | 7 903 | −12,63 | 518 | −9,93 | ||||
| 2025-07-23 | 13F | Litman Gregory Asset Management LLC | 11 385 | −12,40 | 746 | −9,70 | ||||
| 2025-07-11 | 13F | First PREMIER Bank | 4 718 | 0 | ||||||
| 2025-07-22 | 13F | PUREfi Wealth, LLC | 11 696 | 75,27 | 766 | 80,66 | ||||
| 2025-08-07 | 13F | Fagan Associates, Inc. | 53 807 | 5,60 | 3 524 | 8,87 | ||||
| 2025-07-11 | 13F | Pinnacle Bancorp, Inc. | 1 288 | 119,05 | 84 | 127,03 | ||||
| 2025-07-16 | 13F | Blue Oak Capital, LLC | 38 569 | −2,20 | 2 526 | 0,84 | ||||
| 2025-08-18 | 13F | Tyler-Stone Wealth Management | 184 536 | −6,13 | 12 087 | −3,23 | ||||
| 2025-07-07 | 13F | Thurston, Springer, Miller, Herd & Titak, Inc. | 25 877 | 1 921,64 | 1 695 | 1 991,36 | ||||
| 2025-08-14 | 13F | Visionary Wealth Advisors | 5 731 | −36,01 | 375 | −34,09 | ||||
| 2025-07-30 | 13F | LGT Financial Advisors LLC | 949 | −15,87 | 62 | −12,68 | ||||
| 2025-08-14 | 13F | Wells Fargo & Company/mn | 194 890 | 84,62 | 12 765 | 90,32 | ||||
| 2025-07-28 | 13F | Sagespring Wealth Partners, Llc | 3 069 729 | 9,48 | 201 067 | 12,86 | ||||
| 2025-08-06 | 13F | Convergence Financial, LLC | 330 056 | 5,59 | 21 619 | 8,85 | ||||
| 2025-07-17 | 13F | MBA Advisors LLC | 4 566 | −1,95 | 299 | 1,36 | ||||
| 2025-08-14 | 13F | Ameriprise Financial Inc | 2 449 480 | 13,26 | 160 457 | 16,77 | ||||
| 2025-07-18 | 13F | Centricity Wealth Management, LLC | 610 | 0,00 | 40 | 2,63 | ||||
| 2025-07-01 | 13F | Harbor Investment Advisory, Llc | 5 816 | 11,61 | 381 | 14,80 | ||||
| 2025-08-12 | 13F | Ci Investments Inc. | 426 368 | 12,15 | 28 | 12,50 | ||||
| 2025-07-28 | 13F | Harbour Investments, Inc. | 65 427 | 4,22 | 4 285 | 7,45 | ||||
| 2025-08-14 | 13F | Royal Bank Of Canada | 572 371 | 4,40 | 37 490 | 7,62 | ||||
| 2025-08-15 | 13F | Sugar Maple Asset Management, LLC | 26 357 | −3,33 | 1 726 | −0,35 | ||||
| 2025-07-22 | 13F | Belpointe Asset Management LLC | 9 197 | 6,90 | 602 | 10,26 | ||||
| 2025-08-06 | 13F | Nvwm, Llc | 8 003 | 0,00 | 524 | 3,15 | ||||
| 2025-08-06 | 13F | Summit Wealth & Retirement Planning, Inc. | 3 178 | 0,00 | 208 | 3,48 | ||||
| 2025-08-18 | 13F | N.E.W. Advisory Services LLC | 0 | −100,00 | 0 | |||||
| 2025-08-14 | 13F | Great Valley Advisor Group, Inc. | 689 583 | 21,47 | 45 168 | 25,21 | ||||
| 2025-08-14 | 13F | Comerica Bank | 5 675 | −6,46 | 372 | −3,64 | ||||
| 2025-08-05 | 13F | Strategic Financial Concepts, LLC | 0 | −100,00 | 0 | |||||
| 2025-08-08 | 13F | Creative Planning | 4 113 | 269 | ||||||
| 2025-08-11 | 13F | Citigroup Inc | 7 548 | 494 | ||||||
| 2025-08-27 | NP | Advanced Series Trust - Ast J.p. Morgan Strategic Opportunities Portfolio | 2 843 874 | 0,00 | 186 274 | 3,08 | ||||
| 2025-08-01 | 13F | Envestnet Asset Management Inc | 1 203 193 | 1,14 | 78 809 | 4,26 | ||||
| 2025-08-11 | 13F | Western Wealth Management, LLC | 37 959 | −0,32 | 2 486 | 2,77 | ||||
| 2025-08-05 | 13F | Fourth Dimension Wealth, LLC | 0 | −100,00 | 0 | |||||
| 2025-08-12 | 13F | LPL Financial LLC | 4 972 206 | 28,22 | 325 679 | 32,17 | ||||
| 2025-08-13 | 13F | Capital Advisors Wealth Management, LLC | 3 390 | −1,11 | 222 | 2,30 | ||||
| 2025-08-13 | 13F | Flow Traders U.s. Llc | 4 950 | 0 | ||||||
| 2025-08-13 | 13F | StoneX Group Inc. | 23 072 | 3,75 | 1 511 | 6,94 | ||||
| 2025-08-15 | 13F | Equitable Holdings, Inc. | 33 935 | −5,02 | 2 223 | −2,11 | ||||
| 2025-07-24 | 13F | Financial Connections Group, Inc. | 7 437 | −28,39 | 0 | |||||
| 2025-08-12 | 13F | Financial Advocates Investment Management | 45 433 | 2 976 | ||||||
| 2025-08-13 | 13F | Jones Financial Companies Lllp | 489 254 | 42,50 | 31 983 | 47,83 | ||||
| 2025-07-10 | 13F | Atticus Wealth Management, Llc | 2 207 | 145 | ||||||
| 2025-08-15 | 13F | Tower Research Capital LLC (TRC) | 7 841 | 514 | ||||||
| 2025-08-08 | 13F | Cetera Investment Advisers | 1 192 349 | 5,91 | 78 099 | 9,18 | ||||
| 2025-08-04 | 13F | WNY Asset Management, LLC | 399 217 | −8,82 | 26 149 | −6,01 | ||||
| 2025-07-24 | 13F | IFP Advisors, Inc | 18 664 | 74,84 | 1 223 | 80,24 | ||||
| 2025-07-18 | 13F | Bartlett & Co. Wealth Management Llc | 21 | 0,00 | 1 | 0,00 | ||||
| 2025-08-06 | 13F | AE Wealth Management LLC | 2 808 | 0,00 | 184 | 2,81 | ||||
| 2025-07-31 | 13F | Oak Harbor Wealth Partners, Llc | 5 106 | 27,81 | 334 | 32,02 | ||||
| 2025-08-13 | 13F | GeoWealth Management, LLC | 6 887 | 0,98 | 451 | 4,16 | ||||
| 2025-08-15 | 13F | First Heartland Consultants, Inc. | 42 523 | 2 785 | ||||||
| 2025-08-08 | 13F | SBI Securities Co., Ltd. | 55 | 34,15 | 4 | 50,00 | ||||
| 2025-08-11 | 13F | Lake Street Financial Llc | 15 233 | 1,63 | 998 | 4,73 | ||||
| 2025-08-04 | 13F | Atria Investments Llc | 41 973 | 36,47 | 2 749 | 40,69 | ||||
| 2025-04-21 | 13F | PSI Advisors, LLC | 0 | −100,00 | 0 | |||||
| 2025-07-25 | 13F | Cwm, Llc | 294 055 | 91,68 | 19 | 111,11 | ||||
| 2025-08-06 | 13F | Mascagni Wealth Management, Inc. | 24 676 | −8,84 | 1 616 | −5,99 | ||||
| 2025-08-14 | 13F | Jane Street Group, Llc | 0 | −100,00 | 0 | |||||
| 2025-08-06 | 13F | Vestmark Advisory Solutions, Inc. | 1 155 023 | 115,42 | 75 654 | 122,07 | ||||
| 2025-08-14 | 13F | Citadel Advisors Llc | Call | 5 200 | −50,00 | 341 | −48,48 | |||
| 2025-08-14 | 13F | Citadel Advisors Llc | 29 559 | 10 970,79 | 1 936 | 12 000,00 | ||||
| 2025-08-05 | 13F | Obermeyer Wood Investment Counsel, Lllp | 8 372 | 0,00 | 548 | 3,20 | ||||
| 2025-07-11 | 13F | CMH Wealth Management LLC | 42 995 | −1,85 | 2 816 | 1,19 | ||||
| 2025-08-27 | NP | ADVANCED SERIES TRUST - AST T. Rowe Price Growth Opportunities Portfolio | 2 976 490 | −12,93 | 194 960 | −10,25 | ||||
| 2025-07-10 | 13F | Wealth Enhancement Advisory Services, Llc | 30 535 | 5,05 | 2 039 | 10,46 | ||||
| 2025-07-09 | 13F | Krilogy Financial LLC | 11 385 | −0,95 | 746 | 2,05 | ||||
| 2025-08-12 | 13F | Frontier Asset Management, LLC | 15 911 | −1,50 | 1 042 | 1,56 | ||||
| 2025-06-26 | NP | FLCE - Frontier Asset U.S. Large Cap Equity ETF | 105 444 | 9,43 | 6 497 | 1,99 | ||||
| 2025-08-08 | 13F | Thoroughbred Financial Services, Llc | 7 156 | −7,83 | 0 | |||||
| 2025-08-14 | 13F | Raymond James Financial Inc | 768 996 | −15,41 | 50 369 | −12,80 | ||||
| 2025-07-30 | 13F | Whittier Trust Co Of Nevada Inc | 2 094 | 21,96 | 137 | 25,69 | ||||
| 2025-07-11 | 13F | Farther Finance Advisors, LLC | 9 923 | −8,48 | 650 | −5,67 | ||||
| 2025-08-08 | 13F | Comprehensive Financial Planning, Inc./PA | 95 | 1,06 | 6 | 0,00 | ||||
| 2025-07-11 | 13F | Seacrest Wealth Management, Llc | 6 175 | 17,26 | 404 | 20,96 | ||||
| 2025-07-17 | 13F | Alliance Wealth Advisors, LLC | 7 852 | −12,27 | 514 | −9,51 | ||||
| 2025-08-08 | 13F | Atlanta Consulting Group Advisors, LLC | 15 924 | 11,59 | 1 043 | 15,12 | ||||
| 2025-07-15 | 13F | BKA Wealth Consulting, Inc. | 5 122 | 336 | ||||||
| 2025-07-31 | 13F | FSM Wealth Advisors, LLC | 425 087 | 15,31 | 28 154 | 20,19 | ||||
| 2025-07-29 | 13F | Private Trust Co Na | 12 663 | 274,64 | 829 | 287,38 | ||||
| 2025-08-14 | 13F | Citadel Advisors Llc | Put | 4 600 | 228,57 | 301 | 242,05 | |||
| 2025-08-14 | 13F | IHT Wealth Management, LLC | 6 639 | 99,13 | 435 | 106,67 | ||||
| 2025-08-08 | 13F | Avantax Advisory Services, Inc. | 18 660 | 49,78 | 1 222 | 54,49 | ||||
| 2025-08-14 | 13F | Colony Group, LLC | 383 578 | 6,24 | 25 124 | 9,52 | ||||
| 2025-08-15 | 13F | Morgan Stanley | 1 555 179 | 13,04 | 101 864 | 16,53 | ||||
| 2025-08-12 | 13F | Global Retirement Partners, LLC | 66 093 | 21 015,97 | 4 329 | 22 684,21 | ||||
| 2025-08-13 | 13F | Kuhn & Co Investment Counsel | 13 562 | −12,84 | 888 | −10,12 | ||||
| 2025-08-27 | NP | ADVANCED SERIES TRUST - AST J.P. Morgan Global Thematic Portfolio | 1 858 236 | −4,45 | 121 714 | −1,50 | ||||
| 2025-08-11 | 13F | Ritter Daniher Financial Advisory LLC / DE | 30 062 | −12,76 | 1 969 | −10,05 | ||||
| 2025-07-21 | 13F | Triad Wealth Partners, LLC | 33 467 | 71,31 | 2 192 | 76,63 | ||||
| 2025-08-05 | 13F | Dynasty Wealth Management, Llc | 2 983 626 | −3,62 | 195 428 | −0,64 | ||||
| 2025-07-25 | 13F | We Are One Seven, LLC | 22 956 | 1 504 |