Grundläggande statistik
| Institutionella ägare | 188 total, 188 long only, 0 short only, 0 long/short - change of 12,50% MRQ |
| Genomsnittlig portföljallokering | 0.4909 % - change of −3,70% MRQ |
| Institutionella aktier (lång) | 25 957 432 (ex 13D/G) - change of 4,28MM shares 19,75% MRQ |
| Institutionellt värde (lång) | $ 1 014 617 USD ($1000) |
Institutionellt ägande och aktieägare
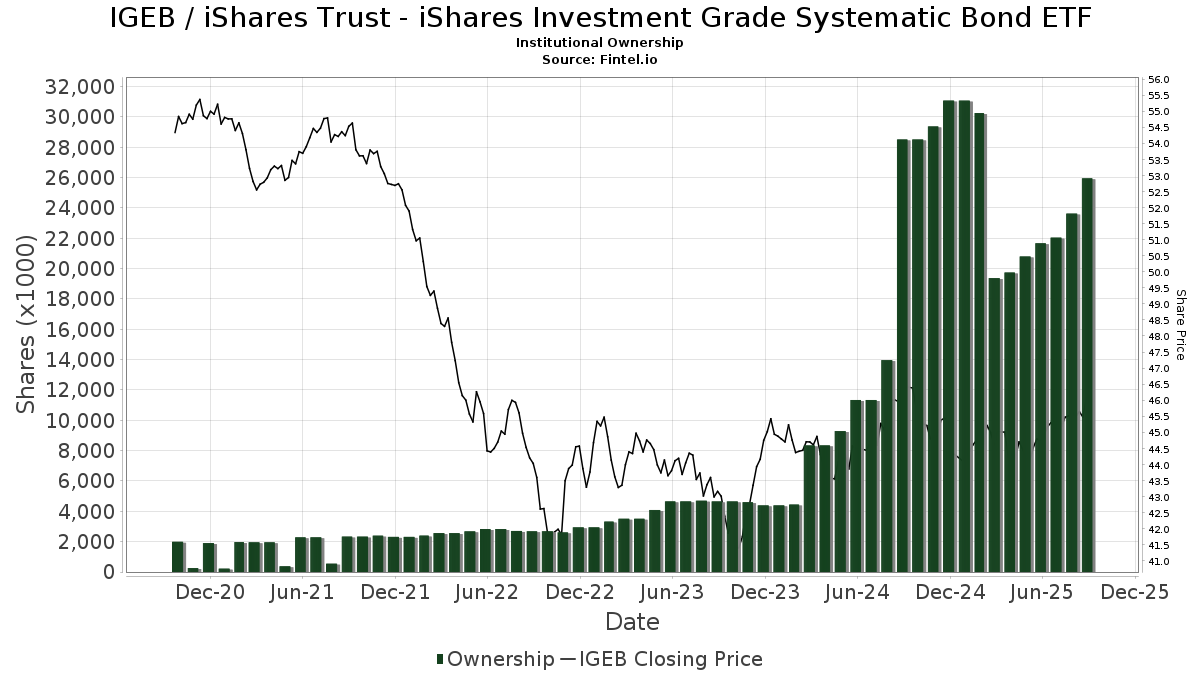
iShares Trust - iShares Investment Grade Systematic Bond ETF (US:IGEB) har 188 Institutionella ägare och aktieägare som har lämnat in 13D/G- eller 13F-formulär till Securities Exchange Commission (SEC). Dessa institut innehar totalt 25,957,432 aktier. Största aktieägare inkluderar Envestnet Asset Management Inc, LPL Financial LLC, State of New Jersey Common Pension Fund D, Bank Of America Corp /de/, Ameriprise Financial Inc, Fundamentun, Llc, Hennion & Walsh Asset Management, Inc., Cwm, Llc, Mml Investors Services, Llc, and Resources Investment Advisors, LLC. .
iShares Trust - iShares Investment Grade Systematic Bond ETF (BATS:IGEB) Institutionell ägarstruktur visar institutioners och fonders nuvarande positioner i företaget, samt de senaste förändringarna i positionernas storlek. Större aktieägare kan vara enskilda investerare, fonder, hedgefonder eller institutioner. Bilaga 13D visar att investeraren äger (eller ägde) mer än 5% av företaget och avser (eller avsåg) att aktivt eftersträva en förändring av affärsstrategin. Schedule 13G indikerar en passiv investering på över 5%.
The share price as of September 12, 2025 is 46,16 / share. Previously, on September 13, 2024, the share price was 46,48 / share. This represents a decline of 0,68% over that period.
Fondsentimentets poäng
Fondsentimentet poängen(fka Ägarackumulation-poäng) visar vilka aktier som är mest köpta av fonder. Det är resultatet av en sofistikerad kvantitativ flerfaktormodell som identifierar företag med de högsta nivåerna av institutionell ackumulering. Poängsättningsmodellen använder en kombination av den totala ökningen av redovisade ägare, förändringarna i portföljallokeringarna för dessa ägare och andra mått. Siffran sträcker sig från 0 till 100, där högre siffror indikerar en högre nivå av ackumulering i förhållande till sina konkurrenter, och 50 är genomsnittet.
Uppdateringsfrekvens: Dagligen
Se Ownership Explorer, som innehåller en lista över de högst rankade företagen.
Institutionell sälj/köp-kvot
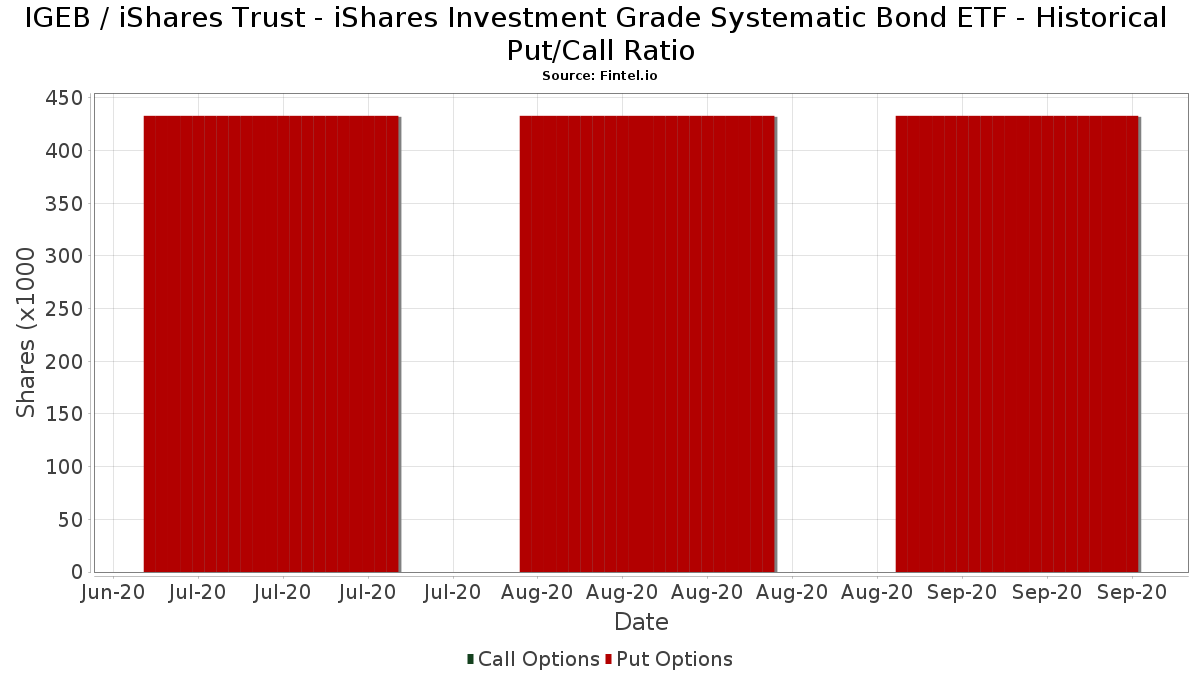
Förutom att rapportera vanliga eget kapital- och skuldemissioner måste institutioner med mer än 100MM tillgångar under förvaltning också avslöja sina innehav av sälj- och köpoptioner. Eftersom säljoptioner i allmänhet indikerar ett negativt sentiment och köpoptioner indikerar ett positivt sentiment, kan vi få en uppfattning om det övergripande institutionella sentimentet genom att plotta förhållandet mellan säljoptioner och köpoptioner. Diagrammet till höger visar det historiska förhållandet mellan sälj- och köpoptioner för detta instrument.
Genom att använda sälj/köp-kvoten som en indikator på aktieägarnas sentiment undviker man en av de största bristerna med att använda det totala institutionella ägandet, nämligen att en betydande del av de förvaltade tillgångarna investeras passivt för att följa index. Passivt förvaltade fonder köper vanligtvis inte optioner, så indikatorn för sälj/köp-kvoten ger en bättre bild av stämningen i aktivt förvaltade fonder.
13F- och NPORT-arkiveringar
Detaljer om 13F-arkiveringar är gratis. Detaljer om NP-arkiveringar kräver ett premiummedlemskap. Gröna rader indikerar nya positioner. Röda rader indikerar stängda positioner. Klicka på länk symbolen för att se hela transaktionshistoriken.
Uppgradera
för att låsa upp premiumdata och exportera till Excel ![]() .
.
| Fil Datum | Källa | Investerare | Typ | Genomsnittligt pris (beräknat) |
Aktier | Δ Aktier (%) |
Rapporterat värde (1000 USD) |
Δ Värde (%) |
Portföljallokering (%) |
|
|---|---|---|---|---|---|---|---|---|---|---|
| 2025-05-12 | 13F | CFS Investment Advisory Services, LLC | 0 | −100,00 | 0 | |||||
| 2025-05-14 | 13F | Oarsman Capital, Inc. | 0 | −100,00 | 0 | |||||
| 2025-07-09 | 13F | Breakwater Capital Group | 94 737 | 8,87 | 4 305 | 9,91 | ||||
| 2025-07-18 | 13F | SigFig Wealth Management, LLC | 5 494 | 249 | ||||||
| 2025-07-28 | 13F | Axxcess Wealth Management, Llc | 10 687 | −11,04 | 486 | −10,19 | ||||
| 2025-08-06 | 13F | North Capital, Inc. | 102 | 0,99 | 5 | 0,00 | ||||
| 2025-07-09 | 13F | Fermata Advisors, LLC | 44 117 | 13,38 | 2 005 | 14,45 | ||||
| 2025-06-26 | NP | FCBD - Frontier Asset Core Bond ETF | 49 966 | −23,85 | 2 233 | −23,66 | ||||
| 2025-07-17 | 13F | Altus Wealth Management, LLC | 43 389 | −1,16 | 1 972 | −0,20 | ||||
| 2025-07-08 | 13F | Parallel Advisors, LLC | 47 549 | −28,89 | 2 161 | −28,22 | ||||
| 2025-08-14 | 13F | Diversify Advisory Services, LLC | 4 967 | 226 | ||||||
| 2025-08-14 | 13F | Susquehanna International Group, Llp | 66 480 | 1 035,83 | 3 021 | 1 048,29 | ||||
| 2025-08-11 | 13F | Copperleaf Capital, LLC | 0 | −100,00 | 0 | |||||
| 2025-07-29 | 13F | Two West Capital Advisors LLC | 22 899 | 13,92 | 1 036 | 18,13 | ||||
| 2025-07-25 | 13F | Cwm, Llc | 783 778 | −1,25 | 36 | 0,00 | ||||
| 2025-04-28 | 13F | Fedenia Advisers LLC | 0 | −100,00 | 0 | |||||
| 2025-08-15 | 13F | Morgan Stanley | 556 092 | 47,41 | 25 269 | 48,81 | ||||
| 2025-08-15 | 13F | High Falls Advisors, Inc | 9 806 | 446 | ||||||
| 2025-05-07 | 13F | Spectrum Wealth Counsel, LLC | 7 255 | 25,71 | 327 | 27,34 | ||||
| 2025-08-12 | 13F | BlackRock, Inc. | 596 006 | 3,66 | 27 083 | 4,64 | ||||
| 2025-08-13 | 13F | Flow Traders U.s. Llc | 0 | −100,00 | 0 | |||||
| 2025-08-14 | 13F | Ancora Advisors, LLC | 52 | −23,53 | 2 | −33,33 | ||||
| 2025-08-19 | 13F | Advisory Services Network, LLC | 53 467 | −0,62 | 2 421 | −0,04 | ||||
| 2025-07-21 | 13F | Ascent Group, LLC | 46 813 | 2,26 | 2 127 | 3,25 | ||||
| 2025-07-31 | 13F | State of New Jersey Common Pension Fund D | 1 621 932 | 0,00 | 73 701 | 0,95 | ||||
| 2025-07-16 | 13F | ORG Partners LLC | 72 939 | 5,73 | 3 314 | 6,94 | ||||
| 2025-08-11 | 13F | United Capital Financial Advisers, Llc | 331 206 | 8,31 | 15 050 | 9,34 | ||||
| 2025-08-06 | 13F | Centerpoint Advisory Group | 15 397 | −2,87 | 700 | −1,96 | ||||
| 2025-07-25 | 13F | Sequoia Financial Advisors, LLC | 4 447 | 202 | ||||||
| 2025-08-05 | 13F | GPS Wealth Strategies Group, LLC | 300 | 0,00 | 14 | 0,00 | ||||
| 2025-08-26 | NP | EVTTX - The E-Valuator Conservative/Moderate (30%-50%) RMS Fund Service Class Shares | 15 812 | 9,40 | 718 | 10,46 | ||||
| 2025-06-26 | NP | FOPC - Frontier Asset Opportunistic Credit ETF | 125 662 | −2,11 | 5 617 | −1,85 | ||||
| 2025-08-05 | 13F | Key FInancial Inc | 75 | 3 | ||||||
| 2025-07-24 | 13F | JB Capital LLC | 32 960 | 1 498 | ||||||
| 2025-08-06 | 13F | AE Wealth Management LLC | 1 042 | 9,45 | 47 | 11,90 | ||||
| 2025-08-26 | NP | EVAGX - The E-Valuator Aggressive Growth (85%-99%) RMS Fund Service Class Shares | 4 794 | −72,72 | 218 | −72,53 | ||||
| 2025-07-29 | 13F | Hoese & Co LLP | 59 519 | 6,90 | 2 704 | 7,90 | ||||
| 2025-08-26 | NP | EVMLX - The E-Valuator Moderate (50%-70%) RMS Fund Service Class Shares | 35 776 | −27,66 | 1 626 | −27,00 | ||||
| 2025-08-26 | NP | EVGLX - The E-Valuator Growth (70%-85%) RMS Fund Service Class Shares | 37 151 | 7,74 | 1 688 | 8,83 | ||||
| 2025-08-14 | 13F | Wells Fargo & Company/mn | 9 250 | 3 004,03 | 420 | 3 130,77 | ||||
| 2025-08-13 | 13F | Argyle Capital Partners, LLC | 9 233 | 0,00 | 420 | 0,96 | ||||
| 2025-08-14 | 13F | Mml Investors Services, Llc | 746 919 | 31,61 | 34 | 32,00 | ||||
| 2025-07-29 | 13F | Riverbend Wealth Management, LLC | 6 587 | 299 | ||||||
| 2025-04-24 | 13F | Kraft, Davis & Associates, LLC | 0 | −100,00 | 0 | |||||
| 2025-08-07 | 13F | Hennion & Walsh Asset Management, Inc. | 794 619 | −29,75 | 36 107 | −29,07 | ||||
| 2025-07-25 | 13F | Investment Advisory Group, LLC | 7 644 | 0,00 | 347 | 0,87 | ||||
| 2025-08-05 | 13F | Scarborough Advisors, LLC | 571 | 26 | ||||||
| 2025-08-14 | 13F | Mariner, LLC | 5 378 | −1,61 | 244 | −0,81 | ||||
| 2025-07-25 | 13F | Envestnet Portfolio Solutions, Inc. | 165 106 | 245,89 | 7 502 | 249,26 | ||||
| 2025-08-14 | 13F | Guardian Wealth Advisors, Llc / Nc | 188 | 0,00 | 9 | 0,00 | ||||
| 2025-07-31 | 13F | Glass Jacobson Investment Advisors llc | 0 | −100,00 | 0 | |||||
| 2025-08-06 | 13F | Commonwealth Equity Services, Llc | 236 912 | 11 | ||||||
| 2025-08-12 | 13F | Steward Partners Investment Advisory, Llc | 60 272 | 19,37 | 2 739 | 20,51 | ||||
| 2025-08-07 | 13F | Shared Vision Wealth Group LLC | 54 119 | 53,47 | 2 450 | 54,38 | ||||
| 2025-08-14 | 13F | Jane Street Group, Llc | 35 406 | −77,23 | 1 609 | −77,03 | ||||
| 2025-09-04 | 13F/A | Advisor Group Holdings, Inc. | 86 348 | 44,21 | 3 924 | 45,55 | ||||
| 2025-07-24 | 13F | MA Private Wealth | 26 874 | 26,60 | 1 221 | 27,85 | ||||
| 2025-07-10 | 13F | Exchange Traded Concepts, Llc | 170 504 | −7,83 | 7 748 | −6,95 | ||||
| 2025-08-04 | 13F | Wealth Management Associates, Inc. | 24 631 | 2,06 | 1 119 | 3,04 | ||||
| 2025-08-14 | 13F | UBS Group AG | 336 739 | 15,54 | 15 301 | 16,65 | ||||
| 2025-07-23 | 13F | Prime Capital Investment Advisors, LLC | 35 134 | −5,17 | 1 596 | −4,26 | ||||
| 2025-08-05 | 13F | Huntington National Bank | 0 | |||||||
| 2025-08-11 | 13F | Nations Financial Group Inc, /ia/ /adv | 14 898 | 27,19 | 677 | 28,27 | ||||
| 2025-07-17 | 13F | Patton Albertson Miller Group, Llc | 25 228 | −40,33 | 1 146 | −39,75 | ||||
| 2025-07-09 | 13F | Keystone Wealth Services, LLC | 25 337 | 0,02 | 1 151 | 0,96 | ||||
| 2025-07-17 | 13F | HB Wealth Management, LLC | 29 676 | −1,75 | 1 348 | −0,81 | ||||
| 2025-05-09 | 13F | Emerald Investment Partners, Llc | 0 | −100,00 | 0 | |||||
| 2025-07-29 | 13F | Fundamentun, Llc | 915 748 | 3,26 | 41 612 | 4,24 | ||||
| 2025-08-14 | 13F | Royal Bank Of Canada | 490 925 | 4,11 | 22 307 | 5,11 | ||||
| 2025-07-23 | 13F | Steel Peak Wealth Management LLC | 12 401 | 5,09 | 564 | 6,03 | ||||
| 2025-07-31 | 13F | Cambridge Investment Research Advisors, Inc. | 442 957 | 6,86 | 20 | 11,11 | ||||
| 2025-08-18 | 13F | Geneos Wealth Management Inc. | 253 227 | 51,42 | 11 507 | 52,86 | ||||
| 2025-07-25 | 13F | NorthRock Partners, LLC | 6 441 | −80,76 | 293 | −80,62 | ||||
| 2025-07-16 | 13F | Eagle Global Advisors Llc | 15 870 | 0,76 | 721 | 1,84 | ||||
| 2025-07-11 | 13F | SILVER OAK SECURITIES, Inc | 32 594 | −1,01 | 1 481 | 0,14 | ||||
| 2025-08-14 | 13F | IHT Wealth Management, LLC | 10 593 | −41,58 | 481 | −41,05 | ||||
| 2025-07-14 | 13F | Caitlin John, LLC | 5 999 | −4,76 | 273 | −3,89 | ||||
| 2025-04-23 | 13F | Keystone Financial Services | 0 | −100,00 | 0 | |||||
| 2025-08-13 | 13F | Kilter Group LLC | 1 | 0 | ||||||
| 2025-08-11 | 13F | Tidemark, LLC | 12 006 | −21,97 | 546 | −21,24 | ||||
| 2025-07-29 | 13F | Liberty Square Wealth Partners Llc | 4 805 | 0,00 | 218 | 0,93 | ||||
| 2025-08-14 | 13F | Icon Wealth Advisors, LLC | 5 710 | 50,86 | 259 | 52,35 | ||||
| 2025-07-17 | 13F | Beacon Capital Management, LLC | 245 | 0,00 | 11 | 0,00 | ||||
| 2025-08-08 | 13F | Pnc Financial Services Group, Inc. | 5 410 | −5,72 | 246 | −5,04 | ||||
| 2025-08-14 | 13F | Integrated Wealth Concepts LLC | 167 173 | 24,61 | 7 596 | 25,80 | ||||
| 2025-04-17 | 13F | KC Investment Advisors, LLC | 0 | −100,00 | 0 | |||||
| 2025-08-12 | 13F | Change Path, LLC | 23 603 | 1 072 | ||||||
| 2025-08-12 | 13F | Global Retirement Partners, LLC | 1 860 | 358,13 | 85 | 366,67 | ||||
| 2025-08-14 | 13F | Ameriprise Financial Inc | 996 346 | 15,25 | 45 267 | 16,35 | ||||
| 2025-08-14 | 13F | Raymond James Financial Inc | 113 763 | −18,17 | 5 169 | −17,39 | ||||
| 2025-08-14 | 13F | Colony Group, LLC | 7 560 | 344 | ||||||
| 2025-08-28 | NP | GPMIX - GuidePath(R) Multi-Asset Income Allocation Fund Service Shares | 30 362 | 1 380 | ||||||
| 2025-08-11 | 13F | Aptus Capital Advisors, LLC | 188 | 0,00 | 9 | 0,00 | ||||
| 2025-08-12 | 13F | FreeGulliver LLC | 53 387 | 1,99 | 2 426 | 2,97 | ||||
| 2025-07-25 | 13F | Atria Wealth Solutions, Inc. | 10 839 | 493 | ||||||
| 2025-05-14 | 13F | WCG Wealth Advisors LLC | 0 | −100,00 | 0 | |||||
| 2025-07-21 | 13F | Ameritas Advisory Services, LLC | 1 123 | 51 | ||||||
| 2025-07-24 | 13F | Us Bancorp \de\ | 6 | 0 | ||||||
| 2025-07-17 | 13F | Janney Montgomery Scott LLC | 508 100 | −1,86 | 23 | 0,00 | ||||
| 2025-04-30 | 13F | Horst & Graben Wealth Management LLC | 0 | −100,00 | 0 | |||||
| 2025-07-21 | 13F | Ameriflex Group, Inc. | 3 285 | 1,26 | 149 | 1,37 | ||||
| 2025-08-11 | 13F | Strategic Wealth Partners, Ltd. | 641 | 29 | ||||||
| 2025-08-13 | 13F | Continuum Advisory, LLC | 0 | −100,00 | 0 | |||||
| 2025-07-25 | 13F | Lion Street Advisors, LLC | 15 000 | −5,08 | 682 | −4,22 | ||||
| 2025-08-13 | 13F | Cerity Partners LLC | 8 614 | −54,76 | 391 | −54,32 | ||||
| 2025-08-07 | 13F | New England Private Wealth Advisors LLC | 6 674 | 1,64 | 303 | 2,71 | ||||
| 2025-06-26 | NP | BYLD - iShares Yield Optimized Bond ETF | 561 855 | 220,78 | 25 115 | 221,56 | ||||
| 2025-07-29 | 13F | Systelligence, LLC | 140 496 | −10,50 | 6 384 | −9,64 | ||||
| 2025-07-22 | 13F | Merit Financial Group, LLC | 248 811 | 29,49 | 11 306 | 30,72 | ||||
| 2025-07-10 | 13F | Sovran Advisors, LLC | 29 726 | 52,90 | 1 336 | 55,17 | ||||
| 2025-04-14 | 13F | Bangor Savings Bank | 0 | −100,00 | 0 | |||||
| 2025-08-06 | 13F | Able Wealth Management LLC | 12 936 | −22,30 | 588 | −21,63 | ||||
| 2025-08-11 | 13F | TD Waterhouse Canada Inc. | 2 167 | −98,14 | 98 | −98,13 | ||||
| 2025-04-24 | 13F | Tsfg, Llc | 0 | −100,00 | 0 | |||||
| 2025-08-14 | 13F | Ausdal Financial Partners, Inc. | 11 288 | 513 | ||||||
| 2025-07-25 | 13F | Apollon Wealth Management, LLC | 19 372 | −2,42 | 880 | −1,46 | ||||
| 2025-04-29 | 13F | Raleigh Capital Management Inc. | 0 | −100,00 | 0 | |||||
| 2025-08-13 | 13F | Vertex Planning Partners, LLC | 13 601 | 3,26 | 618 | 4,39 | ||||
| 2025-08-01 | 13F | Envestnet Asset Management Inc | 3 138 485 | 68,50 | 142 613 | 70,11 | ||||
| 2025-08-12 | 13F | Ade, Llc | 11 294 | 21,30 | 513 | 22,43 | ||||
| 2025-08-13 | 13F | Capital Analysts, Inc. | 1 695 | −10,84 | 0 | |||||
| 2025-08-14 | 13F | Stifel Financial Corp | 145 237 | 7,61 | 6 600 | 8,64 | ||||
| 2025-07-29 | 13F | Swmg, Llc | 42 563 | 2,27 | 1 924 | 3,39 | ||||
| 2025-08-12 | 13F | Integrated Advisors Network LLC | 5 906 | 268 | ||||||
| 2025-08-06 | 13F | Founders Financial Securities Llc | 39 458 | −14,03 | 1 793 | −12,80 | ||||
| 2025-08-11 | 13F | Cornerstone Planning Group LLC | 3 | 0,00 | 0 | |||||
| 2025-05-15 | 13F | Concorde Asset Management, LLC | 0 | −100,00 | 0 | |||||
| 2025-07-24 | 13F | Cyndeo Wealth Partners, LLC | 14 651 | 11,26 | 666 | 12,33 | ||||
| 2025-07-11 | 13F | Farther Finance Advisors, LLC | 29 703 | −19,81 | 1 350 | −18,93 | ||||
| 2025-07-25 | 13F | Midwest Capital Advisors, LLC | 544 | −67,52 | 25 | −68,00 | ||||
| 2025-07-15 | 13F | FLP Wealth Management, LLC | 0 | −100,00 | 0 | |||||
| 2025-08-12 | 13F | Proequities, Inc. | 0 | 0 | ||||||
| 2025-08-14 | 13F | Harwood Advisory Group, LLC | 0 | −100,00 | 0 | |||||
| 2025-08-14 | 13F | Peapack Gladstone Financial Corp | 59 620 | 2,32 | 3 | 0,00 | ||||
| 2025-07-28 | 13F | BRYN MAWR TRUST Co | 725 | 0,00 | 33 | 0,00 | ||||
| 2025-08-12 | 13F | LPL Financial LLC | 2 016 169 | 42,51 | 91 615 | 43,87 | ||||
| 2025-07-28 | 13F | RFG Advisory, LLC | 25 164 | 13,31 | 1 143 | 14,41 | ||||
| 2025-08-08 | 13F | Cetera Investment Advisers | 243 872 | 60,09 | 11 082 | 61,62 | ||||
| 2025-07-08 | 13F | Nbc Securities, Inc. | 594 | 0 | ||||||
| 2025-07-28 | 13F | Harbour Investments, Inc. | 98 181 | 1,75 | 4 461 | 2,74 | ||||
| 2025-08-14 | 13F | Sunbelt Securities, Inc. | 59 | −1,67 | 3 | 0,00 | ||||
| 2025-07-14 | 13F | Park Avenue Securities Llc | 148 338 | 87,24 | 7 | 100,00 | ||||
| 2025-08-26 | NP | EVVLX - The E-Valuator Very Conservative (0%-15%) RMS Fund Service Class Shares | 16 771 | 63,14 | 762 | 64,94 | ||||
| 2025-04-22 | 13F | Synergy Financial Management, LLC | 0 | −100,00 | 0 | |||||
| 2025-07-28 | 13F | Sagespring Wealth Partners, Llc | 27 461 | 24,32 | 1 248 | 25,45 | ||||
| 2025-08-14 | 13F | Atomi Financial Group, Inc. | 0 | −100,00 | 0 | |||||
| 2025-08-14 | 13F | Mercer Global Advisors Inc /adv | 13 249 | −53,32 | 602 | −52,86 | ||||
| 2025-04-01 | 13F | Oliver Lagore Vanvalin Investment Group | 0 | −100,00 | 0 | |||||
| 2025-07-18 | 13F | Precision Wealth Strategies, LLC | 5 063 | 230 | ||||||
| 2025-07-03 | 13F | CPA Asset Management LLC | 129 973 | 8,80 | 5 906 | 9,84 | ||||
| 2025-07-17 | 13F | Kelly Financial Services LLC | 59 595 | 2 708 | ||||||
| 2025-08-08 | 13F | Avantax Advisory Services, Inc. | 6 676 | 26,22 | 303 | 27,31 | ||||
| 2025-08-07 | 13F | 1620 Investment Advisors, Inc. | 14 740 | 5,66 | 670 | 6,70 | ||||
| 2025-08-12 | 13F | BlueStem Wealth Partners, LLC | 171 004 | −37,83 | 7 770 | −37,24 | ||||
| 2025-08-14 | 13F | Citadel Advisors Llc | 127 589 | 353,41 | 5 798 | 357,90 | ||||
| 2025-08-27 | 13F/A | Brinker Capital Investments, LLC | 10 383 | 472 | ||||||
| 2025-07-02 | 13F | Waller Financial Planning Group, Inc | 495 159 | 1,34 | 22 500 | 2,31 | ||||
| 2025-05-08 | 13F | Hoxton Planning & Management, LLC | 0 | −100,00 | 0 | |||||
| 2025-07-17 | 13F | Paradigm Financial Partners, Llc | 60 195 | 10,13 | 2 735 | 11,18 | ||||
| 2025-07-30 | 13F | LGT Financial Advisors LLC | 1 759 | 80 | ||||||
| 2025-07-22 | 13F | Accel Wealth Management | 67 138 | 4,52 | 3 051 | 5,50 | ||||
| 2025-07-23 | 13F | REAP Financial Group, LLC | 687 | 0,00 | 31 | 3,33 | ||||
| 2025-08-14 | 13F | Fmr Llc | 70 | −45,31 | 3 | −40,00 | ||||
| 2025-08-04 | 13F | Pensionmark Financial Group, Llc | 8 660 | 94,39 | 394 | 96,50 | ||||
| 2025-07-17 | 13F | Catalytic Wealth RIA, LLC | 11 709 | 10,32 | 532 | 11,53 | ||||
| 2025-08-14 | 13F | Comerica Bank | 5 562 | 38,91 | 253 | 40,00 | ||||
| 2025-07-31 | 13F | Forte Asset Management Llc | 20 852 | −22,10 | 948 | −21,35 | ||||
| 2025-08-13 | 13F | Mount Yale Investment Advisors, LLC | 510 | 23 | ||||||
| 2025-04-14 | 13F | RWM Asset Management, LLC | 0 | −100,00 | 0 | −100,00 | ||||
| 2025-07-14 | 13F | McGlone Suttner Wealth Management, Inc. | 272 605 | 3,93 | 12 387 | 4,93 | ||||
| 2025-08-06 | 13F | Convergence Financial, LLC | 27 810 | −3,19 | 1 264 | −2,24 | ||||
| 2025-07-24 | 13F | IFP Advisors, Inc | 109 511 | 71,18 | 4 976 | 72,84 | ||||
| 2025-07-23 | 13F | Dohj, Llc | 23 453 | −71,84 | 1 037 | −72,33 | ||||
| 2025-07-29 | 13F | Spirit Of America Management Corp/ny | 5 570 | 0,69 | 252 | 1,21 | ||||
| 2025-08-13 | 13F | GeoWealth Management, LLC | 11 762 | 10,82 | 534 | 11,95 | ||||
| 2025-08-11 | 13F | Principal Securities, Inc. | 2 407 | −17,54 | 109 | −15,50 | ||||
| 2025-08-12 | 13F | Coldstream Capital Management Inc | 0 | −100,00 | 0 | |||||
| 2025-04-30 | 13F | Phillips Financial Management, Llc | 0 | −100,00 | 0 | |||||
| 2025-08-05 | 13F | Dynasty Wealth Management, Llc | 42 514 | −2,53 | 1 932 | −1,63 | ||||
| 2025-07-21 | 13F | Cliftonlarsonallen Wealth Advisors, Llc | 519 201 | −15,08 | 23 592 | −14,26 | ||||
| 2025-08-14 | 13F | Goldman Sachs Group Inc | 86 656 | 1 105,40 | 3 938 | 1 118,89 | ||||
| 2025-08-06 | 13F | First Horizon Advisors, Inc. | 9 856 | 38,19 | 448 | 39,25 | ||||
| 2025-08-13 | 13F | West Wealth Group, LLC | 7 310 | 333 | ||||||
| 2025-08-15 | 13F | Kestra Advisory Services, LLC | 14 748 | 6,73 | 670 | 7,89 | ||||
| 2025-07-28 | 13F | Lunt Capital Management, Inc. | 75 261 | 2,59 | 3 420 | 3,57 | ||||
| 2025-04-15 | 13F | Collier Financial | 0 | −100,00 | 0 | |||||
| 2025-08-14 | 13F | GWM Advisors LLC | 17 609 | 1,74 | 800 | 2,83 | ||||
| 2025-08-04 | 13F | Twin City Private Wealth, Llc | 8 153 | 112,54 | 370 | 115,12 | ||||
| 2025-08-12 | 13F | Park Square Financial Group, LLC | 46 | 2 | ||||||
| 2025-04-23 | 13F | TSA Wealth Managment LLC | 0 | −100,00 | 0 | |||||
| 2025-05-15 | 13F | Sentinus, LLC | 0 | −100,00 | 0 | |||||
| 2025-07-28 | 13F | DORVAL Corp | 231 061 | 13,15 | 10 499 | 13,47 | ||||
| 2025-08-14 | 13F | Tennessee Valley Asset Management Partners | 0 | −100,00 | 0 | |||||
| 2025-08-26 | NP | EVCLX - The E-Valuator Conservative (15%-30%) RMS Fund Service Class Shares | 30 192 | −1,78 | 1 372 | −0,87 | ||||
| 2025-08-18 | 13F/A | National Bank Of Canada /fi/ | 19 547 | 28,99 | 888 | 30,40 | ||||
| 2025-07-29 | 13F | Private Trust Co Na | 419 | −13,79 | 19 | −9,52 | ||||
| 2025-05-08 | 13F | Arkadios Wealth Advisors | 0 | −100,00 | 0 | |||||
| 2025-07-31 | 13F | Leavell Investment Management, Inc. | 4 705 | −3,59 | 214 | −2,74 | ||||
| 2025-08-01 | 13F | Rossby Financial, LCC | 868 | 19,23 | 39 | 21,88 | ||||
| 2025-07-14 | 13F | AdvisorNet Financial, Inc | 553 | 0,00 | 25 | 4,17 | ||||
| 2025-08-19 | 13F | Cape Investment Advisory, Inc. | 97 | −43,60 | 4 | −42,86 | ||||
| 2025-08-05 | 13F | Sigma Planning Corp | 21 600 | −4,80 | 982 | −3,92 | ||||
| 2025-04-28 | 13F | Buffington Mohr McNeal | 5 875 | −83,90 | 264 | −83,69 | ||||
| 2025-07-23 | 13F | Ameliora Wealth Management Ltd. | 548 401 | 5,15 | 24 919 | 6,15 | ||||
| 2025-07-22 | 13F | Miracle Mile Advisors, LLC | 23 322 | 1 060 | ||||||
| 2025-08-04 | 13F | IFG Advisory, LLC | 5 967 | 16,82 | 271 | 18,34 | ||||
| 2025-08-04 | 13F | Atria Investments Llc | 48 626 | 3,56 | 2 210 | 4,54 | ||||
| 2025-08-14 | 13F | Bank Of America Corp /de/ | 1 132 007 | 88,20 | 51 438 | 90,00 | ||||
| 2025-08-05 | 13F | Bank of New York Mellon Corp | 184 007 | 14,58 | 8 361 | 15,68 | ||||
| 2025-08-06 | 13F | Vestmark Advisory Solutions, Inc. | 87 926 | 3 995 | ||||||
| 2025-07-30 | 13F | DecisionMap Wealth Management, LLC | 6 165 | −5,47 | 280 | −4,44 | ||||
| 2025-04-23 | 13F | Mascagni Wealth Management, Inc. | 0 | −100,00 | 0 | −100,00 | ||||
| 2025-08-04 | 13F | Assetmark, Inc | 157 095 | 7 138 | ||||||
| 2025-08-14 | 13F/A | Rockefeller Capital Management L.P. | 37 499 | 136,02 | 1 704 | 138,18 | ||||
| 2025-05-15 | 13F | Hrt Financial Lp | 0 | −100,00 | 0 | |||||
| 2025-08-14 | 13F | Snowden Capital Advisors LLC | 9 352 | −5,99 | 425 | −5,15 | ||||
| 2025-08-13 | 13F | Jones Financial Companies Lllp | 38 | 2 | ||||||
| 2025-08-14 | 13F | Betterment LLC | 687 332 | 8,26 | 31 | 10,71 | ||||
| 2025-04-21 | 13F | Nelson, Van Denburg & Campbell Wealth Management Group, LLC | 0 | −100,00 | 0 | |||||
| 2025-07-24 | 13F | Certus Wealth Management, LLC | 5 997 | −0,23 | 273 | 2,26 | ||||
| 2025-08-11 | 13F | Private Advisor Group, LLC | 234 158 | 3,58 | 10 640 | 4,57 | ||||
| 2025-08-08 | 13F | Capital Investment Advisory Services, LLC | 126 | 1,61 | 6 | 0,00 | ||||
| 2025-08-12 | 13F | Jpmorgan Chase & Co | 317 402 | 47,00 | 14 423 | 48,41 | ||||
| 2025-08-07 | 13F | Resources Investment Advisors, LLC. | 731 608 | 17,14 | 33 244 | 18,26 |
Other Listings
| MX:IGEB |