Grundläggande statistik
| Institutionella ägare | 175 total, 175 long only, 0 short only, 0 long/short - change of 2,33% MRQ |
| Genomsnittlig portföljallokering | 0.2910 % - change of −20,11% MRQ |
| Institutionella aktier (lång) | 3 949 059 (ex 13D/G) - change of 0,14MM shares 3,65% MRQ |
| Institutionellt värde (lång) | $ 491 611 USD ($1000) |
Institutionellt ägande och aktieägare
iShares Trust - iShares U.S. Insurance ETF (US:IAK) har 175 Institutionella ägare och aktieägare som har lämnat in 13D/G- eller 13F-formulär till Securities Exchange Commission (SEC). Dessa institut innehar totalt 3,949,059 aktier. Största aktieägare inkluderar Morgan Stanley, Wells Fargo & Company/mn, Mml Investors Services, Llc, Miracle Mile Advisors, LLC, LPL Financial LLC, SPC Financial, Inc., Stifel Financial Corp, Royal Bank Of Canada, Advisor Group Holdings, Inc., and Bank Of America Corp /de/ .
iShares Trust - iShares U.S. Insurance ETF (ARCA:IAK) Institutionell ägarstruktur visar institutioners och fonders nuvarande positioner i företaget, samt de senaste förändringarna i positionernas storlek. Större aktieägare kan vara enskilda investerare, fonder, hedgefonder eller institutioner. Bilaga 13D visar att investeraren äger (eller ägde) mer än 5% av företaget och avser (eller avsåg) att aktivt eftersträva en förändring av affärsstrategin. Schedule 13G indikerar en passiv investering på över 5%.
The share price as of September 12, 2025 is 133,67 / share. Previously, on September 16, 2024, the share price was 129,37 / share. This represents an increase of 3,32% over that period.

Fondsentimentets poäng
Fondsentimentet poängen(fka Ägarackumulation-poäng) visar vilka aktier som är mest köpta av fonder. Det är resultatet av en sofistikerad kvantitativ flerfaktormodell som identifierar företag med de högsta nivåerna av institutionell ackumulering. Poängsättningsmodellen använder en kombination av den totala ökningen av redovisade ägare, förändringarna i portföljallokeringarna för dessa ägare och andra mått. Siffran sträcker sig från 0 till 100, där högre siffror indikerar en högre nivå av ackumulering i förhållande till sina konkurrenter, och 50 är genomsnittet.
Uppdateringsfrekvens: Dagligen
Se Ownership Explorer, som innehåller en lista över de högst rankade företagen.
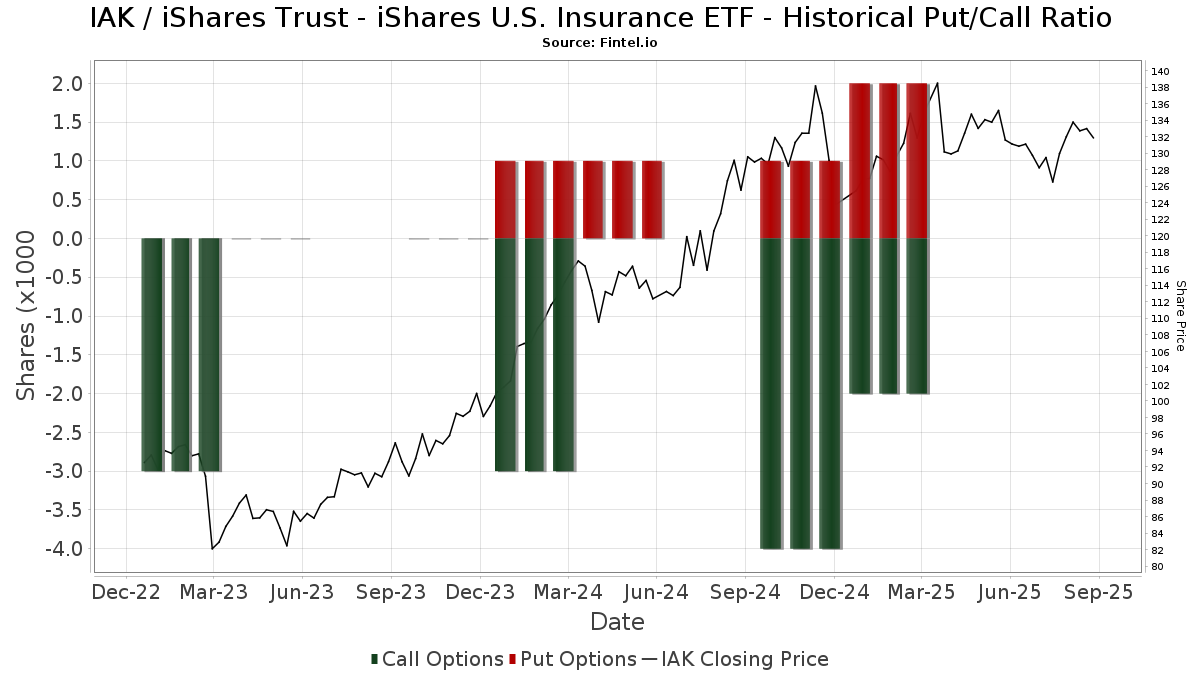
Institutionell sälj/köp-kvot
Förutom att rapportera vanliga eget kapital- och skuldemissioner måste institutioner med mer än 100MM tillgångar under förvaltning också avslöja sina innehav av sälj- och köpoptioner. Eftersom säljoptioner i allmänhet indikerar ett negativt sentiment och köpoptioner indikerar ett positivt sentiment, kan vi få en uppfattning om det övergripande institutionella sentimentet genom att plotta förhållandet mellan säljoptioner och köpoptioner. Diagrammet till höger visar det historiska förhållandet mellan sälj- och köpoptioner för detta instrument.
Genom att använda sälj/köp-kvoten som en indikator på aktieägarnas sentiment undviker man en av de största bristerna med att använda det totala institutionella ägandet, nämligen att en betydande del av de förvaltade tillgångarna investeras passivt för att följa index. Passivt förvaltade fonder köper vanligtvis inte optioner, så indikatorn för sälj/köp-kvoten ger en bättre bild av stämningen i aktivt förvaltade fonder.
13F- och NPORT-arkiveringar
Detaljer om 13F-arkiveringar är gratis. Detaljer om NP-arkiveringar kräver ett premiummedlemskap. Gröna rader indikerar nya positioner. Röda rader indikerar stängda positioner. Klicka på länk symbolen för att se hela transaktionshistoriken.
Uppgradera
för att låsa upp premiumdata och exportera till Excel ![]() .
.
| Fil Datum | Källa | Investerare | Typ | Genomsnittligt pris (beräknat) |
Aktier | Δ Aktier (%) |
Rapporterat värde (1000 USD) |
Δ Värde (%) |
Portföljallokering (%) |
|
|---|---|---|---|---|---|---|---|---|---|---|
| 2025-08-18 | 13F | Geneos Wealth Management Inc. | 9 829 | −54,25 | 1 322 | −55,37 | ||||
| 2025-08-14 | 13F | Chicago Wealth Management, Inc. | 14 345 | −52,83 | 1 929 | −53,99 | ||||
| 2025-08-08 | 13F | SG Americas Securities, LLC | 1 881 | 0 | ||||||
| 2025-07-22 | 13F | Miracle Mile Advisors, LLC | 218 926 | 94,11 | 29 437 | 89,38 | ||||
| 2025-07-22 | 13F | Bank Hapoalim Bm | 3 260 | 1,56 | 0 | |||||
| 2025-08-14 | 13F | Tudor Financial Inc. | 23 759 | −2,89 | 3 195 | −5,25 | ||||
| 2025-08-14 | 13F | GWM Advisors LLC | 26 783 | 9,08 | 3 601 | 6,44 | ||||
| 2025-05-07 | 13F | LPL Financial LLC | Call | 0 | −100,00 | 0 | −100,00 | |||
| 2025-07-14 | 13F | Sowell Financial Services LLC | 1 762 | −18,58 | 237 | −20,81 | ||||
| 2025-08-14 | 13F | Wells Fargo & Company/mn | 227 411 | −12,35 | 30 578 | −14,48 | ||||
| 2025-08-11 | 13F | Y.D. More Investments Ltd | 630 | 0,00 | 85 | −2,33 | ||||
| 2025-08-11 | 13F | Ironsides Asset Advisors, LLC | 0 | −100,00 | 0 | |||||
| 2025-08-26 | NP | LCR - Leuthold Core ETF | 6 805 | 2,62 | 915 | 0,22 | ||||
| 2025-08-04 | 13F | Arkadios Wealth Advisors | 4 179 | 562 | ||||||
| 2025-08-14 | 13F | Sunbelt Securities, Inc. | 0 | −100,00 | 0 | |||||
| 2025-08-12 | 13F | Steward Partners Investment Advisory, Llc | 5 615 | 28,64 | 755 | 25,46 | ||||
| 2025-08-04 | 13F | IFG Advisory, LLC | 5 596 | −3,63 | 752 | −6,00 | ||||
| 2025-08-11 | 13F | Private Advisor Group, LLC | 4 461 | −83,01 | 600 | −83,44 | ||||
| 2025-07-22 | 13F | DAVENPORT & Co LLC | 4 615 | 12,84 | 621 | 10,12 | ||||
| 2025-08-14 | 13F | Stifel Financial Corp | 143 014 | 16,51 | 19 231 | 13,68 | ||||
| 2025-08-08 | 13F | Tortoise Investment Management, LLC | 314 | 0,00 | 42 | −2,33 | ||||
| 2025-08-13 | 13F | Russell Investments Group, Ltd. | 889 | 0,00 | 120 | −2,46 | ||||
| 2025-08-06 | 13F | Moors & Cabot, Inc. | 0 | −100,00 | 0 | |||||
| 2025-08-08 | 13F | L & S Advisors Inc | 2 045 | −0,63 | 275 | −3,18 | ||||
| 2025-08-12 | 13F | Retirement Planning Co of New England, Inc. | 4 303 | −0,76 | 579 | −3,18 | ||||
| 2025-08-13 | 13F | AMJ Financial Wealth Management | 0 | −100,00 | 0 | |||||
| 2025-08-08 | 13F | Woodley Farra Manion Portfolio Management Inc | 1 911 | 4,65 | 257 | 1,99 | ||||
| 2025-07-25 | 13F | Muirfield Wealth Advisors Llc | 4 376 | −8,28 | 588 | −10,50 | ||||
| 2025-08-14 | 13F | Goldman Sachs Group Inc | 33 847 | 20,77 | 4 551 | 17,84 | ||||
| 2025-07-11 | 13F | Diversified Trust Co | 0 | −100,00 | 0 | |||||
| 2025-08-14 | 13F | Mariner, LLC | 22 362 | 3,39 | 3 007 | 0,87 | ||||
| 2025-07-25 | 13F | Prostatis Group LLC | 0 | −100,00 | 0 | |||||
| 2025-07-10 | 13F | Exchange Traded Concepts, Llc | 379 | 51 | ||||||
| 2025-05-15 | 13F | Baird Financial Group, Inc. | 0 | −100,00 | 0 | |||||
| 2025-07-30 | 13F | WESPAC Advisors SoCal, LLC | 89 592 | 35,94 | 12 047 | 32,64 | ||||
| 2025-08-05 | 13F | Bank Of Montreal /can/ | 667 | 1,99 | 90 | −1,11 | ||||
| 2025-07-23 | 13F | WESPAC Advisors, LLC | 1 658 | 223 | ||||||
| 2025-08-14 | 13F | CIBC World Markets Inc. | 11 755 | 1,86 | 1 581 | −0,63 | ||||
| 2025-07-31 | 13F | Cambridge Investment Research Advisors, Inc. | 23 175 | 5,90 | 3 | 0,00 | ||||
| 2025-07-31 | 13F/A | Interchange Capital Partners, LLC | 2 150 | −1,38 | 289 | −2,36 | ||||
| 2025-07-16 | 13F | Minichmacgregor Wealth Management, Llc | 69 142 | 26,20 | 9 297 | 23,13 | ||||
| 2025-07-08 | 13F | Zrc Wealth Management, Llc | 154 | 48,08 | 21 | 42,86 | ||||
| 2025-08-18 | 13F | Hollencrest Capital Management | 0 | −100,00 | 0 | |||||
| 2025-08-12 | 13F | Global Retirement Partners, LLC | 212 | −8,23 | 29 | −3,45 | ||||
| 2025-07-10 | 13F | Capital Advisory Group Advisory Services, LLC | 26 406 | 0,98 | 3 551 | −1,47 | ||||
| 2025-08-18 | NP | A3 Alternative Credit Fund | 0 | −100,00 | 0 | −100,00 | ||||
| 2025-04-23 | 13F | Saxony Capital Management, LLC | 0 | −100,00 | 0 | −100,00 | ||||
| 2025-05-08 | 13F | Essential Planning, LLC. | 0 | −100,00 | 0 | |||||
| 2025-08-19 | 13F | National Asset Management, Inc. | 1 652 | 222 | ||||||
| 2025-05-07 | 13F | Spectrum Wealth Counsel, LLC | 71 539 | 20,78 | 9 859 | 31,60 | ||||
| 2025-07-28 | 13F | Harbour Investments, Inc. | 0 | −100,00 | 0 | |||||
| 2025-08-19 | 13F | Delos Wealth Advisors, LLC | 6 999 | −9,10 | 941 | −11,31 | ||||
| 2025-07-17 | 13F | Park Place Capital Corp | 0 | −100,00 | 0 | |||||
| 2025-07-17 | 13F | Janney Montgomery Scott LLC | 22 049 | 60,07 | 3 | 100,00 | ||||
| 2025-08-08 | 13F | WASHINGTON TRUST Co | 0 | −100,00 | 0 | |||||
| 2025-07-15 | 13F | Well Done, LLC | 41 990 | 11,30 | 5 646 | 18,32 | ||||
| 2025-08-14 | 13F | Federation des caisses Desjardins du Quebec | 48 550 | 1,05 | 6 528 | −1,39 | ||||
| 2025-08-06 | 13F | AE Wealth Management LLC | 217 | 0,00 | 29 | 0,00 | ||||
| 2025-07-31 | 13F | Wealthfront Advisers Llc | 1 754 | 7,74 | 236 | 4,91 | ||||
| 2025-08-12 | 13F | Councilmark Asset Management, LLC | 1 625 | 0,00 | 218 | −2,24 | ||||
| 2025-07-15 | 13F | Financial Management Professionals, Inc. | 7 674 | 1 032 | ||||||
| 2025-07-21 | 13F | Ameritas Advisory Services, LLC | 306 | 41 | ||||||
| 2025-08-11 | 13F | Tidemark, LLC | 91 | 0,00 | 12 | 0,00 | ||||
| 2025-08-14 | 13F | Ieq Capital, Llc | 2 000 | 0,00 | 269 | −2,55 | ||||
| 2025-08-19 | 13F | Advisory Services Network, LLC | 106 596 | 8,94 | 13 588 | 0,76 | ||||
| 2025-08-07 | 13F | PFG Advisors | 0 | −100,00 | 0 | |||||
| 2025-07-24 | 13F | Us Bancorp \de\ | 4 227 | −3,43 | 568 | −5,80 | ||||
| 2025-08-07 | 13F | Efficient Advisors, LLC | 4 504 | 606 | ||||||
| 2025-08-14 | 13F | CoreCap Advisors, LLC | 4 185 | 563 | ||||||
| 2025-08-07 | 13F | Allworth Financial LP | 8 069 | −14,71 | 1 085 | −12,43 | ||||
| 2025-08-06 | 13F | Commonwealth Equity Services, Llc | 9 246 | −86,59 | 1 | −88,89 | ||||
| 2025-08-12 | 13F | Proequities, Inc. | 0 | 0 | ||||||
| 2025-08-14 | 13F | Hilltop Holdings Inc. | 1 583 | −2,82 | 213 | −5,36 | ||||
| 2025-08-01 | 13F | Advisory Alpha, LLC | 1 491 | 1,22 | 201 | −0,99 | ||||
| 2025-08-08 | 13F | Fortis Group Advisors, LLC | 5 962 | −39,14 | 760 | −43,78 | ||||
| 2025-08-13 | 13F | Leuthold Group, Llc | 7 308 | 2,65 | 983 | 0,10 | ||||
| 2025-08-05 | 13F | Hills Bank & Trust Co | 13 694 | −2,53 | 1 841 | −4,91 | ||||
| 2025-08-11 | 13F | Outlook Wealth Advisors, LLC | 11 679 | 1 570 | ||||||
| 2025-08-06 | 13F | Legacy Wealth Managment, LLC/ID | 27 | 0,00 | 4 | 0,00 | ||||
| 2025-05-12 | 13F | Owen LaRue, LLC | 0 | −100,00 | 0 | |||||
| 2025-05-15 | 13F | Syon Capital Llc | 0 | −100,00 | 0 | |||||
| 2025-08-14 | 13F | Bramshill Investments, LLC | 7 500 | 1 008 | ||||||
| 2025-07-24 | 13F | Blair William & Co/il | 177 | 704,55 | 24 | 666,67 | ||||
| 2025-07-25 | 13F | Atria Wealth Solutions, Inc. | 0 | −100,00 | 0 | |||||
| 2025-07-29 | 13F | Stephens Inc /ar/ | 3 385 | 0,21 | 455 | −2,15 | ||||
| 2025-08-06 | 13F | Founders Financial Securities Llc | 36 444 | 0,32 | 4 900 | 3,16 | ||||
| 2025-08-29 | 13F | Centaurus Financial, Inc. | 0 | −100,00 | 0 | |||||
| 2025-07-23 | 13F | Kingswood Wealth Advisors, Llc | 4 988 | 3,10 | 671 | 0,60 | ||||
| 2025-08-12 | 13F | Founders Financial Alliance, LLC | 0 | −100,00 | 0 | |||||
| 2025-08-14 | 13F | Fmr Llc | 1 905 | 9,04 | 256 | 6,67 | ||||
| 2025-08-18 | 13F | Castleark Management Llc | 54 070 | 0,00 | 7 270 | −2,43 | ||||
| 2025-09-04 | 13F/A | Advisor Group Holdings, Inc. | 129 238 | 58,62 | 17 377 | 54,76 | ||||
| 2025-08-14 | 13F | Glenview Trust Co | 2 350 | 0,00 | 316 | −2,48 | ||||
| 2025-07-25 | 13F | Genesee Capital Advisors, LLC | 10 568 | 65,64 | 1 421 | 61,66 | ||||
| 2025-08-25 | 13F | Fulcrum Equity Management | 6 351 | 854 | ||||||
| 2025-08-08 | 13F | Beacon Harbor Wealth Advisors, Inc. | 0 | −100,00 | 0 | |||||
| 2025-08-06 | 13F | Prospera Financial Services Inc | 71 910 | 7,33 | 9 669 | 4,71 | ||||
| 2025-08-14 | 13F | Citadel Advisors Llc | 3 716 | −83,46 | 500 | −83,88 | ||||
| 2025-08-13 | 13F | VestGen Advisors, LLC | 15 648 | 13,59 | 2 104 | 10,85 | ||||
| 2025-08-14 | 13F | Mml Investors Services, Llc | 218 944 | 48,78 | 29 | 45,00 | ||||
| 2025-08-13 | 13F | Summit Financial, LLC | 3 444 | −34,99 | 463 | −36,58 | ||||
| 2025-08-14 | 13F | UBS Group AG | 70 845 | −2,61 | 9 526 | −4,98 | ||||
| 2025-07-30 | 13F | TFB Advisors LLC | 2 720 | −15,32 | 366 | −17,42 | ||||
| 2025-08-14 | 13F | Royal Bank Of Canada | 132 205 | 11,62 | 17 776 | 8,90 | ||||
| 2025-08-01 | 13F | Redwood Park Advisors LLC | 349 | 0,29 | 47 | −2,13 | ||||
| 2025-08-07 | 13F | Kestra Private Wealth Services, Llc | 9 350 | 0,14 | 1 257 | −2,26 | ||||
| 2025-08-12 | 13F | Bokf, Na | 174 | 0,00 | 23 | 0,00 | ||||
| 2025-08-14 | 13F | KKM Financial LLC | 9 061 | 0,00 | 1 218 | −2,40 | ||||
| 2025-08-15 | 13F | Equitable Holdings, Inc. | 15 477 | −3,10 | 2 081 | −5,45 | ||||
| 2025-07-29 | 13F | Stratos Wealth Partners, LTD. | 0 | −100,00 | 0 | |||||
| 2025-08-06 | 13F | SP Asset Management LLC | 19 505 | 0,10 | 2 623 | −2,35 | ||||
| 2025-07-16 | 13F | Cadent Capital Advisors, LLC | 38 582 | 0,63 | 5 188 | −1,82 | ||||
| 2025-07-28 | 13F | RFG Advisory, LLC | 26 354 | 25,59 | 3 544 | 22,55 | ||||
| 2025-07-24 | 13F | IFP Advisors, Inc | 22 | −87,43 | 3 | −87,50 | ||||
| 2025-08-06 | 13F | First Horizon Advisors, Inc. | 2 044 | −32,18 | 275 | −33,98 | ||||
| 2025-07-16 | 13F | Perigon Wealth Management, LLC | 8 975 | 88,71 | 1 207 | 84,12 | ||||
| 2025-08-04 | 13F | Creative Financial Designs Inc /adv | 100 | 0,00 | 13 | 0,00 | ||||
| 2025-07-08 | 13F | Nbc Securities, Inc. | 965 | 0,00 | 0 | |||||
| 2025-08-14 | 13F | Raymond James Financial Inc | 94 246 | 64,02 | 12 672 | 60,04 | ||||
| 2025-07-23 | 13F | High Note Wealth, LLC | 15 | 0,00 | 2 | 0,00 | ||||
| 2025-08-14 | 13F | Bank Of America Corp /de/ | 123 116 | 6,67 | 16 554 | 4,08 | ||||
| 2025-08-01 | 13F | Envestnet Asset Management Inc | 3 038 | 37,40 | 408 | 34,21 | ||||
| 2025-08-01 | 13F/A | GGM Financials LLC | 63 563 | 3,25 | 8 547 | 0,73 | ||||
| 2025-08-14 | 13F | Bnp Paribas Arbitrage, Sa | 0 | −100,00 | 0 | |||||
| 2025-07-09 | 13F | Bulwark Capital Corp | 1 185 | 159 | ||||||
| 2025-08-01 | 13F | Ashton Thomas Private Wealth, LLC | 0 | −100,00 | 0 | |||||
| 2025-08-14 | 13F | Cardiff Park Advisors, Llc | 3 500 | 0,00 | 471 | −2,49 | ||||
| 2025-09-10 | 13F | WT Wealth Management | 4 158 | −6,46 | 559 | −8,66 | ||||
| 2025-05-15 | 13F | Two Sigma Securities, Llc | 0 | −100,00 | 0 | |||||
| 2025-07-28 | 13F | Duncker Streett & Co Inc | 53 | 0,00 | 7 | 0,00 | ||||
| 2025-08-13 | 13F | Jones Financial Companies Lllp | 7 027 | 34,95 | 934 | 31,59 | ||||
| 2025-08-08 | 13F | Larson Financial Group LLC | 1 976 | 6,98 | 266 | 4,33 | ||||
| 2025-08-12 | 13F | J.w. Cole Advisors, Inc. | 12 816 | 1 723 | ||||||
| 2025-07-21 | 13F | Jmac Enterprises Llc | 31 547 | 4 242 | ||||||
| 2025-08-14 | 13F | Colony Group, LLC | 31 776 | 4 273 | ||||||
| 2025-07-29 | 13F | Cottonwood Capital Advisors, Llc | 23 537 | 1,00 | 3 165 | −1,46 | ||||
| 2025-07-25 | 13F | Concurrent Investment Advisors, LLC | 1 704 | 9,72 | 229 | 7,01 | ||||
| 2025-04-30 | 13F | Silverlake Wealth Management Llc | 0 | −100,00 | 0 | |||||
| 2025-07-29 | 13F | Private Trust Co Na | 0 | −100,00 | 0 | |||||
| 2025-08-12 | 13F | LPL Financial LLC | 185 155 | 15,86 | 24 896 | 13,04 | ||||
| 2025-07-10 | 13F | Ferguson Wellman Capital Management, Inc | 2 360 | 0,00 | 317 | −2,46 | ||||
| 2025-08-12 | 13F | Jpmorgan Chase & Co | 50 | −31,51 | 7 | −40,00 | ||||
| 2025-08-04 | 13F | Atria Investments Llc | 7 827 | −5,12 | 1 052 | −7,39 | ||||
| 2025-08-14 | 13F | Wiley Bros.-aintree Capital, Llc | 6 608 | −7,06 | 889 | −8,26 | ||||
| 2025-07-21 | 13F | Jackson Wealth Management, LLC | 0 | −100,00 | 0 | |||||
| 2025-08-08 | 13F | Cetera Investment Advisers | 6 050 | −18,50 | 813 | −20,53 | ||||
| 2025-05-19 | 13F | Heck Capital Advisors, LLC | 0 | −100,00 | 0 | −100,00 | ||||
| 2025-08-13 | 13F | Flow Traders U.s. Llc | 4 991 | 1 | ||||||
| 2025-08-06 | 13F | Csenge Advisory Group | 2 784 | 0,00 | 379 | 5,28 | ||||
| 2025-08-08 | 13F | Gts Securities Llc | 25 040 | −11,75 | 3 367 | −13,91 | ||||
| 2025-05-15 | 13F | Hrt Financial Lp | 0 | −100,00 | 0 | |||||
| 2025-08-13 | 13F | Baker Avenue Asset Management, LP | 1 633 | 220 | ||||||
| 2025-08-18 | 13F/A | National Bank Of Canada /fi/ | 161 | 7,33 | 22 | 5,00 | ||||
| 2025-07-22 | 13F | Belpointe Asset Management LLC | 5 041 | 7,85 | 678 | 5,12 | ||||
| 2025-07-23 | 13F | Dohj, Llc | 2 140 | 279 | ||||||
| 2025-08-11 | 13F | HighTower Advisors, LLC | 9 065 | 185,87 | 1 219 | 179,36 | ||||
| 2025-08-08 | 13F | Pnc Financial Services Group, Inc. | 80 | 11 | ||||||
| 2025-08-01 | 13F | Chilton Capital Management Llc | 168 | 0,00 | 23 | −4,35 | ||||
| 2025-08-13 | 13F | Marshall Wace, Llp | 0 | −100,00 | 0 | |||||
| 2025-08-12 | 13F | CIBC Private Wealth Group, LLC | 0 | 0 | ||||||
| 2025-08-13 | 13F | Northwestern Mutual Wealth Management Co | 865 | −9,04 | 116 | −11,45 | ||||
| 2025-07-14 | 13F | AdvisorNet Financial, Inc | 802 | −4,18 | 108 | −6,96 | ||||
| 2025-08-11 | 13F | Principal Securities, Inc. | 8 | −11,11 | 1 | 0,00 | ||||
| 2025-07-15 | 13F | Tepp RIA, LLC | 15 272 | −40,56 | 2 054 | −42,01 | ||||
| 2025-07-23 | 13F | Eagle Strategies LLC | 13 972 | 2,79 | 1 879 | 0,27 | ||||
| 2025-07-23 | 13F | Winthrop Advisory Group LLC | 3 722 | 7,82 | 500 | 5,26 | ||||
| 2025-08-08 | 13F | Avantax Advisory Services, Inc. | 18 067 | 6,45 | 2 429 | 3,89 | ||||
| 2025-07-11 | 13F | Farther Finance Advisors, LLC | 553 | 84,33 | 74 | 80,49 | ||||
| 2025-08-13 | 13F | Martin & Co Inc /tn/ | 27 079 | 0,31 | 3 641 | −2,15 | ||||
| 2025-07-07 | 13F | Nova Wealth Management, Inc. | 2 059 | −1,91 | 277 | −4,50 | ||||
| 2025-07-31 | 13F | Lee Danner & Bass Inc | 38 338 | 13,61 | 5 155 | 10,84 | ||||
| 2025-08-08 | 13F | Adapt Wealth Advisors, Llc | 64 165 | 3,32 | 8 628 | 0,81 | ||||
| 2025-07-10 | 13F | Focus Financial Network, Inc. | 1 854 | −36,44 | 249 | −38,06 | ||||
| 2025-08-19 | 13F | Newbridge Financial Services Group, Inc. | 149 | 20 | ||||||
| 2025-07-30 | 13F | Sonata Capital Group Inc | 3 800 | −5,00 | 1 | |||||
| 2025-08-08 | 13F | Capital Investment Advisory Services, LLC | 13 | 2 | ||||||
| 2025-08-14 | 13F | Susquehanna International Group, Llp | 14 854 | −11,30 | 1 997 | −13,44 | ||||
| 2025-07-24 | 13F | Game Plan Financial Advisors, LLC | 19 655 | 77,63 | 2 643 | 73,36 | ||||
| 2025-07-22 | 13F | Coastal Investment Advisors, Inc. | 285 | 38 | ||||||
| 2025-08-08 | 13F | Creative Planning | 1 933 | 21,50 | 260 | 18,26 | ||||
| 2025-05-13 | 13F | Aptus Capital Advisors, LLC | 0 | −100,00 | 0 | |||||
| 2025-08-06 | 13F | Legacy Investment Solutions, LLC | 27 | 0,00 | 4 | 0,00 | ||||
| 2025-07-25 | 13F | SPC Financial, Inc. | 157 319 | −3,98 | 21 153 | −6,31 | ||||
| 2025-07-16 | 13F | Legend Financial Advisors, Inc. | 50 879 | −1,44 | 6 841 | −3,84 | ||||
| 2025-07-29 | 13F | Harbor Asset Planning, Inc. | 731 | 98 | ||||||
| 2025-08-12 | 13F | Sfmg, Llc | 4 705 | 0,00 | 633 | −2,47 | ||||
| 2025-08-13 | 13F | GeoWealth Management, LLC | 3 909 | −69,12 | 526 | −69,90 | ||||
| 2025-08-14 | 13F | Jane Street Group, Llc | 15 224 | −36,32 | 2 047 | −37,86 | ||||
| 2025-07-30 | 13F | Strategic Blueprint, LLC | 3 138 | 422 | ||||||
| 2025-08-14 | 13F | Qube Research & Technologies Ltd | 128 | −90,74 | 17 | −91,05 | ||||
| 2025-08-14 | 13F | Two Sigma Investments, Lp | 85 600 | 11 510 | ||||||
| 2025-07-18 | 13F | Truist Financial Corp | 1 933 | 260 | ||||||
| 2025-07-30 | 13F | Fiduciary Planning LLC | 52 718 | −7,22 | 7 088 | −9,48 | ||||
| 2025-08-15 | 13F | Morgan Stanley | 309 794 | −12,11 | 41 655 | −14,24 | ||||
| 2025-07-16 | 13F | ORG Partners LLC | 149 | 73,26 | 20 | 81,82 | ||||
| 2025-08-07 | 13F | Montag A & Associates Inc | 0 | −100,00 | 0 | |||||
| 2025-08-14 | 13F | Redwood Financial Network Corp | 1 657 | 223 | ||||||
| 2025-07-31 | 13F | Oppenheimer & Co Inc | 0 | −100,00 | 0 | |||||
| 2025-08-14 | 13F | Old Mission Capital Llc | 2 847 | −17,05 | 383 | −19,07 | ||||
| 2025-08-07 | 13F | Apeiron RIA LLC | 5 446 | −1,02 | 732 | −3,43 | ||||
| 2025-08-14 | 13F | Comerica Bank | 257 | −89,69 | 35 | −90,09 | ||||
| 2025-08-06 | 13F | Stonebridge Financial Planning Group, LLC | 17 191 | −0,57 | 2 312 | −2,98 | ||||
| 2025-08-15 | 13F | Tower Research Capital LLC (TRC) | 9 654 | 53,46 | 1 298 | 49,88 | ||||
| 2025-08-01 | 13F | Belvedere Trading LLC | Call | 0 | −100,00 | 0 | ||||
| 2025-05-15 | 13F | Wolverine Trading, Llc | 0 | −100,00 | 0 | |||||
| 2025-08-04 | 13F | Spire Wealth Management | 2 330 | 12,24 | 313 | 9,44 | ||||
| 2025-05-15 | 13F | D. E. Shaw & Co., Inc. | 0 | −100,00 | 0 | |||||
| 2025-08-01 | 13F | Belvedere Trading LLC | Put | 0 | −100,00 | 0 | ||||
| 2025-07-28 | 13F | Copia Wealth Management | 1 403 | 55,20 | 189 | 51,61 | ||||
| 2025-08-12 | 13F | AlphaCore Capital LLC | 3 158 | 0,00 | 425 | −2,53 | ||||
| 2025-08-14 | 13F | Great Valley Advisor Group, Inc. | 12 398 | 1,24 | 1 667 | −1,19 | ||||
| 2025-07-17 | 13F | Smith Anglin Financial, LLC | 8 862 | −7,16 | 1 192 | −9,43 | ||||
| 2025-08-01 | 13F | Belvedere Trading LLC | 0 | −100,00 | 0 | |||||
| 2025-07-10 | 13F | Oliver Lagore Vanvalin Investment Group | 20 | 3 | ||||||
| 2025-07-17 | 13F | Lee Johnson Capital Management, Llc | 9 779 | 1 315 | ||||||
| 2025-07-23 | 13F | Foresight Capital Management Advisors, Inc. | 2 232 | 300 | ||||||
| 2025-07-22 | 13F | Elevate Capital Advisors, LLC | 5 125 | 689 |
Other Listings
| MX:IAK |