Grundläggande statistik
| Institutionella ägare | 228 total, 228 long only, 0 short only, 0 long/short - change of −5,74% MRQ |
| Genomsnittlig portföljallokering | 0.3976 % - change of −12,68% MRQ |
| Institutionella aktier (lång) | 12 480 920 (ex 13D/G) - change of 2,33MM shares 22,90% MRQ |
| Institutionellt värde (lång) | $ 865 881 USD ($1000) |
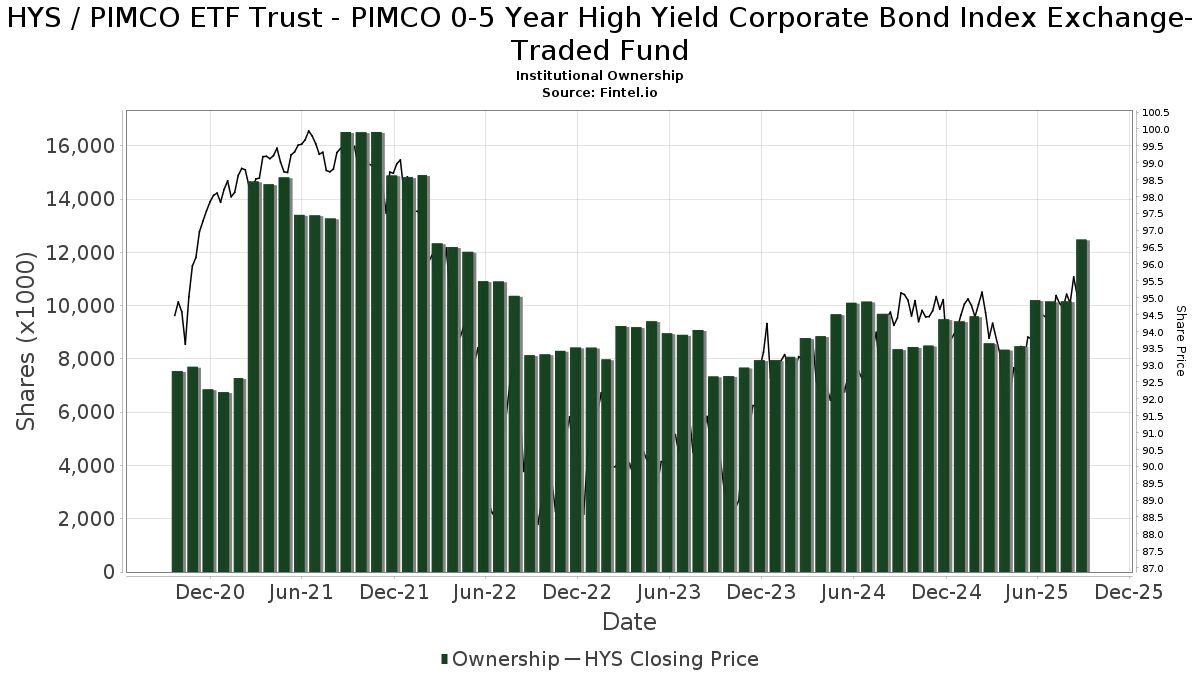
Institutionellt ägande och aktieägare
PIMCO ETF Trust - PIMCO 0-5 Year High Yield Corporate Bond Index Exchange-Traded Fund (US:HYS) har 228 Institutionella ägare och aktieägare som har lämnat in 13D/G- eller 13F-formulär till Securities Exchange Commission (SEC). Dessa institut innehar totalt 12,480,920 aktier. Största aktieägare inkluderar Proficio Capital Partners LLC, Allianz Asset Management GmbH, Morgan Stanley, Assetmark, Inc, BOND - PIMCO Active Bond Exchange-Traded Fund, Envestnet Asset Management Inc, Jpmorgan Chase & Co, Pnc Financial Services Group, Inc., Mid-American Wealth Advisory Group, Inc., and LPL Financial LLC .
PIMCO ETF Trust - PIMCO 0-5 Year High Yield Corporate Bond Index Exchange-Traded Fund (ARCA:HYS) Institutionell ägarstruktur visar institutioners och fonders nuvarande positioner i företaget, samt de senaste förändringarna i positionernas storlek. Större aktieägare kan vara enskilda investerare, fonder, hedgefonder eller institutioner. Bilaga 13D visar att investeraren äger (eller ägde) mer än 5% av företaget och avser (eller avsåg) att aktivt eftersträva en förändring av affärsstrategin. Schedule 13G indikerar en passiv investering på över 5%.
The share price as of September 12, 2025 is 95,48 / share. Previously, on September 16, 2024, the share price was 94,87 / share. This represents an increase of 0,64% over that period.
Fondsentimentets poäng
Fondsentimentet poängen(fka Ägarackumulation-poäng) visar vilka aktier som är mest köpta av fonder. Det är resultatet av en sofistikerad kvantitativ flerfaktormodell som identifierar företag med de högsta nivåerna av institutionell ackumulering. Poängsättningsmodellen använder en kombination av den totala ökningen av redovisade ägare, förändringarna i portföljallokeringarna för dessa ägare och andra mått. Siffran sträcker sig från 0 till 100, där högre siffror indikerar en högre nivå av ackumulering i förhållande till sina konkurrenter, och 50 är genomsnittet.
Uppdateringsfrekvens: Dagligen
Se Ownership Explorer, som innehåller en lista över de högst rankade företagen.
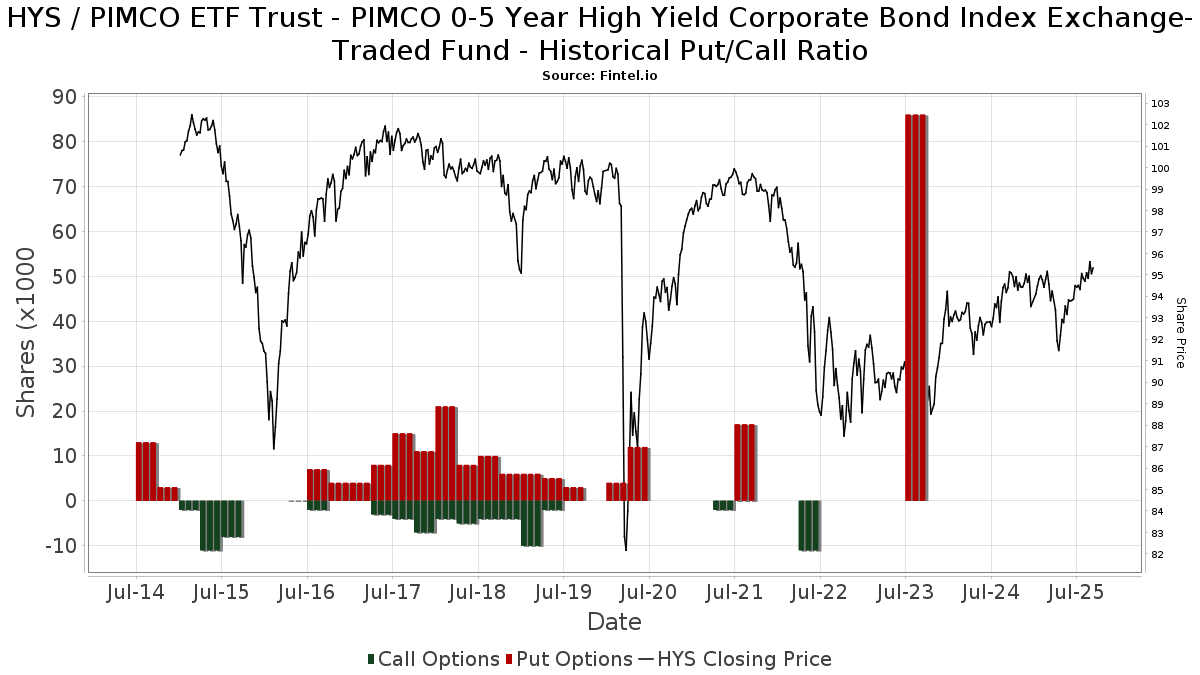
Institutionell sälj/köp-kvot
Förutom att rapportera vanliga eget kapital- och skuldemissioner måste institutioner med mer än 100MM tillgångar under förvaltning också avslöja sina innehav av sälj- och köpoptioner. Eftersom säljoptioner i allmänhet indikerar ett negativt sentiment och köpoptioner indikerar ett positivt sentiment, kan vi få en uppfattning om det övergripande institutionella sentimentet genom att plotta förhållandet mellan säljoptioner och köpoptioner. Diagrammet till höger visar det historiska förhållandet mellan sälj- och köpoptioner för detta instrument.
Genom att använda sälj/köp-kvoten som en indikator på aktieägarnas sentiment undviker man en av de största bristerna med att använda det totala institutionella ägandet, nämligen att en betydande del av de förvaltade tillgångarna investeras passivt för att följa index. Passivt förvaltade fonder köper vanligtvis inte optioner, så indikatorn för sälj/köp-kvoten ger en bättre bild av stämningen i aktivt förvaltade fonder.
13D/G-Arkiveringar
Vi presenterar 13D/G-arkiveringar separat från 13F-arkiveringar på grund av att de behandlas olika av SEC. 13D/G-arkiveringar kan lämnas in av grupper av investerare (med en ledare), medan 13F-arkiveringar inte kan det. Detta leder till situationer där en investerare kan lämna in en 13D/G-ansökan med ett värde för de totala aktierna (vilket motsvarar alla aktier som ägs av investerargruppen), men sedan lämna in en 13F-ansökan med ett annat värde för de totala aktierna (vilket motsvarar enbart deras eget ägande). Detta innebär att aktieägandet i 13D/G-arkiveringar och 13F-arkiveringar ofta inte är direkt jämförbara, så vi presenterar dem separat.
Notera: Från och med den 16 maj 2021 visar vi inte längre ägare som inte har lämnat in en 13D/G under det senaste året. Tidigare visade vi hela historiken för 13D/G-arkiveringar. I allmänhet måste enheter som är skyldiga att lämna in 13D/G-arkiveringar lämna in minst en gång per år innan de lämnar in en stängningsarkivering. Fonder avslutar dock ibland positioner utan att lämna in en avslutande arkivering (dvs. de avvecklar), så att visa hela historiken resulterade ibland i förvirring om det nuvarande ägandet. För att förhindra förvirring visar vi nu endast "nuvarande" ägare - det vill säga ägare som har lämnat in en ansökan under det senaste året.
Upgrade to unlock premium data.
| Fil Datum | Formulär | Investerare | Föregående aktier |
Senaste aktier |
Δ Aktier (Procent) |
Ägande (Procent) |
Δ Ägande (Procent) |
|
|---|---|---|---|---|---|---|---|---|
| 2025-04-23 | FIRST TRUST PORTFOLIOS LP | 949,932 | 5.97 |
13F- och NPORT-arkiveringar
Detaljer om 13F-arkiveringar är gratis. Detaljer om NP-arkiveringar kräver ett premiummedlemskap. Gröna rader indikerar nya positioner. Röda rader indikerar stängda positioner. Klicka på länk symbolen för att se hela transaktionshistoriken.
Uppgradera
för att låsa upp premiumdata och exportera till Excel ![]() .
.
| Fil Datum | Källa | Investerare | Typ | Genomsnittligt pris (beräknat) |
Aktier | Δ Aktier (%) |
Rapporterat värde (1000 USD) |
Δ Värde (%) |
Portföljallokering (%) |
|
|---|---|---|---|---|---|---|---|---|---|---|
| 2025-08-19 | 13F | Cape Investment Advisory, Inc. | 133 | 2,31 | 13 | 0,00 | ||||
| 2025-08-13 | 13F | Scotia Capital Inc. | 0 | −100,00 | 0 | |||||
| 2025-08-13 | 13F | Kayne Anderson Rudnick Investment Management Llc | 6 467 | 9,80 | 613 | 11,25 | ||||
| 2025-07-18 | 13F | Consolidated Portfolio Review Corp | 2 189 | 1,72 | 208 | 2,99 | ||||
| 2025-08-04 | 13F | Assetmark, Inc | 644 813 | −2,13 | 61 264 | −0,72 | ||||
| 2025-08-14 | 13F | Royal Bank Of Canada | 184 724 | 1,28 | 17 551 | 2,74 | ||||
| 2025-08-07 | 13F | Resources Investment Advisors, LLC. | 216 890 | 20,03 | 20 607 | 21,76 | ||||
| 2025-08-08 | 13F | TD Capital Management LLC | 586 | 56 | ||||||
| 2025-07-25 | 13F | Concurrent Investment Advisors, LLC | 27 945 | 3,11 | 2 655 | 4,61 | ||||
| 2025-08-12 | 13F | Viawealth, Llc | 18 128 | −8,00 | 1 722 | −6,67 | ||||
| 2025-08-14 | 13F | UBS Group AG | 215 039 | −35,97 | 20 431 | −35,05 | ||||
| 2025-07-28 | 13F | Allianz Asset Management GmbH | 707 506 | −7,42 | 67 220 | −6,09 | ||||
| 2025-08-07 | 13F | Allworth Financial LP | 1 978 | −0,30 | 188 | 1,63 | ||||
| 2025-07-24 | 13F | Us Bancorp \de\ | 5 445 | 0,00 | 517 | 1,57 | ||||
| 2025-08-01 | 13F | Boyd Watterson Asset Management Llc/oh | 0 | −100,00 | 0 | |||||
| 2025-08-13 | 13F | Johnson Financial Group, Inc. | 951 | −17,38 | 90 | −15,89 | ||||
| 2025-08-13 | 13F/A | StoneX Group Inc. | 45 825 | 4 409 | ||||||
| 2025-08-08 | 13F | Cetera Investment Advisers | 267 732 | 1,48 | 25 437 | 2,95 | ||||
| 2025-08-14 | 13F | Helium Advisors LLC | 3 623 | −1,58 | 344 | 0,00 | ||||
| 2025-08-14 | 13F | Great Valley Advisor Group, Inc. | 58 459 | 5 555 | ||||||
| 2025-07-21 | 13F | TFG Advisers LLC | 7 030 | 3,14 | 668 | 4,55 | ||||
| 2025-08-05 | 13F | Huntington National Bank | 3 806 | −0,34 | ||||||
| 2025-07-25 | 13F | Richardson Financial Services Inc. | 6 760 | −14,66 | 637 | −14,04 | ||||
| 2025-07-24 | 13F | Ronald Blue Trust, Inc. | 46 | 0,00 | 4 | 0,00 | ||||
| 2025-08-06 | 13F | Legacy Investment Solutions, LLC | 23 | 0,00 | 2 | 0,00 | ||||
| 2025-07-22 | 13F | Merit Financial Group, LLC | 20 776 | −43,18 | 1 974 | −42,38 | ||||
| 2025-05-22 | 13F | Mattson Financial Services, LLC | 0 | −100,00 | 0 | |||||
| 2025-08-11 | 13F | Howard Wealth Management, Llc | 8 460 | 10,17 | 804 | 11,68 | ||||
| 2025-08-14 | 13F | Mml Investors Services, Llc | 22 131 | −26,97 | 2 | 0,00 | ||||
| 2025-08-14 | 13F | Wiley Bros.-aintree Capital, Llc | 8 863 | 9,88 | 790 | 4,64 | ||||
| 2025-08-14 | 13F | Sunbelt Securities, Inc. | 45 | 0,00 | 4 | 0,00 | ||||
| 2025-07-24 | 13F | Blair William & Co/il | 499 | 54,01 | 47 | 56,67 | ||||
| 2025-08-13 | 13F | Gateway Wealth Partners, LLC | 3 267 | −25,29 | 310 | −24,21 | ||||
| 2025-08-14 | 13F | Jane Street Group, Llc | 0 | −100,00 | 0 | |||||
| 2025-08-14 | 13F | Raymond James Financial Inc | 76 384 | 6,22 | 7 257 | 7,75 | ||||
| 2025-08-05 | 13F | Intellectus Partners, LLC | 6 921 | 1,51 | 658 | 2,98 | ||||
| 2025-08-07 | 13F | Compass Financial Group, Inc. | 26 774 | −1,13 | 2 544 | 0,28 | ||||
| 2025-07-22 | 13F | Beacon Financial Advisory LLC | 2 754 | 1,40 | 262 | 2,76 | ||||
| 2025-08-14 | 13F | Osterweis Capital Management Inc | 510 | 1,59 | ||||||
| 2025-07-29 | 13F | Financial Futures Ltd Liability Co. | 5 425 | −52,59 | 515 | −51,91 | ||||
| 2025-08-04 | 13F | IFG Advisory, LLC | 13 256 | 16,56 | 1 259 | 18,22 | ||||
| 2025-08-11 | 13F | Principal Securities, Inc. | 105 | 26,51 | 10 | 28,57 | ||||
| 2025-07-07 | 13F | Wesbanco Bank Inc | 19 968 | 1 897 | ||||||
| 2025-08-11 | 13F | TD Waterhouse Canada Inc. | 10 388 | 12,01 | 980 | 13,29 | ||||
| 2025-08-06 | 13F | Hoxton Planning & Management, LLC | 5 531 | −41,54 | 526 | −40,74 | ||||
| 2025-08-14 | 13F | Stifel Financial Corp | 51 266 | −7,87 | 4 870 | −6,54 | ||||
| 2025-07-29 | 13F | Financial Synergies Wealth Advisors, Inc. | 3 796 | 29,82 | 361 | 31,87 | ||||
| 2025-08-01 | NP | OTRFX - OnTrack Core Fund Investor Class Shares | 0 | −100,00 | 0 | −100,00 | ||||
| 2025-08-14 | 13F | Bank Of America Corp /de/ | 150 398 | −7,41 | 14 289 | −6,07 | ||||
| 2025-08-26 | 13F/A | Thrivent Financial For Lutherans | 0 | −100,00 | 0 | −100,00 | ||||
| 2025-08-08 | 13F | Capital Investment Advisory Services, LLC | 1 269 | 17,94 | 121 | 20,00 | ||||
| 2025-08-14 | 13F | Mercer Global Advisors Inc /adv | 5 455 | 1,26 | 518 | 2,78 | ||||
| 2025-05-29 | NP | TFAZX - TFA Tactical Income Fund Class I | 0 | −100,00 | 0 | −100,00 | ||||
| 2025-07-23 | 13F | Nbt Bank N A /ny | 1 885 | 0,00 | 179 | 1,70 | ||||
| 2025-08-07 | 13F | BHK Investment Advisors, LLC | 41 850 | 1,95 | 3 976 | 3,43 | ||||
| 2025-08-13 | 13F | Financial & Tax Architects, LLC | 35 400 | −3,62 | 3 363 | −2,21 | ||||
| 2025-08-14 | 13F | Federation des caisses Desjardins du Quebec | 223 | 0,00 | 21 | 5,00 | ||||
| 2025-08-29 | NP | BOND - PIMCO Active Bond Exchange-Traded Fund | 582 979 | −8,87 | 55 389 | −7,56 | ||||
| 2025-07-08 | 13F | RMR Wealth Builders | 159 615 | 7,28 | 15 165 | 8,83 | ||||
| 2025-07-25 | 13F | Northwest Capital Management Inc | 108 | 0,93 | 10 | 0,00 | ||||
| 2025-07-17 | 13F | Coastline Trust Co | 30 821 | 0,00 | 2 928 | 1,46 | ||||
| 2025-05-15 | 13F | Barclays Plc | 0 | −100,00 | 0 | −100,00 | ||||
| 2025-08-06 | 13F | Csenge Advisory Group | 2 365 | −13,34 | 222 | −11,55 | ||||
| 2025-08-14 | 13F | Wells Fargo & Company/mn | 162 796 | 14,59 | 15 467 | 16,25 | ||||
| 2025-07-17 | 13F | Sound Income Strategies, LLC | 44 | 4 | ||||||
| 2025-07-09 | 13F | Burt Wealth Advisors | 4 982 | 8,30 | 473 | 10,00 | ||||
| 2025-08-04 | 13F | Atria Investments Llc | 0 | −100,00 | 0 | |||||
| 2025-08-08 | 13F | Kane Investment Management, Inc. | 5 720 | 3,74 | 546 | 5,62 | ||||
| 2025-08-15 | 13F | Tower Research Capital LLC (TRC) | 42 | 4 | ||||||
| 2025-08-04 | 13F | Pensionmark Financial Group, Llc | 7 209 | −8,18 | 685 | −6,94 | ||||
| 2025-04-16 | 13F | New Century Financial Group, LLC | 0 | −100,00 | 0 | |||||
| 2025-07-18 | 13F | Bartlett & Co. Wealth Management Llc | 300 | 0,00 | 29 | 0,00 | ||||
| 2025-08-14 | 13F | Advisor OS, LLC | 3 973 | 0,00 | 377 | 1,34 | ||||
| 2025-08-07 | 13F | Curtis Advisory Group, LLC | 11 003 | 9,10 | 1 045 | 10,70 | ||||
| 2025-04-21 | 13F | ORG Partners LLC | 0 | −100,00 | 0 | |||||
| 2025-08-15 | 13F | Morgan Stanley | 693 838 | 4,03 | 65 922 | 5,53 | ||||
| 2025-05-09 | 13F | Legacy Capital Group California, Inc. | 0 | −100,00 | 0 | |||||
| 2025-08-12 | 13F | Pathstone Holdings, LLC | 3 201 | 20,02 | 304 | 22,09 | ||||
| 2025-07-18 | 13F | Rogco, Lp | 1 231 | −30,33 | 117 | −29,70 | ||||
| 2025-08-13 | 13F | Cerity Partners LLC | 3 451 | 3,73 | 328 | 5,14 | ||||
| 2025-07-21 | 13F | Cape Ann Savings Bank | 0 | −100,00 | 0 | |||||
| 2025-07-09 | 13F | Stokes Capital Advisors, LLC | 11 385 | 36,05 | 1 082 | 38,06 | ||||
| 2025-05-28 | NP | TFAFX - Tactical Growth Allocation Fund Class I | 2 900 | −27,39 | 272 | −27,54 | ||||
| 2025-07-17 | 13F | LexAurum Advisors, LLC | 18 261 | 1 735 | ||||||
| 2025-08-12 | 13F | Argent Trust Co | 7 374 | −10,42 | 701 | −9,21 | ||||
| 2025-07-23 | 13F | Roundview Capital LLC | 2 545 | 4,09 | 242 | 5,24 | ||||
| 2025-08-13 | 13F | Renaissance Technologies Llc | 32 600 | −70,71 | 3 097 | −70,29 | ||||
| 2025-08-14 | 13F | Glen Eagle Advisors, LLC | 14 | 0,00 | 1 | 0,00 | ||||
| 2025-08-06 | 13F | North Capital, Inc. | 180 | 0,00 | 17 | 6,25 | ||||
| 2025-08-05 | 13F | NewSquare Capital LLC | 26 482 | 23,15 | 2 516 | 24,93 | ||||
| 2025-05-30 | NP | ERNZ - TrueShares Active Yield ETF | 7 819 | 732 | ||||||
| 2025-07-23 | 13F | Axos Invest Inc. | 5 430 | −6,92 | 516 | −5,68 | ||||
| 2025-08-12 | 13F | Proequities, Inc. | 0 | 0 | ||||||
| 2025-07-08 | 13F | Zrc Wealth Management, Llc | 54 | 0,00 | 5 | 0,00 | ||||
| 2025-07-08 | 13F | Nbc Securities, Inc. | 649 | 0,00 | 0 | |||||
| 2025-04-23 | 13F | Golden State Wealth Management, LLC | 0 | −100,00 | 0 | |||||
| 2025-07-25 | 13F | Cwm, Llc | 223 327 | 74,75 | 21 | 90,91 | ||||
| 2025-08-12 | 13F | RiverFront Investment Group, LLC | 2 315 | 0,00 | 220 | 1,39 | ||||
| 2025-07-23 | 13F | Bellevue Asset Management, Llc | 240 | 0,00 | 23 | 0,00 | ||||
| 2025-07-22 | 13F | Global Assets Advisory, LLC | 0 | −100,00 | 0 | |||||
| 2025-08-14 | 13F | GWM Advisors LLC | 37 325 | 6,44 | 3 546 | 7,98 | ||||
| 2025-07-11 | 13F | Farther Finance Advisors, LLC | 3 174 | −28,61 | 302 | −27,29 | ||||
| 2025-08-08 | 13F | Pnc Financial Services Group, Inc. | 317 183 | 3,88 | 30 136 | 5,38 | ||||
| 2025-08-06 | 13F | Price Capital Management, Inc. | 0 | −100,00 | 0 | |||||
| 2025-07-18 | 13F | PFG Investments, LLC | 0 | −100,00 | 0 | |||||
| 2025-08-12 | 13F | Allianz Investment Management U.S. LLC | 9 977 | 0,00 | 948 | 3,05 | ||||
| 2025-07-02 | 13F/A | Bank Of Nova Scotia | 0 | −100,00 | 0 | −100,00 | ||||
| 2025-08-12 | 13F | Global Retirement Partners, LLC | 1 121 | 45,58 | 107 | 47,22 | ||||
| 2025-07-16 | 13F | ORG Wealth Partners, LLC | 18 | 0,00 | 2 | 0,00 | ||||
| 2025-08-14 | 13F | Tennessee Valley Asset Management Partners | 0 | −100,00 | 0 | |||||
| 2025-08-15 | 13F | Kestra Advisory Services, LLC | 6 811 | 202,71 | 647 | 208,10 | ||||
| 2025-08-29 | 13F | Centaurus Financial, Inc. | 0 | −100,00 | 0 | |||||
| 2025-08-12 | 13F | NFP Retirement, Inc. | 37 274 | −1,93 | 3 541 | −0,51 | ||||
| 2025-07-23 | 13F | Capital Management Associates, Inc | 132 121 | −48,80 | 12 553 | −48,06 | ||||
| 2025-04-22 | 13F | Synergy Financial Management, LLC | 0 | −100,00 | 0 | |||||
| 2025-08-12 | 13F | Jefferies Financial Group Inc. | 0 | −100,00 | 0 | |||||
| 2025-07-30 | 13F | Whittier Trust Co | 647 | −15,97 | 61 | −15,28 | ||||
| 2025-08-14 | 13F | Legacy Advisory Services, LLC | 3 410 | 1,85 | 324 | 3,51 | ||||
| 2025-08-05 | 13F | Westside Investment Management, Inc. | 126 | 0,00 | 12 | 0,00 | ||||
| 2025-08-05 | 13F | Milestone Asset Management, Llc | 9 938 | −76,67 | 944 | −76,33 | ||||
| 2025-05-07 | 13F | Foundations Investment Advisors, LLC | 0 | −100,00 | 0 | |||||
| 2025-08-13 | 13F | Level Four Advisory Services, Llc | 5 382 | 1,49 | 511 | 3,02 | ||||
| 2025-07-31 | 13F | Glass Jacobson Investment Advisors llc | 32 239 | −8,55 | 3 063 | −7,24 | ||||
| 2025-05-12 | 13F | Aveo Capital Partners, LLC | 0 | −100,00 | 0 | |||||
| 2025-07-24 | 13F | IFP Advisors, Inc | 3 866 | 70,53 | 367 | 73,11 | ||||
| 2025-08-14 | 13F | Integrated Wealth Concepts LLC | 12 675 | −2,48 | 1 204 | −1,07 | ||||
| 2025-07-22 | 13F | DAVENPORT & Co LLC | 4 107 | 17,28 | 390 | 19,27 | ||||
| 2025-08-05 | 13F | Sigma Planning Corp | 3 607 | −4,07 | 343 | −2,84 | ||||
| 2025-08-12 | 13F | Richard W. Paul & Associates, LLC | 14 | 0,00 | 1 | 0,00 | ||||
| 2025-08-14 | 13F | Comerica Bank | 2 653 | −0,52 | 252 | 1,20 | ||||
| 2025-03-28 | NP | DYFI - IDX DYNAMIC FIXED INCOME ETF | 57 096 | 50,11 | 5 418 | 50,92 | ||||
| 2025-07-23 | 13F | Valmark Advisers, Inc. | 26 914 | 2,54 | 2 557 | 4,03 | ||||
| 2025-08-11 | 13F | PAX Financial Group, LLC | 11 277 | −18,47 | 1 071 | −17,30 | ||||
| 2025-08-12 | 13F | Founders Financial Alliance, LLC | 0 | −100,00 | 0 | |||||
| 2025-05-06 | 13F | Navellier & Associates Inc | 0 | −100,00 | 0 | |||||
| 2025-05-16 | 13F | Coppell Advisory Solutions LLC | 0 | −100,00 | 0 | |||||
| 2025-09-08 | 13F | Alternative Investment Advisors, LLC. | 31 301 | −5,11 | 2 974 | −3,76 | ||||
| 2025-08-13 | 13F | GeoWealth Management, LLC | 10 269 | 1,03 | 976 | 2,52 | ||||
| 2025-07-10 | 13F | Wealth Enhancement Advisory Services, Llc | 9 087 | −7,10 | 859 | −6,22 | ||||
| 2025-04-21 | 13F | Nelson, Van Denburg & Campbell Wealth Management Group, LLC | 0 | −100,00 | 0 | |||||
| 2025-05-14 | 13F | GM Advisory Group, Inc. | 0 | −100,00 | 0 | |||||
| 2025-08-06 | 13F | AE Wealth Management LLC | 12 470 | 5,54 | 1 185 | 7,05 | ||||
| 2025-07-14 | 13F/A | Seek First Inc. | 2 562 | 1,83 | 243 | 3,40 | ||||
| 2025-07-30 | 13F | Exencial Wealth Advisors, Llc | 67 622 | −19,81 | 6 425 | −18,66 | ||||
| 2025-08-12 | 13F | Steward Partners Investment Advisory, Llc | 359 | 734,88 | 34 | 750,00 | ||||
| 2025-07-08 | 13F | Parallel Advisors, LLC | 61 | 0,00 | 6 | 0,00 | ||||
| 2025-08-13 | 13F | Beacon Pointe Advisors, LLC | 43 850 | −7,54 | 4 166 | −6,19 | ||||
| 2025-07-21 | 13F | West Financial Advisors, LLC | 144 408 | 1,27 | 13 720 | 2,74 | ||||
| 2025-08-01 | 13F | Envestnet Asset Management Inc | 525 182 | 4,31 | 49 891 | 5,80 | ||||
| 2025-07-22 | 13F | SOL Capital Management CO | 8 443 | −8,31 | 1 | |||||
| 2025-07-23 | 13F | Element Wealth, LLC | 2 718 | 0,04 | 258 | 1,57 | ||||
| 2025-07-31 | 13F | Oppenheimer & Co Inc | 2 392 | 5,00 | 227 | 6,57 | ||||
| 2025-05-27 | NP | XFLX - FundX Flexible ETF | 64 125 | 52,97 | 6 006 | 52,92 | ||||
| 2025-08-14 | 13F | Hrt Financial Lp | 0 | −100,00 | 0 | |||||
| 2025-05-27 | NP | XRLX - FundX Conservative ETF | 27 989 | 52,62 | 2 621 | 52,65 | ||||
| 2025-07-29 | 13F | Barden Capital Management, Inc. | 14 597 | −5,95 | 1 387 | −4,61 | ||||
| 2025-08-14 | 13F | Harwood Advisory Group, LLC | 0 | −100,00 | 0 | |||||
| 2025-07-08 | 13F | Webster Bank, N. A. | 55 | 0,00 | 5 | 0,00 | ||||
| 2025-08-11 | 13F | Aspen Investment Management Inc | 27 538 | 2,04 | 3 | 0,00 | ||||
| 2025-08-18 | 13F/A | National Bank Of Canada /fi/ | 18 456 | 226,31 | 1 753 | 231,38 | ||||
| 2025-08-05 | 13F | Key FInancial Inc | 1 578 | −12,33 | 150 | −11,31 | ||||
| 2025-04-29 | 13F | DT Investment Partners, LLC | 0 | −100,00 | 0 | |||||
| 2025-08-04 | 13F | Kovack Advisors, Inc. | 3 273 | 0,03 | 311 | 1,31 | ||||
| 2025-08-13 | 13F | Continuum Advisory, LLC | 0 | −100,00 | 0 | |||||
| 2025-08-06 | 13F | Legacy Wealth Managment, LLC/ID | 23 | 0,00 | 2 | 0,00 | ||||
| 2025-05-06 | 13F | Advisors Preferred, LLC | 0 | −100,00 | 0 | |||||
| 2025-07-31 | 13F | Cambridge Investment Research Advisors, Inc. | 59 979 | −6,16 | 6 | 0,00 | ||||
| 2025-08-14 | 13F | Fwl Investment Management, Llc | 20 | 0,00 | 2 | 0,00 | ||||
| 2025-08-08 | 13F | Kingsview Wealth Management, LLC | 10 128 | 0,09 | 962 | 1,58 | ||||
| 2025-08-14 | 13F | Smartleaf Asset Management LLC | 39 | 0,00 | 4 | 0,00 | ||||
| 2025-07-28 | 13F | BRYN MAWR TRUST Co | 224 | 21 | ||||||
| 2025-08-08 | 13F | Security Financial Services, INC. | 5 705 | 4,43 | 542 | 6,07 | ||||
| 2025-07-21 | 13F | Ameritas Advisory Services, LLC | 2 774 | 3,93 | 264 | 5,62 | ||||
| 2025-08-14 | 13F | Man Group plc | 92 138 | 16,57 | 8 754 | 18,25 | ||||
| 2025-07-10 | 13F | Charter Oak Capital Management, LLC | 6 709 | −14,61 | 637 | −13,33 | ||||
| 2025-07-09 | 13F | Massmutual Trust Co Fsb/adv | 0 | −100,00 | 0 | |||||
| 2025-08-01 | 13F | Redwood Park Advisors LLC | 1 250 | 0,00 | 119 | 0,85 | ||||
| 2025-08-14 | 13F | Citadel Advisors Llc | 10 470 | −89,24 | 995 | −89,09 | ||||
| 2025-07-15 | 13F | Maseco Llp | 555 | 53 | ||||||
| 2025-07-21 | 13F | Empirical Financial Services, LLC d.b.a. Empirical Wealth Management | 20 118 | 9,12 | 1 911 | 10,72 | ||||
| 2025-07-15 | 13F | Td Private Client Wealth Llc | 158 694 | 4,73 | 15 077 | 6,24 | ||||
| 2025-08-05 | 13F | Bank of New York Mellon Corp | 7 780 | 13,78 | 739 | 15,47 | ||||
| 2025-08-11 | 13F | Parr Mcknight Wealth Management Group, Llc | 10 411 | 17,99 | 989 | 19,73 | ||||
| 2025-08-12 | 13F | Park Square Financial Group, LLC | 98 | 10,11 | 9 | 12,50 | ||||
| 2025-08-07 | 13F | Zions Bancorporation, National Association /ut/ | 850 | 0,00 | 81 | 1,27 | ||||
| 2025-07-18 | 13F | Dogwood Wealth Management LLC | 653 | 0,00 | 62 | 0,00 | ||||
| 2025-05-14 | 13F | Toroso Investments, LLC | 0 | −100,00 | 0 | |||||
| 2025-08-07 | 13F | Proficio Capital Partners LLC | 2 897 779 | 2 934 | ||||||
| 2025-08-18 | 13F | Geneos Wealth Management Inc. | 33 | 0,00 | 3 | 0,00 | ||||
| 2025-07-30 | 13F | Mid-American Wealth Advisory Group, Inc. | 315 569 | 1,36 | 29 982 | 2,82 | ||||
| 2025-07-28 | 13F | Harbour Investments, Inc. | 182 | 0,00 | 17 | 0,00 | ||||
| 2025-08-12 | 13F | LPL Financial LLC | 293 665 | 21,18 | 27 901 | 22,93 | ||||
| 2025-08-06 | 13F | Commonwealth Equity Services, Llc | 125 065 | −17,09 | 12 | −21,43 | ||||
| 2025-08-08 | 13F | Gts Securities Llc | 7 600 | 722 | ||||||
| 2025-08-14 | 13F | Atomi Financial Group, Inc. | 2 221 | −0,09 | 211 | 1,44 | ||||
| 2025-07-23 | 13F | Friedenthal Financial | 24 685 | 10,53 | 2 345 | 12,15 | ||||
| 2025-07-23 | 13F | Seamount Financial Group Inc | 40 617 | 7,13 | 3 859 | 8,70 | ||||
| 2025-08-13 | 13F | EverSource Wealth Advisors, LLC | 789 | −51,02 | 75 | −50,67 | ||||
| 2025-04-28 | 13F | First Horizon Advisors, Inc. | 0 | −100,00 | 0 | |||||
| 2025-07-24 | 13F | Capital Advisors, Ltd. LLC | 511 | 0,99 | 0 | |||||
| 2025-08-07 | 13F | Authentikos Wealth Advisory, LLC | 22 721 | 30,93 | 2 159 | 32,80 | ||||
| 2025-05-12 | 13F | Independent Advisor Alliance | 0 | −100,00 | 0 | |||||
| 2025-08-12 | 13F | Change Path, LLC | 39 334 | 4,16 | 3 737 | 5,68 | ||||
| 2025-07-15 | 13F | Financial Management Professionals, Inc. | 211 899 | −4,54 | 20 132 | −3,16 | ||||
| 2025-08-15 | 13F | WFA of San Diego, LLC | 1 015 | −28,27 | 96 | −28,89 | ||||
| 2025-07-24 | 13F | Beacon Bridge Wealth Partners, LLC | 2 505 | −28,86 | 238 | −27,66 | ||||
| 2025-08-12 | 13F | Jpmorgan Chase & Co | 337 940 | 18,47 | 32 108 | 20,17 | ||||
| 2025-08-14 | 13F | Fmr Llc | 128 | 161,22 | 12 | 200,00 | ||||
| 2025-08-08 | 13F | Avantax Advisory Services, Inc. | 3 397 | 323 | ||||||
| 2025-08-08 | 13F | Condor Capital Management | 152 331 | 5,85 | 14 473 | 7,37 | ||||
| 2025-08-14 | 13F | Mariner, LLC | 0 | −100,00 | 0 | |||||
| 2025-08-11 | 13F | One Capital Management, LLC | 0 | −100,00 | 0 | |||||
| 2025-08-05 | 13F | Bank Of Montreal /can/ | 1 570 | −11,10 | 149 | −9,70 | ||||
| 2025-07-16 | 13F | Brown, Lisle/cummings, Inc. | 570 | 0,00 | 54 | 1,89 | ||||
| 2025-08-06 | 13F | SOUTH STATE Corp | 134 | 13 | ||||||
| 2025-08-14 | 13F | Snowden Capital Advisors LLC | 4 158 | −1,54 | 395 | 0,00 | ||||
| 2025-07-29 | 13F | TrueMark Investments, LLC | 0 | −100,00 | 0 | |||||
| 2025-05-15 | 13F | Manufacturers Life Insurance Company, The | 0 | −100,00 | 0 | |||||
| 2025-08-11 | 13F | Strategic Wealth Partners, Ltd. | 746 | 71 | ||||||
| 2025-04-25 | 13F | New Wave Wealth Advisors Llc | 0 | −100,00 | 0 | |||||
| 2025-07-14 | 13F | Pacifica Partners Inc. | 189 | 1,07 | 18 | 0,00 | ||||
| 2025-08-07 | 13F | Rollins Financial Advisors, LLC | 4 280 | −29,19 | 407 | −28,27 | ||||
| 2025-07-21 | 13F | Mechanics Financial Corp | 357 | −28,46 | 34 | −28,26 | ||||
| 2025-08-06 | 13F | Rialto Wealth Management, LLC | 3 974 | 0,00 | 378 | 1,34 | ||||
| 2025-07-18 | 13F | Truist Financial Corp | 19 777 | −56,67 | 1 879 | −56,04 | ||||
| 2025-07-09 | 13F | Graves-Light Private Wealth Management, Inc. | 62 535 | −1,58 | 5 941 | −0,17 | ||||
| 2025-08-19 | 13F | Advisory Services Network, LLC | 21 723 | 3,11 | 2 061 | 4,46 | ||||
| 2025-08-14 | 13F | Headlands Technologies LLC | 0 | −100,00 | 0 | −100,00 | ||||
| 2025-09-12 | 13F/A | Valeo Financial Advisors, LLC | 5 275 | 0,00 | 501 | 1,42 | ||||
| 2025-08-12 | 13F | CIBC Private Wealth Group, LLC | 12 296 | 7,28 | 1 168 | 13,84 | ||||
| 2025-08-13 | 13F | Northwestern Mutual Wealth Management Co | 9 605 | 8,65 | 913 | 10,28 | ||||
| 2025-07-21 | 13F | Rainey & Randall Investment Management Inc. | 5 253 | 0,15 | 499 | 1,63 | ||||
| 2025-08-12 | 13F | Hillsdale Investment Management Inc. | 4 445 | 26,82 | 422 | 28,66 | ||||
| 2025-08-14 | 13F | Peapack Gladstone Financial Corp | 16 635 | 0,00 | 2 | 0,00 | ||||
| 2025-07-10 | 13F | Burns J W & Co Inc/ny | 3 255 | −9,71 | 309 | −8,31 | ||||
| 2025-08-13 | 13F | Flow Traders U.s. Llc | 0 | −100,00 | 0 | |||||
| 2025-08-20 | 13F | North Dallas Bank & Trust Co | 12 825 | 1 219 | ||||||
| 2025-08-14 | 13F | Susquehanna International Group, Llp | 0 | −100,00 | 0 | |||||
| 2025-08-14 | 13F | Murphy & Mullick Capital Management Corp | 5 405 | −7,03 | 513 | −5,88 | ||||
| 2025-08-14 | 13F | Transamerica Financial Advisors, Inc. | 1 | 0,00 | 0 | |||||
| 2025-08-14 | 13F | Visionary Wealth Advisors | 0 | −100,00 | 0 | |||||
| 2025-08-14 | 13F | Ameriprise Financial Inc | 117 834 | −16,76 | 11 195 | −15,57 | ||||
| 2025-07-29 | 13F | Bellecapital International Ltd. | 17 276 | 0,00 | 1 641 | 1,42 | ||||
| 2025-08-13 | 13F | Jones Financial Companies Lllp | 19 777 | 98,66 | 1 872 | 100,97 | ||||
| 2025-08-05 | 13F | Tsfg, Llc | 80 | 0,00 | 0 | |||||
| 2025-07-14 | 13F | AdvisorNet Financial, Inc | 2 473 | 19,18 | 235 | 20,62 | ||||
| 2025-08-14 | 13F | CoreCap Advisors, LLC | 15 | 0,00 | 1 | 0,00 | ||||
| 2025-08-14 | 13F | Bnp Paribas Arbitrage, Sa | 20 600 | −42,13 | 1 957 | −41,30 | ||||
| 2025-07-30 | 13F | Bleakley Financial Group, LLC | 159 883 | 15 190 | ||||||
| 2025-07-29 | 13F | Koshinski Asset Management, Inc. | 9 420 | −2,81 | 895 | −1,43 | ||||
| 2025-07-21 | 13F | Ameriflex Group, Inc. | 99 | 0,00 | 9 | 0,00 | ||||
| 2025-07-08 | 13F | Adamsbrown Wealth Consultants Llc | 19 823 | 10,21 | 1 883 | 11,82 | ||||
| 2025-07-25 | 13F | Atria Wealth Solutions, Inc. | 0 | −100,00 | 0 | |||||
| 2025-08-13 | 13F | Per Stirling Capital Management, LLC. | 0 | −100,00 | 0 | |||||
| 2025-08-14 | 13F | Old Mission Capital Llc | 0 | −100,00 | 0 | |||||
| 2025-08-06 | 13F | Stonebridge Financial Planning Group, LLC | 3 510 | 0,00 | 333 | 1,52 | ||||
| 2025-08-12 | 13F | JMG Financial Group, Ltd. | 4 862 | −21,15 | 462 | −20,10 | ||||
| 2025-07-11 | 13F | Pinnacle Bancorp, Inc. | 7 781 | −0,64 | 739 | 0,82 | ||||
| 2025-07-28 | 13F | Brown Financial Advisory | 2 158 | 205 | ||||||
| 2025-05-13 | 13F | Ground Swell Capital, LLC | 0 | −100,00 | 0 | |||||
| 2025-05-12 | 13F | Astor Investment Management LLC | 0 | −100,00 | 0 | |||||
| 2025-08-11 | 13F | Aptus Capital Advisors, LLC | 1 542 | 0,13 | 146 | 1,39 | ||||
| 2025-07-09 | 13F | Gilman Hill Asset Management, LLC | 4 500 | 56,52 | 428 | 58,74 | ||||
| 2025-08-12 | 13F | Putnam Fl Investment Management Co | 29 280 | −12,31 | 2 782 | −11,06 | ||||
| 2025-07-29 | 13F | Stephens Inc /ar/ | 2 175 | −33,34 | 207 | −32,46 | ||||
| 2025-09-11 | 13F | Milestones Private Investment Advisors LLC | 7 379 | 701 | ||||||
| 2025-08-05 | 13F | Cherry Tree Wealth Management, LLC | 733 | 0,00 | 70 | 1,47 | ||||
| 2025-08-11 | 13F | Advisor Resource Council | 0 | −100,00 | 0 | |||||
| 2025-09-04 | 13F/A | Advisor Group Holdings, Inc. | 177 030 | 157,53 | 16 724 | 159,61 | ||||
| 2025-08-04 | 13F | Creative Financial Designs Inc /adv | 274 | 1,86 | 26 | 4,00 | ||||
| 2025-07-28 | 13F | Ckw Financial Group | 4 189 | −0,48 | 0 | |||||
| 2025-08-18 | 13F | Hollencrest Capital Management | 17 | 0,00 | 2 | 0,00 | ||||
| 2025-08-12 | 13F | Main Management LLC | 0 | −100,00 | 0 | |||||
| 2025-08-11 | 13F | MainStreet Investment Advisors LLC | 0 | −100,00 | 0 | |||||
| 2025-08-12 | 13F | South Plains Financial, Inc. | 4 754 | −71,98 | 452 | −71,62 | ||||
| 2025-08-12 | 13F | MAI Capital Management | 1 379 | −1,15 | 131 | 0,00 | ||||
| 2025-08-14 | 13F | Cardiff Park Advisors, Llc | 1 230 | 0,00 | 117 | 0,87 | ||||
| 2025-08-11 | 13F | HighTower Advisors, LLC | 4 699 | −66,29 | 446 | −65,82 | ||||
| 2025-07-08 | 13F | Strategic Advocates LLC | 44 444 | −10,91 | 4 223 | −9,63 | ||||
| 2025-07-09 | 13F | Bank of New Hampshire | 99 | 0,00 | 9 | 0,00 | ||||
| 2025-07-15 | 13F | Financial Partners Group, Inc | 13 725 | 1 304 | ||||||
| 2025-07-24 | 13F | Standard Life Aberdeen plc | 2 864 | 272 | ||||||
| 2025-08-04 | 13F | Migdal Insurance & Financial Holdings Ltd. | 8 410 | 0,00 | 1 | |||||
| 2025-05-14 | 13F | Truvestments Capital Llc | 0 | −100,00 | 0 | |||||
| 2025-07-17 | 13F | Sage Rhino Capital Llc | 18 994 | −1,74 | 1 805 | −0,33 | ||||
| 2025-08-11 | 13F | Private Advisor Group, LLC | 6 076 | 159,44 | 577 | 163,47 |
Other Listings
| MX:HYS |