Grundläggande statistik
| Institutionella ägare | 242 total, 242 long only, 0 short only, 0 long/short - change of −7,55% MRQ |
| Genomsnittlig portföljallokering | 0.3328 % - change of −1,73% MRQ |
| Institutionella aktier (lång) | 77 331 131 (ex 13D/G) - change of −0,60MM shares −0,78% MRQ |
| Institutionellt värde (lång) | $ 1 849 289 USD ($1000) |
Institutionellt ägande och aktieägare
First Trust Exchange-Traded Fund VII - First Trust Global Tactical Commodity Strategy Fund (US:FTGC) har 242 Institutionella ägare och aktieägare som har lämnat in 13D/G- eller 13F-formulär till Securities Exchange Commission (SEC). Dessa institut innehar totalt 77,331,131 aktier. Största aktieägare inkluderar Wells Fargo & Company/mn, Morgan Stanley, LPL Financial LLC, Royal Bank Of Canada, UBS Group AG, GWM Advisors LLC, Flaharty Asset Management, LLC, Cyndeo Wealth Partners, LLC, Congress Wealth Management LLC / DE /, and Raymond James Financial Inc .
First Trust Exchange-Traded Fund VII - First Trust Global Tactical Commodity Strategy Fund (NasdaqGM:FTGC) Institutionell ägarstruktur visar institutioners och fonders nuvarande positioner i företaget, samt de senaste förändringarna i positionernas storlek. Större aktieägare kan vara enskilda investerare, fonder, hedgefonder eller institutioner. Bilaga 13D visar att investeraren äger (eller ägde) mer än 5% av företaget och avser (eller avsåg) att aktivt eftersträva en förändring av affärsstrategin. Schedule 13G indikerar en passiv investering på över 5%.
The share price as of September 11, 2025 is 25,68 / share. Previously, on September 12, 2024, the share price was 22,80 / share. This represents an increase of 12,65% over that period.

Fondsentimentets poäng
Fondsentimentet poängen(fka Ägarackumulation-poäng) visar vilka aktier som är mest köpta av fonder. Det är resultatet av en sofistikerad kvantitativ flerfaktormodell som identifierar företag med de högsta nivåerna av institutionell ackumulering. Poängsättningsmodellen använder en kombination av den totala ökningen av redovisade ägare, förändringarna i portföljallokeringarna för dessa ägare och andra mått. Siffran sträcker sig från 0 till 100, där högre siffror indikerar en högre nivå av ackumulering i förhållande till sina konkurrenter, och 50 är genomsnittet.
Uppdateringsfrekvens: Dagligen
Se Ownership Explorer, som innehåller en lista över de högst rankade företagen.
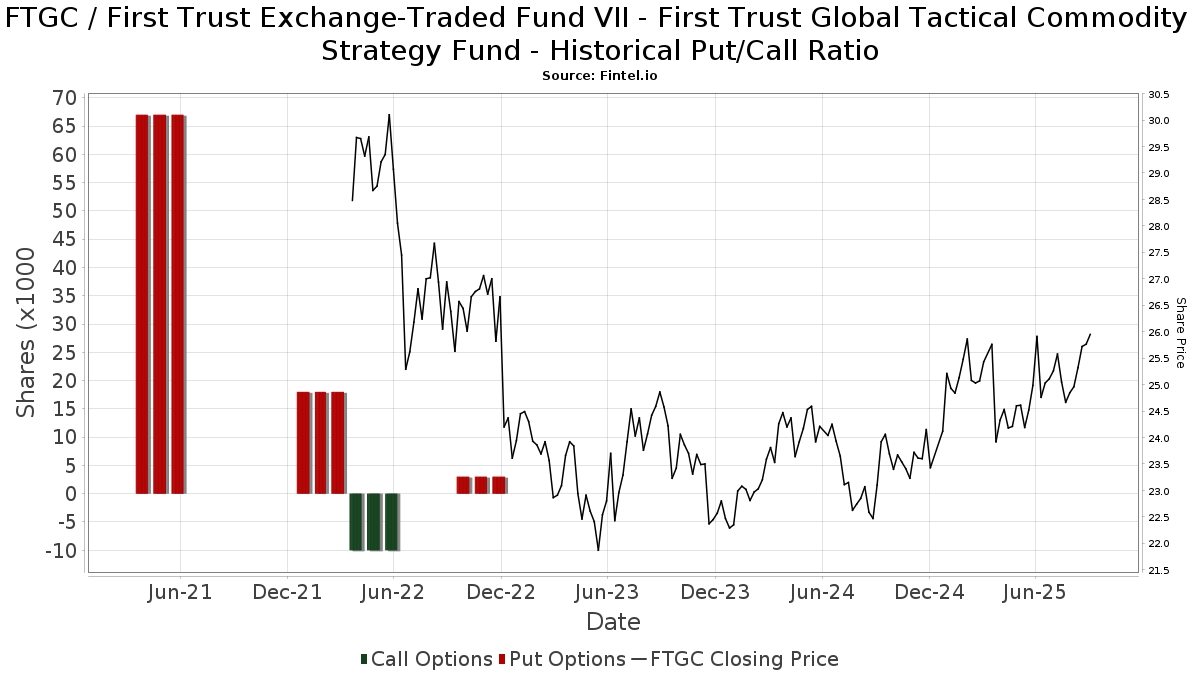
Institutionell sälj/köp-kvot
Förutom att rapportera vanliga eget kapital- och skuldemissioner måste institutioner med mer än 100MM tillgångar under förvaltning också avslöja sina innehav av sälj- och köpoptioner. Eftersom säljoptioner i allmänhet indikerar ett negativt sentiment och köpoptioner indikerar ett positivt sentiment, kan vi få en uppfattning om det övergripande institutionella sentimentet genom att plotta förhållandet mellan säljoptioner och köpoptioner. Diagrammet till höger visar det historiska förhållandet mellan sälj- och köpoptioner för detta instrument.
Genom att använda sälj/köp-kvoten som en indikator på aktieägarnas sentiment undviker man en av de största bristerna med att använda det totala institutionella ägandet, nämligen att en betydande del av de förvaltade tillgångarna investeras passivt för att följa index. Passivt förvaltade fonder köper vanligtvis inte optioner, så indikatorn för sälj/köp-kvoten ger en bättre bild av stämningen i aktivt förvaltade fonder.
13F- och NPORT-arkiveringar
Detaljer om 13F-arkiveringar är gratis. Detaljer om NP-arkiveringar kräver ett premiummedlemskap. Gröna rader indikerar nya positioner. Röda rader indikerar stängda positioner. Klicka på länk symbolen för att se hela transaktionshistoriken.
Uppgradera
för att låsa upp premiumdata och exportera till Excel ![]() .
.
| Fil Datum | Källa | Investerare | Typ | Genomsnittligt pris (beräknat) |
Aktier | Δ Aktier (%) |
Rapporterat värde (1000 USD) |
Δ Värde (%) |
Portföljallokering (%) |
|
|---|---|---|---|---|---|---|---|---|---|---|
| 2025-08-05 | 13F | NewSquare Capital LLC | 28 775 | 7,01 | 710 | 3,35 | ||||
| 2025-08-11 | 13F | Principal Securities, Inc. | 77 898 | −1,65 | 1 922 | 1,37 | ||||
| 2025-08-12 | 13F | SRS Capital Advisors, Inc. | 5 183 | −25,05 | 128 | −27,84 | ||||
| 2025-08-04 | 13F | Daymark Wealth Partners, Llc | 9 541 | 3,75 | 235 | 0,43 | ||||
| 2025-05-14 | 13F | Rockefeller Capital Management L.P. | 0 | −100,00 | 0 | |||||
| 2025-07-18 | 13F | First United Bank Trust/ | 1 500 | −20,26 | 37 | −22,92 | ||||
| 2025-08-29 | 13F | Total Investment Management Inc | 8 277 | −99,61 | 204 | −99,62 | ||||
| 2025-07-08 | 13F | Choice Wealth Advisors, LLC | 284 044 | −0,05 | 7 007 | −3,38 | ||||
| 2025-08-11 | 13F | Citigroup Inc | 89 366 | 8,98 | 2 205 | 5,35 | ||||
| 2025-05-15 | 13F | Fwl Investment Management, Llc | 0 | −100,00 | 0 | |||||
| 2025-07-07 | 13F | Investors Research Corp | 216 | 0,00 | 5 | 0,00 | ||||
| 2025-08-13 | 13F | Millstone Evans Group, LLC | 0 | −100,00 | 0 | |||||
| 2025-08-14 | 13F | Napa Wealth Management | 0 | −100,00 | 0 | |||||
| 2025-07-24 | 13F | Endeavor Private Wealth, Inc. | 9 053 | −23,66 | 223 | −26,16 | ||||
| 2025-04-21 | 13F | Ronald Blue Trust, Inc. | 0 | −100,00 | 0 | |||||
| 2025-07-09 | 13F | HFG Wealth Management, LLC | 465 322 | 7,75 | 11 875 | 14,91 | ||||
| 2025-07-31 | 13F | Carrera Capital Advisors | 677 793 | 36,42 | 16 721 | 31,88 | ||||
| 2025-08-29 | 13F | Centaurus Financial, Inc. | 12 486 | −73,88 | 0 | −100,00 | ||||
| 2025-08-12 | 13F | Cornerstone Wealth Management, LLC | 9 979 | 0,21 | 246 | −3,15 | ||||
| 2025-09-04 | 13F/A | Advisor Group Holdings, Inc. | 320 815 | 2,62 | 7 917 | −0,78 | ||||
| 2025-08-14 | 13F | Visionary Wealth Advisors | 51 576 | −15,38 | 1 272 | −18,20 | ||||
| 2025-07-28 | 13F | RFG Advisory, LLC | 18 104 | 10,10 | 447 | 6,44 | ||||
| 2025-08-11 | 13F | Bulltick Wealth Management, LLC | 0 | −100,00 | 0 | |||||
| 2025-08-11 | 13F | Nations Financial Group Inc, /ia/ /adv | 112 759 | 11,20 | 2 782 | 7,50 | ||||
| 2025-08-12 | 13F | LPL Financial LLC | 2 693 294 | −5,86 | 66 444 | −9,00 | ||||
| 2025-08-04 | 13F | Kovack Advisors, Inc. | 19 541 | −0,41 | 482 | −3,60 | ||||
| 2025-08-14 | 13F | GWM Advisors LLC | 975 708 | 5,89 | 24 071 | 2,37 | ||||
| 2025-08-14 | 13F | Snowden Capital Advisors LLC | 16 767 | −6,22 | 414 | −9,43 | ||||
| 2025-08-13 | 13F | Jones Financial Companies Lllp | 0 | −100,00 | 0 | |||||
| 2025-08-08 | 13F | Pnc Financial Services Group, Inc. | 0 | −100,00 | 0 | −100,00 | ||||
| 2025-08-14 | 13F | AllSquare Wealth Management LLC | 142 050 | −2,46 | 3 504 | −5,71 | ||||
| 2025-05-13 | 13F | Core Wealth Partners LLC | 0 | −100,00 | 0 | |||||
| 2025-08-06 | 13F | Commonwealth Equity Services, Llc | 724 584 | −5,70 | 18 | −10,53 | ||||
| 2025-04-09 | 13F | St Germain D J Co Inc | 0 | −100,00 | 0 | |||||
| 2025-04-29 | 13F | Acorn Financial Advisory Services Inc /adv | 0 | −100,00 | 0 | |||||
| 2025-08-13 | 13F | Northwestern Mutual Wealth Management Co | 601 715 | 11,33 | 14 844 | 7,62 | ||||
| 2025-07-17 | 13F | Beacon Capital Management, LLC | 273 | 0,37 | 7 | 0,00 | ||||
| 2025-07-31 | 13F | Nilsine Partners, LLC | 0 | −100,00 | 0 | |||||
| 2025-08-01 | 13F | Envestnet Asset Management Inc | 644 831 | 38,07 | 15 908 | 33,47 | ||||
| 2025-08-13 | 13F | Stablepoint Partners, LLC | 34 172 | −26,39 | 843 | −28,80 | ||||
| 2025-08-07 | 13F | Kestra Private Wealth Services, Llc | 64 837 | 1,55 | 1 600 | −1,84 | ||||
| 2025-08-14 | 13F | Comerica Bank | 72 166 | −3,47 | 1 780 | −6,66 | ||||
| 2025-05-12 | 13F | SOUTH STATE Corp | 0 | −100,00 | 0 | |||||
| 2025-07-14 | 13F | Sowell Financial Services LLC | 13 240 | 12,49 | 327 | 8,67 | ||||
| 2025-07-21 | 13F | Ameritas Advisory Services, LLC | 99 441 | −0,41 | 2 453 | −1,92 | ||||
| 2025-08-14 | 13F | Royal Bank Of Canada | 1 471 871 | −0,93 | 36 311 | −4,23 | ||||
| 2025-07-03 | 13F | City Center Advisors, LLC | 15 664 | −5,49 | 386 | −8,53 | ||||
| 2025-08-14 | 13F | Integrated Wealth Concepts LLC | 111 547 | −5,95 | 2 752 | −9,09 | ||||
| 2025-07-29 | 13F | Koshinski Asset Management, Inc. | 46 122 | 0,54 | 1 138 | −2,82 | ||||
| 2025-08-04 | 13F | Spire Wealth Management | 965 | −60,21 | 24 | −62,30 | ||||
| 2025-04-25 | 13F | Sovran Advisors, LLC | 0 | −100,00 | 0 | |||||
| 2025-07-31 | 13F | Moment Partners, LLC | 125 574 | −0,56 | 3 098 | −3,88 | ||||
| 2025-07-25 | 13F | We Are One Seven, LLC | 28 209 | 147,84 | 696 | 139,66 | ||||
| 2025-07-10 | 13F | Focus Financial Network, Inc. | 27 665 | 12,33 | 682 | 8,60 | ||||
| 2025-04-18 | 13F | Wolf Group Capital Advisors | 396 177 | 52,71 | 10 110 | 71,15 | ||||
| 2025-07-17 | 13F | Janney Montgomery Scott LLC | 94 995 | −17,68 | 2 | 0,00 | ||||
| 2025-08-06 | 13F | Wedbush Securities Inc | 10 694 | 1,08 | 0 | |||||
| 2025-05-15 | 13F | Hilltop Holdings Inc. | 0 | −100,00 | 0 | |||||
| 2025-08-12 | 13F | Park Square Financial Group, LLC | 31 183 | −20,68 | 769 | −23,33 | ||||
| 2025-08-13 | 13F | Continuum Advisory, LLC | 0 | −100,00 | 0 | |||||
| 2025-08-13 | 13F/A | StoneX Group Inc. | 0 | −100,00 | 0 | −100,00 | ||||
| 2025-08-11 | 13F | Synergy Investment Management, LLC | 0 | −100,00 | 0 | |||||
| 2025-05-15 | 13F/A | Orion Portfolio Solutions, LLC | 97 811 | −12,95 | 2 496 | −7,14 | ||||
| 2025-08-08 | 13F | Larson Financial Group LLC | 1 165 | −56,66 | 29 | −58,82 | ||||
| 2025-05-02 | 13F | Signaturefd, Llc | 0 | −100,00 | 0 | |||||
| 2025-08-04 | 13F | Creative Financial Designs Inc /adv | 1 197 | 1 895,00 | 30 | 2 800,00 | ||||
| 2025-07-01 | 13F | Harbor Investment Advisory, Llc | 52 | 0,00 | 1 | 0,00 | ||||
| 2025-08-14 | 13F | Fmr Llc | 73 | 2 | ||||||
| 2025-07-22 | 13F | Global Assets Advisory, LLC | 0 | −100,00 | 0 | |||||
| 2025-08-12 | 13F | Steward Partners Investment Advisory, Llc | 51 624 | 3,39 | 1 274 | −0,08 | ||||
| 2025-08-19 | 13F | Advisory Services Network, LLC | 18 740 | −0,04 | 466 | −2,51 | ||||
| 2025-05-15 | 13F | Qube Research & Technologies Ltd | 0 | −100,00 | 0 | |||||
| 2025-08-04 | 13F | Flagship Harbor Advisors, Llc | 24 465 | 604 | ||||||
| 2025-07-29 | 13F | Salomon & Ludwin, LLC | 649 | 0,00 | 16 | 0,00 | ||||
| 2025-05-14 | 13F | Jane Street Group, Llc | 15 006 | 383 | ||||||
| 2025-08-07 | 13F | Allworth Financial LP | 775 | 0,65 | 19 | 0,00 | ||||
| 2025-08-12 | 13F | Calton & Associates, Inc. | 12 771 | 315 | ||||||
| 2025-07-11 | 13F | Pinnacle Bancorp, Inc. | 900 | 0,00 | 22 | 0,00 | ||||
| 2025-08-05 | 13F | Dunhill Financial, LLC | 253 624 | 198,17 | 6 257 | 188,29 | ||||
| 2025-08-14 | 13F | Transamerica Financial Advisors, Inc. | 6 679 | −11,91 | 165 | |||||
| 2025-08-01 | 13F | Motco | 881 | 0,00 | 22 | −4,55 | ||||
| 2025-08-07 | 13F | Americana Partners, LLC | 13 188 | 12,54 | 325 | 8,70 | ||||
| 2025-08-12 | 13F | Jpmorgan Chase & Co | 63 320 | −47,63 | 1 562 | −49,37 | ||||
| 2025-04-17 | 13F | Sound Income Strategies, LLC | 0 | −100,00 | 0 | |||||
| 2025-08-19 | 13F | Newbridge Financial Services Group, Inc. | 1 117 | 54,07 | 28 | 50,00 | ||||
| 2025-07-31 | 13F | Oppenheimer & Co Inc | 40 940 | −49,87 | 1 010 | −51,58 | ||||
| 2025-08-14 | 13F | CoreCap Advisors, LLC | 6 068 | 1 599,72 | 150 | 1 555,56 | ||||
| 2025-08-14 | 13F | Benjamin Edwards Inc | 101 674 | 211,47 | 2 508 | 201,08 | ||||
| 2025-08-06 | 13F | Climber Capital SA | 144 878 | −0,10 | 3 463 | 15,59 | ||||
| 2025-04-23 | 13F | VisionPoint Advisory Group, LLC | 0 | −100,00 | 0 | |||||
| 2025-04-24 | 13F | Wingate Wealth Advisors, Inc. | 0 | −100,00 | 0 | |||||
| 2025-08-14 | 13F | Harwood Advisory Group, LLC | 161 392 | −19,83 | 3 982 | −17,36 | ||||
| 2025-08-13 | 13F | GeoWealth Management, LLC | 11 799 | −4,37 | 291 | −7,32 | ||||
| 2025-08-08 | 13F | Crossmark Global Holdings, Inc. | 25 423 | −13,64 | 626 | −16,53 | ||||
| 2025-07-24 | 13F | Callan Family Office, LLC | 27 500 | 1,85 | 678 | −1,60 | ||||
| 2025-08-06 | 13F | Moors & Cabot, Inc. | 0 | −100,00 | 0 | |||||
| 2025-08-14 | 13F | Sargent Investment Group, LLC | 50 284 | −7,84 | 1 240 | −10,92 | ||||
| 2025-07-23 | 13F | Clear Creek Financial Management, LLC | 141 380 | 5,15 | 3 488 | 1,63 | ||||
| 2025-08-05 | 13F | Lord & Richards Wealth Management, LLC | 0 | −100,00 | 0 | |||||
| 2025-08-06 | 13F | First Horizon Advisors, Inc. | 3 322 | 62,68 | 82 | 55,77 | ||||
| 2025-08-14 | 13F | Susquehanna International Group, Llp | 81 198 | 2 003 | ||||||
| 2025-08-01 | 13F | Oarsman Capital, Inc. | 20 590 | −18,98 | 508 | −21,76 | ||||
| 2025-07-30 | 13F | TFB Advisors LLC | 13 063 | −1,19 | 322 | −4,45 | ||||
| 2025-08-12 | 13F | Wayfinding Financial, LLC | 0 | −100,00 | 0 | |||||
| 2025-07-28 | 13F | Mutual Advisors, LLC | 49 508 | −6,85 | 1 253 | −4,79 | ||||
| 2025-08-14 | 13F | UBS Group AG | 1 232 465 | 1,14 | 30 405 | −2,23 | ||||
| 2025-07-24 | 13F | Cyndeo Wealth Partners, LLC | 907 795 | 2,64 | 22 395 | −0,78 | ||||
| 2025-08-01 | 13F | Ashton Thomas Private Wealth, LLC | 29 941 | 25,90 | 739 | 21,78 | ||||
| 2025-07-17 | 13F | Northwest Wealth Management, Llc | 8 592 | 8,51 | 212 | 4,46 | ||||
| 2025-08-12 | 13F | CIBC Private Wealth Group, LLC | 0 | −100,00 | 0 | |||||
| 2025-08-06 | 13F/A | Headland Capital, LLC | 16 387 | −1,62 | 404 | −4,94 | ||||
| 2025-08-14 | 13F | IHT Wealth Management, LLC | 22 342 | 1,28 | 551 | −1,96 | ||||
| 2025-04-21 | 13F | Johnson Investment Counsel Inc | 0 | −100,00 | 0 | |||||
| 2025-08-06 | 13F | AE Wealth Management LLC | 12 573 | −20,70 | 310 | −23,27 | ||||
| 2025-08-12 | 13F | Cutter & CO Brokerage, Inc. | 0 | −100,00 | 0 | |||||
| 2025-08-18 | 13F | Tyler-Stone Wealth Management | 9 144 | 0,00 | 226 | −3,43 | ||||
| 2025-07-30 | 13F | D.a. Davidson & Co. | 119 459 | 3,26 | 2 947 | −0,17 | ||||
| 2025-08-04 | 13F | L.m. Kohn & Company | 33 004 | 85,07 | 814 | 78,90 | ||||
| 2025-08-14 | 13F | Sunbelt Securities, Inc. | 3 008 | 29,94 | 72 | 20,34 | ||||
| 2025-07-14 | 13F | Farmers & Merchants Investments Inc | 2 894 | 0,00 | 71 | −2,74 | ||||
| 2025-08-15 | 13F | Kestra Advisory Services, LLC | 175 293 | −21,54 | 4 324 | −24,15 | ||||
| 2025-07-16 | 13F | Brown, Lisle/cummings, Inc. | 0 | −100,00 | 0 | |||||
| 2025-08-08 | 13F | SBI Securities Co., Ltd. | 910 | −10,43 | 22 | −12,00 | ||||
| 2025-07-23 | 13F | West Paces Advisors Inc. | 0 | −100,00 | 0 | |||||
| 2025-04-10 | 13F | Clarus Wealth Advisors | 0 | −100,00 | 0 | |||||
| 2025-07-16 | 13F | Magnus Financial Group LLC | 289 476 | 4,24 | 7 141 | 0,78 | ||||
| 2025-08-08 | 13F | Cetera Investment Advisers | 379 476 | 4,47 | 9 362 | 0,99 | ||||
| 2025-08-15 | 13F | Captrust Financial Advisors | 45 095 | 2,66 | 1 112 | −0,80 | ||||
| 2025-08-06 | 13F | Waverton Investment Management Ltd | 214 725 | 3,28 | 5 296 | −0,13 | ||||
| 2025-08-15 | 13F | First Heartland Consultants, Inc. | 14 584 | 7,65 | 360 | 4,06 | ||||
| 2025-07-29 | 13F | Stratos Wealth Partners, LTD. | 31 421 | −0,66 | 775 | −3,97 | ||||
| 2025-08-13 | 13F | Flow Traders U.s. Llc | 271 250 | 7 | ||||||
| 2025-07-16 | 13F | Cadent Capital Advisors, LLC | 62 505 | −11,58 | 1 542 | −14,58 | ||||
| 2025-07-24 | 13F | WMG Financial Advisors, LLC | 21 065 | 0,00 | 520 | −3,35 | ||||
| 2025-07-24 | 13F | Baldwin Brothers Inc/ma | 37 692 | −8,08 | 930 | −11,19 | ||||
| 2025-08-05 | 13F | GPS Wealth Strategies Group, LLC | 27 670 | 10,26 | 683 | 6,56 | ||||
| 2025-08-05 | 13F | Key FInancial Inc | 1 591 | 0,00 | 39 | −2,50 | ||||
| 2025-07-25 | NP | LALT - First Trust Multi-Strategy Alternative ETF | 44 913 | 107,81 | 1 078 | 116,90 | ||||
| 2025-05-02 | 13F | Wealthfront Advisers Llc | 0 | −100,00 | 0 | −100,00 | ||||
| 2025-08-12 | 13F | Financial Advocates Investment Management | 34 372 | −1,30 | 848 | −4,62 | ||||
| 2025-07-14 | 13F | AdvisorNet Financial, Inc | 2 202 | −5,33 | 54 | −8,47 | ||||
| 2025-08-08 | 13F | Petix & Botte Co | 446 745 | −7,63 | 11 021 | −10,71 | ||||
| 2025-07-30 | 13F | Whittier Trust Co Of Nevada Inc | 172 | 0,00 | 4 | 0,00 | ||||
| 2025-08-11 | 13F | Western Wealth Management, LLC | 39 831 | −4,30 | 983 | −7,53 | ||||
| 2025-07-17 | 13F | Mainsail Financial Group, LLC | 392 540 | 2,83 | 9 892 | 1,54 | ||||
| 2025-07-14 | 13F | E&G Advisors, LP | 19 286 | −1,63 | 476 | −5,00 | ||||
| 2025-04-24 | 13F | Mascoma Wealth Management LLC | 0 | −100,00 | 0 | −100,00 | ||||
| 2025-07-15 | 13F | tru Independence LLC | 24 229 | −47,80 | 598 | −49,58 | ||||
| 2025-07-17 | 13F | Genesis Private Wealth, Llc | 8 856 | −3,52 | 218 | −6,84 | ||||
| 2025-05-01 | 13F | Hughes Financial Services, LLC | 0 | 0 | ||||||
| 2025-08-06 | 13F | Golden State Wealth Management, LLC | 1 804 | 0,11 | 45 | −2,22 | ||||
| 2025-08-18 | 13F | Geneos Wealth Management Inc. | 4 296 | 202,54 | 106 | 191,67 | ||||
| 2025-07-31 | 13F | Cambridge Investment Research Advisors, Inc. | 582 536 | 3,54 | 14 | 0,00 | ||||
| 2025-08-06 | 13F | Walkner Condon Financial Advisors LLC | 84 401 | 14,95 | 2 082 | 11,16 | ||||
| 2025-08-08 | 13F | Flaharty Asset Management, LLC | 929 869 | 2,65 | 22 940 | −0,77 | ||||
| 2025-08-15 | 13F | Tower Research Capital LLC (TRC) | 10 | 0 | ||||||
| 2025-08-14 | 13F | Wiley Bros.-aintree Capital, Llc | 519 211 | 65,19 | 12 835 | 61,79 | ||||
| 2025-07-22 | 13F | DAVENPORT & Co LLC | 88 986 | −1,52 | 2 195 | −4,81 | ||||
| 2025-08-12 | 13F | Coldstream Capital Management Inc | 12 164 | −70,01 | 300 | −71,01 | ||||
| 2025-08-08 | 13F | Avantax Advisory Services, Inc. | 67 214 | 0,71 | 1 658 | −2,64 | ||||
| 2025-08-27 | 13F/A | Brinker Capital Investments, LLC | 89 105 | −8,90 | 2 198 | −11,94 | ||||
| 2025-07-09 | 13F | Inspirion Wealth Advisors, Llc | 121 238 | −0,87 | 2 991 | −4,20 | ||||
| 2025-08-14 | 13F | Certified Advisory Corp | 22 675 | 74,83 | 559 | 69,39 | ||||
| 2025-08-08 | 13F | Hartland & Co., LLC | 4 745 | −8,13 | 117 | −10,69 | ||||
| 2025-08-11 | 13F | Parr Mcknight Wealth Management Group, Llc | 97 580 | −4,77 | 2 407 | −7,92 | ||||
| 2025-08-05 | 13F | Advisors Preferred, LLC | 0 | −100,00 | 0 | |||||
| 2025-08-07 | 13F | PCG Wealth Advisors, LLC | 121 031 | −9,62 | 2 986 | −12,64 | ||||
| 2025-05-12 | 13F | Aft, Forsyth & Sober, LLC | 0 | −100,00 | 0 | |||||
| 2025-07-09 | 13F | First Financial Corp /in/ | 195 | −80,20 | 5 | −84,00 | ||||
| 2025-08-11 | 13F | Chiron Capital Management, Llc | 75 596 | −5,59 | 1 865 | −8,76 | ||||
| 2025-07-09 | 13F | Tounjian Advisory Partners, Llc | 114 526 | −1,35 | 2 923 | −1,35 | ||||
| 2025-08-12 | 13F | Global Retirement Partners, LLC | 16 129 | −8,32 | 398 | −5,48 | ||||
| 2025-05-08 | NP | QALTX - Quantified Alternative Investment Fund Investor Class Shares | 9 107 | −74,19 | 232 | −72,58 | ||||
| 2025-07-22 | 13F | Accel Wealth Management | 17 709 | −14,70 | 437 | −17,58 | ||||
| 2025-07-21 | 13F | Mechanics Financial Corp | 2 000 | 0,00 | 49 | −3,92 | ||||
| 2025-08-11 | 13F | Hexagon Capital Partners LLC | 0 | −100,00 | 0 | |||||
| 2025-07-30 | 13F | Strategic Blueprint, LLC | 0 | −100,00 | 0 | |||||
| 2025-08-07 | 13F | Sierra Ocean, Llc | 2 000 | 49 | ||||||
| 2025-07-21 | 13F | Barrett & Company, Inc. | 1 246 | 0,00 | 31 | −3,23 | ||||
| 2025-08-14 | 13F | Bank Of America Corp /de/ | 51 984 | 115,07 | 1 282 | 108,12 | ||||
| 2025-05-02 | 13F | Cullen/frost Bankers, Inc. | 0 | −100,00 | 0 | |||||
| 2025-08-12 | 13F | Jaffetilchin Investment Partners, LLC | 11 868 | −51,92 | 293 | −53,58 | ||||
| 2025-08-14 | 13F | Guardian Wealth Advisors, Llc / Nc | 121 462 | −1,12 | 2 996 | −4,40 | ||||
| 2025-07-08 | 13F | Nbc Securities, Inc. | 6 474 | −22,35 | 0 | |||||
| 2025-07-28 | 13F | Cushing Capital Partners, LLC | 14 304 | −1,56 | 353 | −4,86 | ||||
| 2025-08-04 | 13F | Pensionmark Financial Group, Llc | 0 | −100,00 | 0 | |||||
| 2025-07-01 | 13F | Park National Corp /oh/ | 0 | −100,00 | 0 | |||||
| 2025-08-06 | 13F | Csenge Advisory Group | 670 056 | 0,49 | 16 088 | −1,39 | ||||
| 2025-08-06 | 13F | Aspect Partners, LLC | 20 122 | 0,00 | 496 | −3,31 | ||||
| 2025-08-14 | 13F | Graney & King, LLC | 0 | −100,00 | 0 | |||||
| 2025-07-09 | 13F | WealthCare Investment Partners, LLC | 24 945 | −1,92 | 623 | 0,48 | ||||
| 2025-08-13 | 13F | EverSource Wealth Advisors, LLC | 211 | 0,96 | 5 | 0,00 | ||||
| 2025-08-05 | 13F | Plante Moran Financial Advisors, LLC | 10 831 | 0,00 | 267 | −3,26 | ||||
| 2025-07-22 | 13F | Miracle Mile Advisors, LLC | 64 274 | −4,91 | 1 586 | −8,12 | ||||
| 2025-08-14 | 13F | Wells Fargo & Company/mn | 37 326 643 | −1,06 | 920 848 | −4,36 | ||||
| 2025-07-14 | 13F | ABLE Financial Group, LLC | 240 178 | 8,44 | 5 925 | 4,83 | ||||
| 2025-08-08 | 13F | TD Capital Management LLC | 0 | −100,00 | 0 | |||||
| 2025-07-22 | 13F | Merit Financial Group, LLC | 19 239 | −3,95 | 475 | −7,24 | ||||
| 2025-07-31 | 13F | FSM Wealth Advisors, LLC | 8 515 | 212 | ||||||
| 2025-08-04 | 13F | Assetmark, Inc | 57 955 | 16,01 | 1 430 | 12,17 | ||||
| 2025-08-14 | 13F | Bnp Paribas Arbitrage, Sa | 0 | −100,00 | 0 | |||||
| 2025-07-23 | 13F | Solitude Financial Services | 321 621 | 6,10 | 7 934 | 2,57 | ||||
| 2025-07-15 | 13F | Fifth Third Bancorp | 0 | −100,00 | 0 | |||||
| 2025-08-13 | 13F | Virtue Capital Management, LLC | 0 | −100,00 | 0 | |||||
| 2025-07-28 | 13F | Axxcess Wealth Management, Llc | 264 993 | 6,14 | 6 537 | 2,61 | ||||
| 2025-07-28 | 13F | Private Wealth Asset Management, LLC | 2 930 | 98,91 | 72 | 94,59 | ||||
| 2025-08-14 | 13F | Raymond James Financial Inc | 733 284 | −30,92 | 18 090 | −33,22 | ||||
| 2025-07-07 | 13F | Nova Wealth Management, Inc. | 140 | −85,39 | 3 | −87,50 | ||||
| 2025-08-08 | 13F | WASHINGTON TRUST Co | 0 | −100,00 | 0 | |||||
| 2025-07-29 | 13F | Private Trust Co Na | 1 485 | −21,88 | 37 | −25,00 | ||||
| 2025-07-30 | 13F | Capital Wealth Alliance, LLC | 21 150 | −1,13 | 522 | −4,40 | ||||
| 2025-08-15 | 13F | Resources Management Corp /ct/ /adv | 33 | 0,00 | 0 | |||||
| 2025-08-06 | 13F | Prospera Financial Services Inc | 288 206 | 5,30 | 7 111 | 1,80 | ||||
| 2025-08-08 | 13F | Creative Planning | 11 425 | −22,85 | 282 | −25,46 | ||||
| 2025-07-18 | 13F | Truist Financial Corp | 108 676 | −6,93 | 2 681 | −10,03 | ||||
| 2025-08-14 | 13F | Modern Wealth Management, LLC | 19 875 | −3,68 | 490 | −6,84 | ||||
| 2025-08-12 | 13F | Gladstone Institutional Advisory LLC | 240 578 | 3,38 | 5 935 | −0,05 | ||||
| 2025-08-08 | 13F | POM Investment Strategies, LLC | 43 | 0,00 | 1 | 0,00 | ||||
| 2025-07-24 | 13F | IFP Advisors, Inc | 12 121 | −97,81 | 299 | −97,89 | ||||
| 2025-07-24 | 13F | Cascade Investment Group, Inc. | 48 450 | 1,41 | 1 195 | −1,97 | ||||
| 2025-07-25 | 13F | Atria Wealth Solutions, Inc. | 48 838 | −53,39 | 1 205 | −54,96 | ||||
| 2025-07-10 | 13F | Fortress Wealth Management, Inc. | 289 302 | −0,21 | 7 137 | −3,53 | ||||
| 2025-08-12 | 13F | Change Path, LLC | 31 157 | −9,72 | 769 | −12,73 | ||||
| 2025-07-22 | 13F | Simplicity Wealth,LLC | 28 500 | 136,16 | 703 | 128,99 | ||||
| 2025-08-04 | 13F | IFG Advisory, LLC | 8 871 | 219 | ||||||
| 2025-05-12 | 13F | Independent Advisor Alliance | 0 | −100,00 | 0 | |||||
| 2025-08-04 | 13F | Creekmur Asset Management LLC | 2 004 | −0,05 | 49 | −3,92 | ||||
| 2025-07-01 | 13F | Private Client Services, Llc | 0 | −100,00 | 0 | |||||
| 2025-07-07 | 13F | Thurston, Springer, Miller, Herd & Titak, Inc. | 5 828 | 202,13 | 144 | 191,84 | ||||
| 2025-07-14 | 13F | Financial Enhancement Group LLC | 352 951 | 0,70 | 8 979 | 4,53 | ||||
| 2025-07-07 | 13F | Capital Asset Advisory Services LLC | 266 531 | 6,34 | 6 581 | 1,92 | ||||
| 2025-07-23 | 13F | Proffitt & Goodson Inc | 50 | 0,00 | 1 | 0,00 | ||||
| 2025-07-21 | 13F | Corundum Group, Inc. | 72 716 | −0,74 | 1 794 | −4,07 | ||||
| 2025-08-13 | 13F | Capital Analysts, Inc. | 167 | 0,00 | 0 | |||||
| 2025-07-03 | 13F | Arvest Investments, Inc. | 246 672 | −1,78 | 6 085 | −5,04 | ||||
| 2025-08-04 | 13F | Atria Investments Llc | 9 851 | 243 | ||||||
| 2025-07-23 | 13F | Trueblood Wealth Management, LLC | 51 985 | −1,64 | 1 282 | −4,90 | ||||
| 2025-07-21 | 13F | Ameriflex Group, Inc. | 0 | −100,00 | 0 | |||||
| 2025-07-16 | 13F/A | CX Institutional | 1 135 | 0,00 | 0 | |||||
| 2025-07-01 | 13F | Burkett Financial Services, Llc | 0 | −100,00 | 0 | |||||
| 2025-08-14 | 13F | Mariner, LLC | 20 203 | 142,13 | 498 | 134,91 | ||||
| 2025-08-15 | 13F | Asset Allocation Strategies LLC | 31 915 | −13,14 | 787 | −16,01 | ||||
| 2025-08-13 | 13F | Baird Financial Group, Inc. | 72 308 | −1,02 | 1 784 | −4,35 | ||||
| 2025-05-16 | 13F/A | Kestra Investment Management, LLC | 0 | −100,00 | 0 | |||||
| 2025-04-21 | 13F | Nelson, Van Denburg & Campbell Wealth Management Group, LLC | 0 | −100,00 | 0 | |||||
| 2025-07-21 | 13F | DHJJ Financial Advisors, Ltd. | 430 | 0,00 | 11 | 0,00 | ||||
| 2025-08-11 | 13F | HighTower Advisors, LLC | 98 912 | −18,03 | 2 440 | −20,75 | ||||
| 2025-08-15 | 13F | Equitable Holdings, Inc. | 46 236 | 21,90 | 1 141 | 17,89 | ||||
| 2025-07-11 | 13F | Farther Finance Advisors, LLC | 9 053 | −17,32 | 223 | −20,36 | ||||
| 2025-08-20 | 13F/A | Coppell Advisory Solutions LLC | 71 685 | 39,12 | 1 768 | 39,90 | ||||
| 2025-04-25 | 13F | Farmers & Merchants Trust Co of Chambersburg PA | 0 | −100,00 | 0 | |||||
| 2025-07-28 | 13F | Frazier Financial Advisors, LLC | 33 | 0,00 | 1 | |||||
| 2025-08-12 | 13F | MAI Capital Management | 57 | −24,00 | 1 | 0,00 | ||||
| 2025-07-16 | 13F | Beaumont Financial Advisors, LLC | 0 | −100,00 | 0 | |||||
| 2025-07-25 | 13F | Cwm, Llc | 607 725 | 8,47 | 15 | 0,00 | ||||
| 2025-04-21 | 13F | PSI Advisors, LLC | 0 | −100,00 | 0 | |||||
| 2025-08-08 | 13F | MTM Investment Management, LLC | 30 645 | 20,36 | 756 | 15,95 | ||||
| 2025-08-05 | 13F | EPG Wealth Management LLC | 12 049 | −60,61 | 297 | −61,92 | ||||
| 2025-08-12 | 13F | Proequities, Inc. | 0 | 0 | ||||||
| 2025-08-13 | 13F | Holos Integrated Wealth LLC | 229 | −71,97 | 6 | −75,00 | ||||
| 2025-08-07 | 13F | Resources Investment Advisors, LLC. | 16 005 | −5,91 | 395 | −9,22 | ||||
| 2025-08-04 | 13F | Arkadios Wealth Advisors | 56 397 | −2,40 | 1 391 | −5,63 | ||||
| 2025-08-05 | 13F | Strategic Financial Concepts, LLC | 0 | −100,00 | 0 | |||||
| 2025-08-13 | 13F | First Trust Advisors Lp | 49 860 | −1,71 | 1 230 | −4,95 | ||||
| 2025-08-15 | 13F | Puff Wealth Management, Llc | 22 762 | −3,23 | 562 | −6,50 | ||||
| 2025-08-27 | 13F | Barnes Wealth Management Group, Inc | 8 593 | 2,69 | 212 | −0,94 | ||||
| 2025-05-15 | 13F | Hall Laurie J Trustee | 0 | −100,00 | 0 | |||||
| 2025-07-28 | 13F | Harbour Investments, Inc. | 90 592 | −1,19 | 2 235 | −4,49 | ||||
| 2025-08-14 | 13F | Ameriprise Financial Inc | 10 294 | −54,63 | 254 | −56,30 | ||||
| 2025-07-31 | 13F | Buckingham Strategic Partners | 8 678 | 9,52 | 214 | 5,94 | ||||
| 2025-07-24 | 13F | Columbia Advisory Partners Llc | 52 486 | −0,75 | 1 295 | −4,08 | ||||
| 2025-08-11 | 13F | Private Advisor Group, LLC | 69 757 | −72,24 | 1 721 | −73,18 | ||||
| 2025-08-12 | 13F | J.w. Cole Advisors, Inc. | 21 178 | 4,91 | 522 | 1,36 | ||||
| 2025-07-30 | 13F | IMG Wealth Management, Inc. | 2 109 | −24,08 | 52 | −25,71 | ||||
| 2025-07-28 | 13F | Copia Wealth Management | 14 423 | 34,98 | 356 | 30,51 | ||||
| 2025-08-13 | 13F | Raab & Moskowitz Asset Management LLC | 58 756 | 1,04 | 1 450 | −2,36 | ||||
| 2025-07-30 | 13F | Crewe Advisors LLC | 1 092 | 27 | ||||||
| 2025-08-13 | 13F | Townsquare Capital Llc | 0 | −100,00 | 0 | |||||
| 2025-08-15 | 13F | Morgan Stanley | 10 756 524 | 14,70 | 265 363 | 10,88 | ||||
| 2025-07-11 | 13F | Shelton Wealth Management, Llc | 16 087 | −83,43 | 397 | −84,01 | ||||
| 2025-07-24 | 13F | Morton Brown Family Wealth, LLC | 7 374 | −9,54 | 182 | −12,98 | ||||
| 2025-08-19 | 13F | National Asset Management, Inc. | 0 | −100,00 | 0 | |||||
| 2025-07-18 | 13F | SigFig Wealth Management, LLC | 8 155 | −5,19 | 201 | −7,37 | ||||
| 2025-08-12 | 13F | Wisconsin Wealth Advisors, LLC | 0 | −100,00 | 0 | −100,00 | ||||
| 2025-08-13 | 13F | Quadrature Capital Ltd | 258 239 | 6 371 | ||||||
| 2025-07-10 | 13F | Wealth Enhancement Advisory Services, Llc | 30 989 | −25,93 | 774 | −27,46 | ||||
| 2025-07-23 | 13F | Valmark Advisers, Inc. | 586 384 | 3,14 | 14 466 | −0,29 | ||||
| 2025-08-08 | 13F | Foundations Investment Advisors, LLC | 0 | −100,00 | 0 | |||||
| 2025-07-25 | 13F | Concurrent Investment Advisors, LLC | 135 707 | −0,20 | 3 348 | −3,54 | ||||
| 2025-08-14 | 13F | Mml Investors Services, Llc | 104 850 | 65,78 | 3 | 100,00 | ||||
| 2025-08-13 | 13F | Great Diamond Partners, LLC | 317 076 | 1,36 | 7 822 | −2,02 | ||||
| 2025-07-24 | 13F | Us Bancorp \de\ | 743 | 16,28 | 18 | 12,50 | ||||
| 2025-08-12 | 13F | Bokf, Na | 0 | −100,00 | 0 | |||||
| 2025-08-13 | 13F | Congress Wealth Management LLC / DE / | 807 532 | 19 922 | ||||||
| 2025-08-13 | 13F | Renaissance Technologies Llc | 49 900 | −67,19 | 1 231 | −68,28 | ||||
| 2025-07-09 | 13F | Reyes Financial Architecture, Inc. | 141 | 0,00 | 3 | 0,00 | ||||
| 2025-07-28 | 13F | Interchange Capital Partners, LLC | 20 | 297 | ||||||
| 2025-08-14 | 13F | Osterweis Capital Management Inc | 635 | −2,91 | ||||||
| 2025-07-28 | 13F | Lunt Capital Management, Inc. | 23 118 | 1,63 | 570 | −1,72 | ||||
| 2025-08-11 | 13F | Brown Brothers Harriman & Co | 1 639 | 41,66 | 40 | 37,93 | ||||
| 2025-08-13 | 13F | Cheviot Value Management, LLC | 38 | 0,00 | 1 | |||||
| 2025-08-05 | 13F | Landmark Wealth Management, Inc. | 0 | −100,00 | 0 | |||||
| 2025-08-14 | 13F | Objective Capital Management, LLC | 10 023 | 0,13 | 247 | −3,14 | ||||
| 2025-04-30 | 13F | Sofos Investments, Inc. | 0 | −100,00 | 0 | |||||
| 2025-07-16 | 13F | Castleview Partners, Llc | 9 284 | −33,06 | 229 | −35,13 | ||||
| 2025-07-23 | 13F | Bennett Associates Wealth Management | 84 299 | −8,11 | 2 080 | −11,19 | ||||
| 2025-08-14 | 13F | Marshall Investment Management, Llc | 0 | −100,00 | 0 | |||||
| 2025-07-17 | 13F | LexAurum Advisors, LLC | 299 537 | 7 390 | ||||||
| 2025-07-10 | 13F | Envision Financial LLC | 30 420 | −9,04 | 750 | −12,08 | ||||
| 2025-07-15 | 13F | BKA Wealth Consulting, Inc. | 20 637 | −10,60 | 509 | −13,58 | ||||
| 2025-08-04 | 13F | Waterfront Wealth Inc. | 39 720 | −5,83 | 980 | −9,01 | ||||
| 2025-08-05 | 13F | Bank Of Montreal /can/ | 49 700 | 1 226 |