Grundläggande statistik
| Institutionella ägare | 210 total, 210 long only, 0 short only, 0 long/short - change of 5,47% MRQ |
| Genomsnittlig portföljallokering | 0.2464 % - change of 4,56% MRQ |
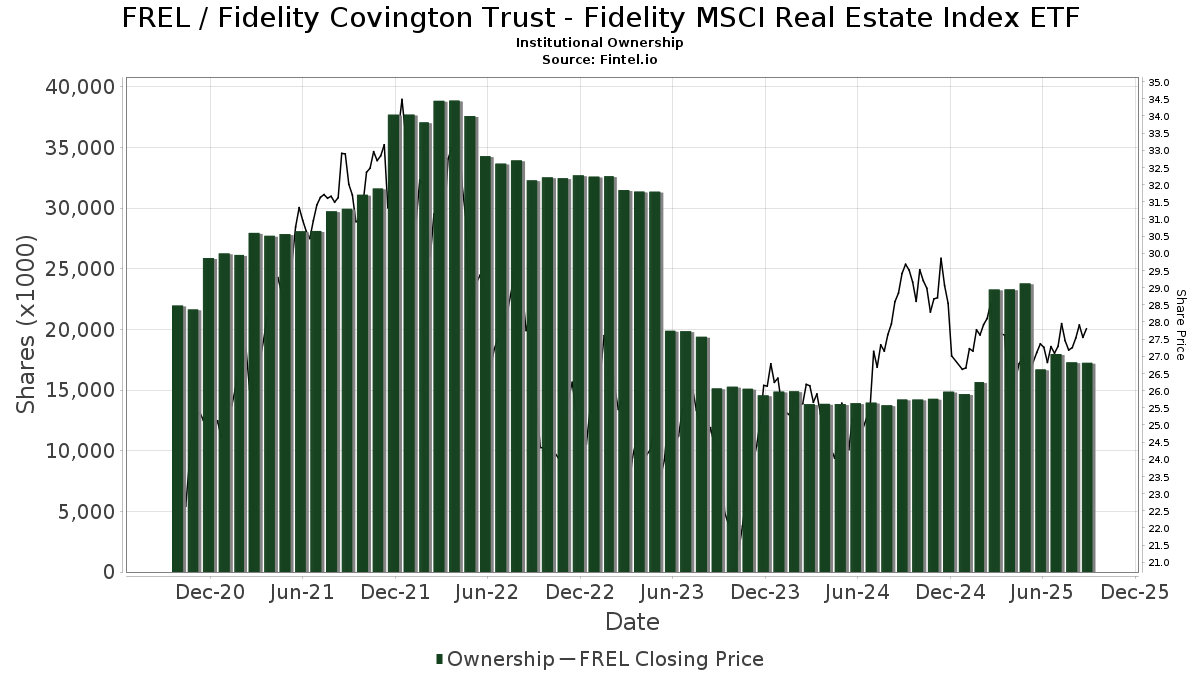
| Institutionella aktier (lång) | 17 243 417 (ex 13D/G) - change of 0,54MM shares 3,26% MRQ |
| Institutionellt värde (lång) | $ 442 763 USD ($1000) |
Institutionellt ägande och aktieägare
Fidelity Covington Trust - Fidelity MSCI Real Estate Index ETF (US:FREL) har 210 Institutionella ägare och aktieägare som har lämnat in 13D/G- eller 13F-formulär till Securities Exchange Commission (SEC). Dessa institut innehar totalt 17,243,417 aktier. Största aktieägare inkluderar Northern Lights Fund Trust - PFG Fidelity Institutional AM® Equity Sector Strategy Fund Class R Shares, Lido Advisors, LLC, Pnc Financial Services Group, Inc., AE Wealth Management LLC, Citizens & Northern Corp, Truefg, Llc, Black Diamond Financial, LLC, Envestnet Asset Management Inc, Commonwealth Equity Services, Llc, and Riverpoint Wealth Management Holdings, LLC .
Fidelity Covington Trust - Fidelity MSCI Real Estate Index ETF (ARCA:FREL) Institutionell ägarstruktur visar institutioners och fonders nuvarande positioner i företaget, samt de senaste förändringarna i positionernas storlek. Större aktieägare kan vara enskilda investerare, fonder, hedgefonder eller institutioner. Bilaga 13D visar att investeraren äger (eller ägde) mer än 5% av företaget och avser (eller avsåg) att aktivt eftersträva en förändring av affärsstrategin. Schedule 13G indikerar en passiv investering på över 5%.
The share price as of September 12, 2025 is 28,18 / share. Previously, on September 12, 2024, the share price was 29,53 / share. This represents a decline of 4,57% over that period.
Fondsentimentets poäng
Fondsentimentet poängen(fka Ägarackumulation-poäng) visar vilka aktier som är mest köpta av fonder. Det är resultatet av en sofistikerad kvantitativ flerfaktormodell som identifierar företag med de högsta nivåerna av institutionell ackumulering. Poängsättningsmodellen använder en kombination av den totala ökningen av redovisade ägare, förändringarna i portföljallokeringarna för dessa ägare och andra mått. Siffran sträcker sig från 0 till 100, där högre siffror indikerar en högre nivå av ackumulering i förhållande till sina konkurrenter, och 50 är genomsnittet.
Uppdateringsfrekvens: Dagligen
Se Ownership Explorer, som innehåller en lista över de högst rankade företagen.
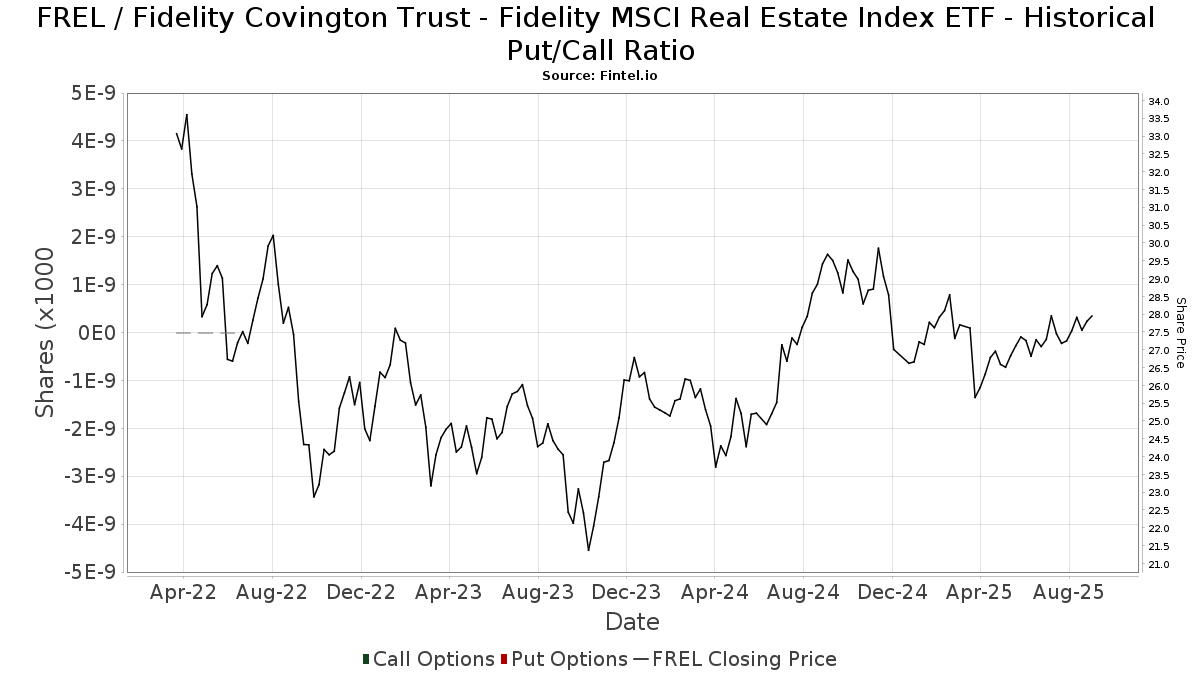
Institutionell sälj/köp-kvot
Förutom att rapportera vanliga eget kapital- och skuldemissioner måste institutioner med mer än 100MM tillgångar under förvaltning också avslöja sina innehav av sälj- och köpoptioner. Eftersom säljoptioner i allmänhet indikerar ett negativt sentiment och köpoptioner indikerar ett positivt sentiment, kan vi få en uppfattning om det övergripande institutionella sentimentet genom att plotta förhållandet mellan säljoptioner och köpoptioner. Diagrammet till höger visar det historiska förhållandet mellan sälj- och köpoptioner för detta instrument.
Genom att använda sälj/köp-kvoten som en indikator på aktieägarnas sentiment undviker man en av de största bristerna med att använda det totala institutionella ägandet, nämligen att en betydande del av de förvaltade tillgångarna investeras passivt för att följa index. Passivt förvaltade fonder köper vanligtvis inte optioner, så indikatorn för sälj/köp-kvoten ger en bättre bild av stämningen i aktivt förvaltade fonder.
13F- och NPORT-arkiveringar
Detaljer om 13F-arkiveringar är gratis. Detaljer om NP-arkiveringar kräver ett premiummedlemskap. Gröna rader indikerar nya positioner. Röda rader indikerar stängda positioner. Klicka på länk symbolen för att se hela transaktionshistoriken.
Uppgradera
för att låsa upp premiumdata och exportera till Excel ![]() .
.
| Fil Datum | Källa | Investerare | Typ | Genomsnittligt pris (beräknat) |
Aktier | Δ Aktier (%) |
Rapporterat värde (1000 USD) |
Δ Värde (%) |
Portföljallokering (%) |
|
|---|---|---|---|---|---|---|---|---|---|---|
| 2025-07-30 | 13F | Caliber Wealth Management, LLC / KS | 48 066 | −4,80 | 1 300 | −6,28 | ||||
| 2025-04-29 | 13F | Resources Investment Advisors, LLC. | 0 | −100,00 | 0 | |||||
| 2025-07-21 | 13F | Ameritas Advisory Services, LLC | 8 516 | −28,84 | 230 | −29,45 | ||||
| 2025-05-13 | 13F | Bokf, Na | 0 | −100,00 | 0 | −100,00 | ||||
| 2025-08-14 | 13F | GWM Advisors LLC | 6 | −14,29 | 0 | |||||
| 2025-08-14 | 13F | Full Sail Capital, LLC | 45 111 | −4,41 | 1 220 | −5,94 | ||||
| 2025-08-01 | 13F | Envestnet Asset Management Inc | 532 562 | −39,99 | 14 400 | −40,93 | ||||
| 2025-08-14 | 13F | Clarity Asset Management, Inc. | 15 695 | −1,70 | 424 | −3,20 | ||||
| 2025-07-30 | 13F | Citizens & Northern Corp | 820 011 | 3,75 | 22 173 | 2,13 | ||||
| 2025-04-21 | 13F | Kingswood Wealth Advisors, Llc | 0 | −100,00 | 0 | |||||
| 2025-08-15 | 13F | Kestra Advisory Services, LLC | 53 047 | 15,79 | 1 434 | 13,99 | ||||
| 2025-08-07 | 13F | Nwam Llc | 64 360 | −4,82 | 1 767 | −4,90 | ||||
| 2025-08-08 | 13F | Capital Investment Advisory Services, LLC | 6 610 | −5,83 | 179 | −7,29 | ||||
| 2025-08-12 | 13F | Global Retirement Partners, LLC | 15 464 | −18,37 | 418 | −18,20 | ||||
| 2025-08-14 | 13F | Essential Planning, LLC. | 131 503 | 1,69 | 3 556 | 0,08 | ||||
| 2025-08-14 | 13F | Bnp Paribas Arbitrage, Sa | 4 | 0 | ||||||
| 2025-08-05 | 13F | Tufton Capital Management | 8 838 | 0,00 | 0 | −100,00 | ||||
| 2025-08-14 | 13F | Fmr Llc | 5 886 | 6,23 | 159 | 4,61 | ||||
| 2025-08-15 | 13F | Provenance Wealth Advisors, LLC | 15 | 0,00 | 0 | |||||
| 2025-07-14 | 13F | Ridgewood Investments LLC | 250 | −6,37 | 7 | −14,29 | ||||
| 2025-07-08 | 13F | 21 West Wealth Management LLC | 39 972 | 1 081 | ||||||
| 2025-07-07 | 13F | Investors Research Corp | 176 | 0,00 | 5 | 0,00 | ||||
| 2025-08-12 | 13F | Atlas Capital Advisors Llc | 8 039 | −53,69 | 217 | −54,41 | ||||
| 2025-08-14 | 13F | Stifel Financial Corp | 64 875 | −1,37 | 1 754 | −2,88 | ||||
| 2025-08-12 | 13F | Kohmann Bosshard Financial Services, LLC | 11 131 | 0,00 | 301 | −1,64 | ||||
| 2025-05-02 | 13F | DecisionPoint Financial, LLC | 0 | −100,00 | 0 | −100,00 | ||||
| 2025-07-15 | 13F | Fifth Third Bancorp | 597 | 0,00 | 16 | 0,00 | ||||
| 2025-07-24 | 13F | Galvin, Gaustad & Stein, LLC | 7 744 | 209 | ||||||
| 2025-08-13 | 13F | Quadrature Capital Ltd | 0 | −100,00 | 0 | |||||
| 2025-09-04 | 13F/A | Advisor Group Holdings, Inc. | 208 107 | −3,51 | 5 630 | −5,01 | ||||
| 2025-08-12 | 13F | Rather & Kittrell, Inc. | 32 300 | −0,78 | 873 | −2,35 | ||||
| 2025-07-31 | 13F | Sage Mountain Advisors LLC | 0 | −100,00 | 0 | |||||
| 2025-08-15 | 13F | Truefg, Llc | 603 416 | 2,78 | 16 316 | 1,17 | ||||
| 2025-08-06 | 13F | Soltis Investment Advisors LLC | 57 609 | 0,02 | 1 558 | −1,58 | ||||
| 2025-08-14 | 13F | Staley Capital Advisers Inc | 9 389 | 254 | ||||||
| 2025-07-24 | 13F | Robertson Stephens Wealth Management, LLC | 9 440 | 0,00 | 255 | −1,54 | ||||
| 2025-08-08 | 13F | Pnc Financial Services Group, Inc. | 1 122 803 | −7,61 | 30 361 | −9,06 | ||||
| 2025-08-12 | 13F | Jpmorgan Chase & Co | 56 975 | 33,62 | 1 541 | 31,51 | ||||
| 2025-05-05 | 13F | PCA Investment Advisory Services Inc. | 0 | −100,00 | 0 | |||||
| 2025-07-25 | 13F | Lodestar Private Asset Management Llc | 71 751 | 3,54 | 1 940 | 1,94 | ||||
| 2025-08-12 | 13F | Steward Partners Investment Advisory, Llc | 105 892 | 13 304,05 | 2 863 | 13 533,33 | ||||
| 2025-04-24 | 13F | HighMark Wealth Management LLC | 0 | −100,00 | 0 | |||||
| 2025-08-04 | 13F | Atria Investments Llc | 39 891 | −6,37 | 1 079 | −7,86 | ||||
| 2025-07-30 | 13F | Financial Perspectives, Inc | 3 073 | 0,99 | 83 | 0,00 | ||||
| 2025-07-30 | 13F | Brookstone Capital Management | 13 660 | −5,08 | 369 | −6,58 | ||||
| 2025-08-06 | 13F | Modera Wealth Management, LLC | 11 267 | 0,00 | 305 | −1,62 | ||||
| 2025-08-14 | 13F | Transamerica Financial Advisors, Inc. | 4 | 0,00 | 0 | |||||
| 2025-07-31 | 13F | Cambridge Investment Research Advisors, Inc. | 74 608 | 1,02 | 2 | 0,00 | ||||
| 2025-08-14 | 13F | Jane Street Group, Llc | 15 874 | 429 | ||||||
| 2025-08-14 | 13F | EP Wealth Advisors, Inc. | 15 066 | −3,13 | 407 | −4,68 | ||||
| 2025-08-13 | 13F | KDK Private Wealth Management, LLC | 9 343 | −4,18 | 253 | −5,62 | ||||
| 2025-08-01 | 13F | Penobscot Wealth Management | 13 146 | 2,18 | 355 | 0,57 | ||||
| 2025-08-14 | 13F | Raymond James Financial Inc | 112 015 | −2,43 | 3 029 | −3,96 | ||||
| 2025-07-08 | 13F | Rise Advisors, LLC | 198 | 1,02 | 5 | 0,00 | ||||
| 2025-08-12 | 13F | Palisades Hudson Asset Management, L.P. | 61 141 | 1,29 | 2 | 0,00 | ||||
| 2025-08-08 | 13F | Cetera Investment Advisers | 42 412 | −77,93 | 1 147 | −78,29 | ||||
| 2025-07-11 | 13F | Eagle Bay Advisors LLC | 54 633 | −3,67 | 1 477 | −5,14 | ||||
| 2025-04-21 | 13F | Nelson, Van Denburg & Campbell Wealth Management Group, LLC | 0 | −100,00 | 0 | |||||
| 2025-08-08 | 13F | Larson Financial Group LLC | 14 439 | 41,05 | 390 | 38,79 | ||||
| 2025-04-29 | 13F | Lee Danner & Bass Inc | 0 | −100,00 | 0 | |||||
| 2025-08-06 | 13F | Agf Management Ltd | 303 151 | 1,50 | 8 197 | −0,09 | ||||
| 2025-08-13 | 13F | GeoWealth Management, LLC | 294 | 8 | ||||||
| 2025-08-13 | 13F | Smith, Moore & Co. | 36 797 | 0,00 | 995 | −1,58 | ||||
| 2025-07-22 | 13F | Apexium Financial, Lp | 9 757 | −1,38 | 264 | −2,95 | ||||
| 2025-08-21 | 13F | Pathway Financial Advisers, LLC | 8 924 | −2,51 | 241 | −3,98 | ||||
| 2025-08-12 | 13F | Armor Investment Advisors, LLC | 3 | −84,21 | 0 | |||||
| 2025-08-12 | 13F | O'shaughnessy Asset Management, Llc | 981 | −28,34 | 27 | −29,73 | ||||
| 2025-08-05 | 13F | Beckerman Institutional, LLC | 49 792 | 42,78 | 1 | |||||
| 2025-03-21 | 13F | Prostatis Group LLC | 0 | −100,00 | 0 | |||||
| 2025-08-14 | 13F | Glenmede Investment Management, LP | 2 460 | 67 | ||||||
| 2025-05-02 | 13F | Capital A Wealth Management, LLC | 103 | 415,00 | 3 | |||||
| 2025-08-14 | 13F | Harwood Advisory Group, LLC | 0 | −100,00 | 0 | −100,00 | ||||
| 2025-07-17 | 13F | Raleigh Capital Management Inc. | 4 | 100,00 | 0 | |||||
| 2025-08-08 | 13F | Tortoise Investment Management, LLC | 51 254 | −1,35 | 1 386 | −2,94 | ||||
| 2025-08-13 | 13F | Jones Financial Companies Lllp | 2 776 | 116,54 | 75 | 117,65 | ||||
| 2025-08-15 | 13F | Tower Research Capital LLC (TRC) | 29 797 | 806 | ||||||
| 2025-04-09 | 13F | Roxbury Financial LLC | 0 | −100,00 | 0 | |||||
| 2025-08-07 | 13F | Allworth Financial LP | 1 086 | 0,00 | 29 | 3,57 | ||||
| 2025-08-13 | 13F | Balanced Wealth Group Llc | 26 533 | 0,65 | 718 | −0,97 | ||||
| 2025-08-12 | 13F | Proequities, Inc. | 0 | 0 | ||||||
| 2025-07-29 | 13F | Foster & Motley Inc | 9 893 | 11,55 | 0 | |||||
| 2025-08-05 | 13F | Sigma Planning Corp | 10 337 | −5,59 | 280 | −7,00 | ||||
| 2025-08-14 | 13F | NorthLanding Financial Partners, LLC | 9 726 | −0,39 | 263 | −1,87 | ||||
| 2025-08-01 | 13F | Brookwood Investment Group LLC | 0 | −100,00 | 0 | |||||
| 2025-08-13 | 13F | Summit Wealth Group Llc / Co | 45 363 | 1 227 | ||||||
| 2025-08-14 | 13F | Susquehanna International Group, Llp | 50 346 | 1 361 | ||||||
| 2025-08-14 | 13F | UBS Group AG | 98 292 | −23,38 | 2 658 | −24,60 | ||||
| 2025-08-05 | 13F | Blue Barn Wealth, LLC | 120 775 | 3,16 | 3 266 | 1,56 | ||||
| 2025-08-12 | 13F | AlphaCore Capital LLC | 30 | 1 | ||||||
| 2025-08-15 | 13F | Koesten, Hirschmann & Crabtree, INC. | 468 | 60,82 | 13 | 71,43 | ||||
| 2025-07-18 | 13F | Pure Financial Advisors, Inc. | 410 078 | −1,52 | 11 088 | −3,06 | ||||
| 2025-07-21 | 13F | Quent Capital, LLC | 0 | −100,00 | 0 | |||||
| 2025-08-13 | 13F | Colonial Trust Co / SC | 7 694 | −24,89 | 208 | −25,98 | ||||
| 2025-07-30 | 13F | Black Diamond Financial, LLC | 566 976 | 0,14 | 15 331 | −1,43 | ||||
| 2025-08-14 | 13F | Wells Fargo & Company/mn | 25 818 | 53,44 | 698 | 51,08 | ||||
| 2025-05-15 | 13F | Qube Research & Technologies Ltd | 0 | −100,00 | 0 | |||||
| 2025-08-05 | 13F | Key FInancial Inc | 54 | 0,00 | 1 | 0,00 | ||||
| 2025-07-24 | 13F | IFP Advisors, Inc | 25 665 | 0,51 | 694 | −1,14 | ||||
| 2025-07-25 | 13F | Concord Wealth Partners | 854 | 0,95 | 23 | 0,00 | ||||
| 2025-08-05 | 13F | Snider Financial Group | 16 519 | 2,69 | 447 | 1,13 | ||||
| 2025-08-19 | 13F | Advisory Services Network, LLC | 21 253 | −86,27 | 575 | −86,48 | ||||
| 2025-05-16 | 13F/A | Kestra Investment Management, LLC | 0 | −100,00 | 0 | |||||
| 2025-08-14 | 13F | Diversify Wealth Management, Llc | 150 809 | 2,25 | 4 073 | 3,59 | ||||
| 2025-08-14 | 13F | Kovitz Investment Group Partners, LLC | 102 291 | 2 766 | ||||||
| 2025-08-14 | 13F | Talon Private Wealth, LLC | 8 208 | −4,54 | 222 | −6,36 | ||||
| 2025-08-13 | 13F | Capital Analysts, Inc. | 0 | −100,00 | 0 | |||||
| 2025-08-14 | 13F | Citadel Advisors Llc | 33 087 | 166,74 | 895 | 162,94 | ||||
| 2025-07-21 | 13F | Life Planning Partners, Inc | 42 277 | −1,39 | 1 143 | −2,89 | ||||
| 2025-07-24 | 13F | Thompson Investment Management, Inc. | 8 846 | 0,43 | 239 | −0,83 | ||||
| 2025-07-30 | 13F | Demars Financial Group, LLC | 9 942 | −96,98 | 269 | 2 336,36 | ||||
| 2025-07-23 | 13F | Independent Solutions Wealth Management, LLC | 115 511 | 0,74 | 3 123 | −0,83 | ||||
| 2025-08-14 | 13F | Sunbelt Securities, Inc. | 13 194 | −28,83 | 357 | −30,06 | ||||
| 2025-07-28 | 13F | BRYN MAWR TRUST Co | 8 016 | 0,00 | 217 | −1,82 | ||||
| 2025-08-07 | 13F | Prospect Financial Group LLC | 102 140 | −0,38 | 2 762 | −1,95 | ||||
| 2025-07-09 | 13F | Tounjian Advisory Partners, Llc | 11 986 | −2,96 | 329 | −2,95 | ||||
| 2025-07-25 | 13F | Atria Wealth Solutions, Inc. | 55 917 | 13,24 | 1 518 | 11,87 | ||||
| 2025-06-30 | NP | Northern Lights Fund Trust - PFG Fidelity Institutional AM® Equity Sector Strategy Fund Class R Shares | 1 272 267 | 304,89 | 34 071 | 351,63 | ||||
| 2025-07-31 | 13F | Opes Wealth Management LLC | 120 698 | 2,41 | 3 264 | 0,80 | ||||
| 2025-08-07 | 13F | PFG Advisors | 0 | −100,00 | 0 | |||||
| 2025-08-11 | 13F | Aptus Capital Advisors, LLC | 1 | 0,00 | 0 | |||||
| 2025-08-14 | 13F | Mml Investors Services, Llc | 184 060 | 11,21 | 5 | 0,00 | ||||
| 2025-07-24 | 13F | Blair William & Co/il | 3 256 | −2,95 | 88 | −4,35 | ||||
| 2025-08-05 | 13F | Mission Wealth Management, Lp | 14 664 | −3,19 | 397 | −4,81 | ||||
| 2025-07-28 | 13F | Harbour Investments, Inc. | 93 | 1,09 | 3 | 0,00 | ||||
| 2025-08-08 | 13F | Avantax Advisory Services, Inc. | 404 892 | −2,17 | 10 948 | −3,70 | ||||
| 2025-08-12 | 13F | Soundwatch Capital LLC | 4 850 | 2 236 | ||||||
| 2025-07-18 | 13F | PBMares Wealth Management LLC | 8 713 | 236 | ||||||
| 2025-08-14 | 13F | SWAN Capital LLC | 0 | −100,00 | 0 | |||||
| 2025-08-14 | 13F | Fort Point Capital Partners LLC | 31 505 | −63,42 | 852 | −64,02 | ||||
| 2025-07-22 | 13F | Merit Financial Group, LLC | 7 562 | −1,20 | 204 | −2,86 | ||||
| 2025-08-08 | 13F | Hartland & Co., LLC | 302 | 0,00 | 8 | 0,00 | ||||
| 2025-08-04 | 13F | Spire Wealth Management | 0 | −100,00 | 0 | |||||
| 2025-08-05 | 13F | Bank of New York Mellon Corp | 10 508 | −79,66 | 284 | −79,99 | ||||
| 2025-08-13 | 13F | Colonial Trust Advisors | 6 016 | 3,33 | 163 | 1,89 | ||||
| 2025-07-15 | 13F | Lynch & Associates/in | 11 972 | −1,44 | 324 | −3,00 | ||||
| 2025-07-11 | 13F | Farther Finance Advisors, LLC | 41 427 | 2,92 | 1 120 | 1,27 | ||||
| 2025-08-12 | 13F | SRS Capital Advisors, Inc. | 72 | 2 | ||||||
| 2025-08-01 | 13F | Vision Financial Markets Llc | 212 | 0,95 | 6 | 0,00 | ||||
| 2025-07-23 | 13F | Heck Capital Advisors, LLC | 233 877 | 11,87 | 6 324 | 10,12 | ||||
| 2025-05-05 | 13F | Kestra Private Wealth Services, Llc | 0 | −100,00 | 0 | |||||
| 2025-04-23 | 13F | PMV Capital Advisers, LLC | 0 | −100,00 | 0 | |||||
| 2025-08-14 | 13F | Smartleaf Asset Management LLC | 4 202 | −13,36 | 113 | −14,50 | ||||
| 2025-08-18 | 13F/A | National Bank Of Canada /fi/ | 1 795 | 0,00 | 49 | −2,04 | ||||
| 2025-08-12 | 13F | Asset Management Group, Inc. | 64 620 | −0,88 | 1 747 | −2,40 | ||||
| 2025-08-14 | 13F | Bank Of America Corp /de/ | 41 932 | 48,34 | 1 134 | 46,01 | ||||
| 2025-08-11 | 13F | HighTower Advisors, LLC | 145 296 | 0,59 | 3 929 | −0,98 | ||||
| 2025-08-12 | 13F | MAI Capital Management | 380 222 | 12,69 | 10 281 | 10,93 | ||||
| 2025-08-15 | 13F | Morgan Stanley | 153 683 | −2,74 | 4 156 | −4,26 | ||||
| 2025-07-24 | 13F | Us Bancorp \de\ | 4 200 | 0,00 | 114 | −1,74 | ||||
| 2025-08-14 | 13F | Financial Engines Advisors L.L.C. | 122 161 | −5,89 | 3 303 | −7,38 | ||||
| 2025-08-12 | 13F | J.w. Cole Advisors, Inc. | 38 682 | 21,46 | 1 046 | 19,57 | ||||
| 2025-08-12 | 13F | Franklin Resources Inc | 0 | −100,00 | 0 | |||||
| 2025-08-25 | 13F/A | Promus Capital, LLC | 150 | 0,00 | 4 | 0,00 | ||||
| 2025-05-02 | 13F | MB Generational Wealth, LLC | 7 396 | 203 | ||||||
| 2025-08-07 | 13F | BOK Financial Private Wealth, Inc. | 1 664 | 0,00 | 45 | −2,22 | ||||
| 2025-07-10 | 13F | HF Advisory Group, LLC | 43 202 | −3,64 | 1 168 | −5,12 | ||||
| 2025-08-14 | 13F | Modern Wealth Management, LLC | 23 578 | 9,13 | 638 | 7,42 | ||||
| 2025-08-08 | 13F | Independence Financial Advisors, LLC | 11 336 | 0,04 | 307 | −1,61 | ||||
| 2025-08-15 | 13F | Keel Point, LLC | 14 431 | −15,62 | 390 | −16,84 | ||||
| 2025-08-14 | 13F | Glen Eagle Advisors, LLC | 347 | 0,00 | 9 | 0,00 | ||||
| 2025-08-04 | 13F | Assetmark, Inc | 146 | 4 | ||||||
| 2025-08-06 | 13F | Decker Retirement Planning Inc. | 638 | 0,00 | 17 | 0,00 | ||||
| 2025-08-06 | 13F | Aspect Partners, LLC | 4 201 | 0,00 | 114 | −1,74 | ||||
| 2025-07-08 | 13F | First National Corp /ma/ /adv | 61 836 | −0,73 | 1 672 | −2,28 | ||||
| 2025-07-23 | 13F | Sachetta, LLC | 68 662 | 0,05 | 1 857 | −1,54 | ||||
| 2025-07-30 | 13F | Rehmann Capital Advisory Group | 198 454 | 1,56 | 5 366 | −0,02 | ||||
| 2025-08-04 | 13F | Roble, Belko & Company, Inc | 26 | 0,00 | 0 | |||||
| 2025-07-24 | 13F | Ronald Blue Trust, Inc. | 8 666 | −33,43 | 234 | −34,45 | ||||
| 2025-08-12 | 13F | PKS Advisory Services, LLC | 34 687 | −0,34 | 938 | −1,99 | ||||
| 2025-07-31 | 13F | Forte Asset Management Llc | 0 | −100,00 | 0 | |||||
| 2025-08-14 | 13F | Integrated Investment Consultants, LLC | 31 000 | 0,00 | 838 | −1,53 | ||||
| 2025-08-15 | 13F | CI Private Wealth, LLC | 9 551 | 258 | ||||||
| 2025-08-14 | 13F | Ancora Advisors, LLC | 5 597 | 0,00 | 151 | −1,31 | ||||
| 2025-07-15 | 13F | BCS Wealth Management | 7 578 | −39,83 | 0 | |||||
| 2025-08-07 | 13F | Addison Advisors LLC | 281 | 0,00 | 8 | 0,00 | ||||
| 2025-07-31 | 13F | Briaud Financial Planning, Inc | 439 | 0 | ||||||
| 2025-08-14 | 13F | Ausdal Financial Partners, Inc. | 14 385 | −11,61 | 389 | −13,20 | ||||
| 2025-08-13 | 13F | Johnson Financial Group, Inc. | 600 | 0,00 | 16 | 0,00 | ||||
| 2025-08-14 | 13F | Investmark Advisory Group LLC | 19 127 | −0,86 | 517 | −2,27 | ||||
| 2025-08-13 | 13F | Northwestern Mutual Wealth Management Co | 416 893 | 1,42 | 11 273 | −0,18 | ||||
| 2025-08-01 | 13F | Brinker Capital Investments, LLC | 0 | −100,00 | 0 | |||||
| 2025-08-01 | 13F | American Financial & Tax Strategies Inc | 189 228 | 1,53 | 5 117 | −0,06 | ||||
| 2025-08-06 | 13F | Atlantic Union Bankshares Corp | 1 000 | 27 | ||||||
| 2025-05-14 | 13F | CIBC Private Wealth Group, LLC | 0 | −100,00 | 0 | |||||
| 2025-07-07 | 13F | Versant Capital Management, Inc | 500 | 0,00 | 14 | 0,00 | ||||
| 2025-07-18 | 13F | SOA Wealth Advisors, LLC. | 50 | 19,05 | 1 | 0,00 | ||||
| 2025-07-30 | 13F | Crewe Advisors LLC | 550 | −4,51 | 15 | −6,67 | ||||
| 2025-05-12 | 13F | Sandy Spring Bank | 1 000 | 0,00 | 27 | 0,00 | ||||
| 2025-08-05 | 13F | Huntington National Bank | 9 | 0,00 | ||||||
| 2025-08-14 | 13F | Comerica Bank | 1 139 | 0,00 | 31 | −3,23 | ||||
| 2025-07-25 | 13F | Cwm, Llc | 9 844 | 21,07 | 0 | |||||
| 2025-08-13 | 13F | Lido Advisors, LLC | 1 221 408 | 5,90 | 33 027 | 4,25 | ||||
| 2025-07-14 | 13F | Park Avenue Securities Llc | 8 129 | −78,43 | 0 | −100,00 | ||||
| 2025-08-07 | 13F | Birchcreek Wealth Management, LLC | 44 311 | 7,56 | 1 198 | 5,92 | ||||
| 2025-08-14 | 13F | Royal Bank Of Canada | 95 170 | 14,80 | 2 573 | 13,00 | ||||
| 2025-07-22 | 13F | Marks Group Wealth Management, Inc | 61 478 | 0,00 | 1 662 | −1,54 | ||||
| 2025-08-14 | 13F | Mariner, LLC | 43 183 | −2,12 | 1 168 | −3,63 | ||||
| 2025-07-30 | 13F | Princeton Global Asset Management LLC | 70 | −52,05 | 2 | −75,00 | ||||
| 2025-08-04 | 13F | Creative Financial Designs Inc /adv | 994 | 0,00 | 27 | −3,70 | ||||
| 2025-08-08 | 13F | Creative Planning | 229 082 | −8,03 | 6 194 | −9,46 | ||||
| 2025-08-06 | 13F | Stone House Investment Management, LLC | 1 680 | −72,76 | 45 | −73,37 | ||||
| 2025-07-28 | 13F | Rik Saylor Financial, Inc. | 15 389 | −3,15 | 416 | −4,59 | ||||
| 2025-08-11 | 13F | Brown Brothers Harriman & Co | 2 384 | 0,00 | 64 | −1,54 | ||||
| 2025-07-23 | 13F | Venturi Wealth Management, LLC | 13 066 | −4,18 | 353 | −5,61 | ||||
| 2025-08-08 | 13F | Glassman Wealth Services | 114 | 0,88 | 3 | 0,00 | ||||
| 2025-07-17 | 13F | Sound Income Strategies, LLC | 53 | 0,00 | 1 | 0,00 | ||||
| 2025-07-14 | 13F | AdvisorNet Financial, Inc | 1 264 | −11,98 | 34 | −12,82 | ||||
| 2025-07-31 | 13F | CNB Bank | 330 | 0,00 | 9 | −11,11 | ||||
| 2025-08-13 | 13F | Congress Wealth Management LLC / DE / | 72 388 | 19,94 | 1 957 | 18,11 | ||||
| 2025-07-15 | 13F | Fortitude Family Office, LLC | 0 | −100,00 | 0 | |||||
| 2025-07-02 | 13F | Marotta Asset Management | 167 493 | 18,38 | 4 529 | 8,61 | ||||
| 2025-08-14 | 13F | Aqr Capital Management Llc | 7 684 | 0,00 | 208 | −1,90 | ||||
| 2025-07-18 | 13F | SigFig Wealth Management, LLC | 105 737 | −2,87 | 2 842 | −4,02 | ||||
| 2025-07-15 | 13F | Elevated Capital Advisors, LLC | 23 249 | 0,00 | 639 | 0,00 | ||||
| 2025-07-28 | 13F | RFG Advisory, LLC | 137 030 | 0,96 | 3 705 | −0,62 | ||||
| 2025-08-13 | 13F | Summit Financial, LLC | 8 044 | 218 | ||||||
| 2025-07-17 | 13F | Smith, Salley & Associates | 16 633 | 0,39 | 450 | −1,32 | ||||
| 2025-05-13 | 13F | Prime Capital Investment Advisors, LLC | 0 | −100,00 | 0 | |||||
| 2025-08-14 | 13F | Diversify Advisory Services, LLC | 50 011 | 26,81 | 1 351 | 28,45 | ||||
| 2025-07-09 | 13F | Dynamic Advisor Solutions LLC | 240 990 | 2,73 | 6 516 | 1,12 | ||||
| 2025-07-31 | 13F | Schoolcraft Capital LLC | 91 428 | −20,15 | 2 472 | −21,40 | ||||
| 2025-07-30 | 13F | Fingerlakes Wealth Management, Inc. | 16 972 | 11,65 | 459 | 9,83 | ||||
| 2025-08-13 | 13F | Russell Investments Group, Ltd. | 17 | 0 | ||||||
| 2025-08-12 | 13F | Coston, McIsaac & Partners | 413 | 0,98 | 0 | |||||
| 2025-07-16 | 13F/A | CX Institutional | 406 | −7,73 | 0 | |||||
| 2025-07-30 | 13F | Cullen/frost Bankers, Inc. | 593 | −74,27 | 16 | −74,60 | ||||
| 2025-07-24 | 13F | Grand Wealth Management, Llc | 7 731 | 209 | ||||||
| 2025-07-16 | 13F | Beaumont Financial Advisors, LLC | 63 141 | 2,79 | 1 707 | 1,19 | ||||
| 2025-08-12 | 13F | Marshall & Sterling Wealth Advisors Inc. | 100 | 1,01 | 3 | 0,00 | ||||
| 2025-08-12 | 13F | LPL Financial LLC | 387 771 | 8,48 | 10 485 | 6,78 | ||||
| 2025-07-25 | 13F | Riverpoint Wealth Management Holdings, LLC | 467 376 | 3,85 | 12 638 | 2,22 | ||||
| 2025-08-14 | 13F | Snowden Capital Advisors LLC | 0 | −100,00 | 0 | −100,00 | ||||
| 2025-08-11 | 13F | Principal Securities, Inc. | 6 791 | 9,41 | 184 | 9,58 | ||||
| 2025-08-06 | 13F | AE Wealth Management LLC | 1 037 875 | 1,15 | 28 064 | −0,43 | ||||
| 2025-07-14 | 13F | UMA Financial Services, Inc. | 175 488 | −4,69 | 4 745 | −6,19 | ||||
| 2025-07-29 | 13F | Disciplined Investments, LLC | 10 399 | 0,00 | 281 | −1,40 | ||||
| 2025-07-31 | 13F | Glass Jacobson Investment Advisors llc | 38 756 | 2,38 | 1 048 | 2,45 | ||||
| 2025-08-11 | 13F | Citigroup Inc | 16 969 | −3,26 | 459 | −4,78 | ||||
| 2025-08-06 | 13F | Commonwealth Equity Services, Llc | 515 523 | −11,07 | 14 | −13,33 | ||||
| 2025-08-13 | 13F | Northern Trust Corp | 15 703 | −30,23 | 425 | −31,39 | ||||
| 2025-08-14 | 13F | Ameriprise Financial Inc | 59 639 | 15,05 | 1 550 | 8,85 | ||||
| 2025-08-14 | 13F | Colony Group, LLC | 8 033 | −27,08 | 217 | −28,15 |