Grundläggande statistik
| Institutionella ägare | 145 total, 145 long only, 0 short only, 0 long/short - change of 8,96% MRQ |
| Genomsnittlig portföljallokering | 0.4160 % - change of −6,93% MRQ |
| Institutionella aktier (lång) | 23 930 386 (ex 13D/G) - change of 3,25MM shares 15,74% MRQ |
| Institutionellt värde (lång) | $ 876 861 USD ($1000) |
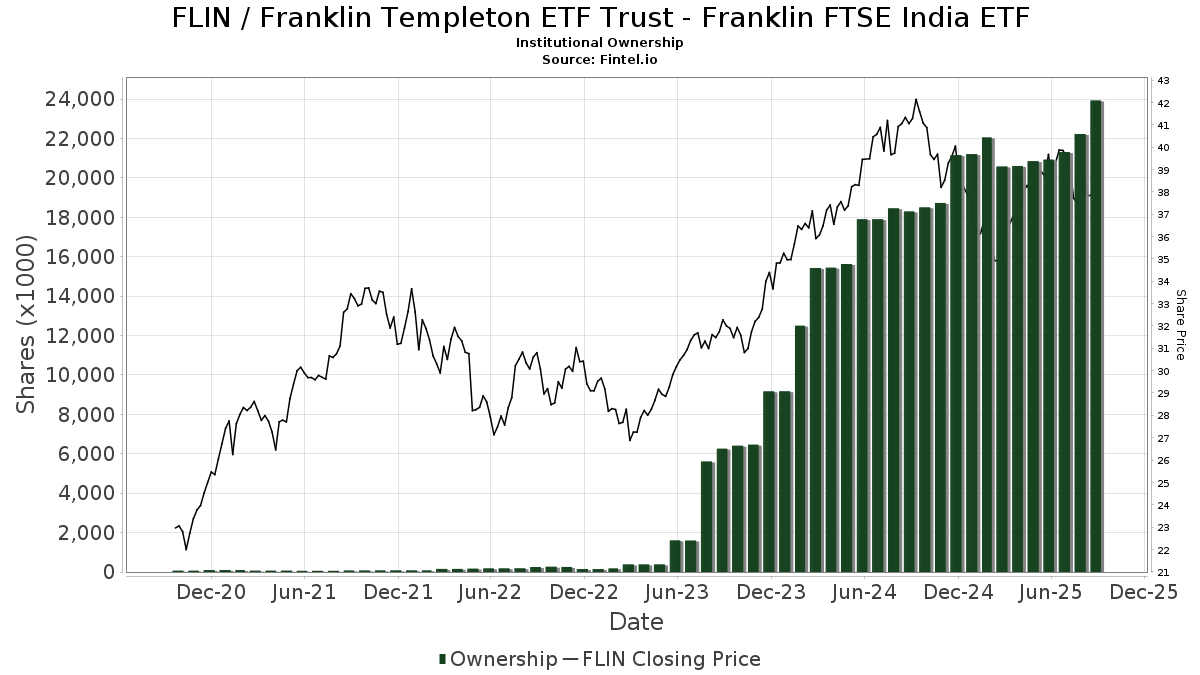
Institutionellt ägande och aktieägare
Franklin Templeton ETF Trust - Franklin FTSE India ETF (US:FLIN) har 145 Institutionella ägare och aktieägare som har lämnat in 13D/G- eller 13F-formulär till Securities Exchange Commission (SEC). Dessa institut innehar totalt 23,930,386 aktier. Största aktieägare inkluderar Menora Mivtachim Holdings Ltd., Migdal Insurance & Financial Holdings Ltd., Morgan Stanley, Investment Management Corp of Ontario, Agf Management Ltd, Principal Financial Group Inc, Old National Bancorp /in/, New York Life Investment Management Llc, QAI - IQ Hedge Multi-Strategy Tracker ETF, and Old Second National Bank Of Aurora .
Franklin Templeton ETF Trust - Franklin FTSE India ETF (ARCA:FLIN) Institutionell ägarstruktur visar institutioners och fonders nuvarande positioner i företaget, samt de senaste förändringarna i positionernas storlek. Större aktieägare kan vara enskilda investerare, fonder, hedgefonder eller institutioner. Bilaga 13D visar att investeraren äger (eller ägde) mer än 5% av företaget och avser (eller avsåg) att aktivt eftersträva en förändring av affärsstrategin. Schedule 13G indikerar en passiv investering på över 5%.
The share price as of September 15, 2025 is 38,35 / share. Previously, on September 16, 2024, the share price was 41,67 / share. This represents a decline of 7,97% over that period.
Fondsentimentets poäng
Fondsentimentet poängen(fka Ägarackumulation-poäng) visar vilka aktier som är mest köpta av fonder. Det är resultatet av en sofistikerad kvantitativ flerfaktormodell som identifierar företag med de högsta nivåerna av institutionell ackumulering. Poängsättningsmodellen använder en kombination av den totala ökningen av redovisade ägare, förändringarna i portföljallokeringarna för dessa ägare och andra mått. Siffran sträcker sig från 0 till 100, där högre siffror indikerar en högre nivå av ackumulering i förhållande till sina konkurrenter, och 50 är genomsnittet.
Uppdateringsfrekvens: Dagligen
Se Ownership Explorer, som innehåller en lista över de högst rankade företagen.
Institutionell sälj/köp-kvot
Förutom att rapportera vanliga eget kapital- och skuldemissioner måste institutioner med mer än 100MM tillgångar under förvaltning också avslöja sina innehav av sälj- och köpoptioner. Eftersom säljoptioner i allmänhet indikerar ett negativt sentiment och köpoptioner indikerar ett positivt sentiment, kan vi få en uppfattning om det övergripande institutionella sentimentet genom att plotta förhållandet mellan säljoptioner och köpoptioner. Diagrammet till höger visar det historiska förhållandet mellan sälj- och köpoptioner för detta instrument.
Genom att använda sälj/köp-kvoten som en indikator på aktieägarnas sentiment undviker man en av de största bristerna med att använda det totala institutionella ägandet, nämligen att en betydande del av de förvaltade tillgångarna investeras passivt för att följa index. Passivt förvaltade fonder köper vanligtvis inte optioner, så indikatorn för sälj/köp-kvoten ger en bättre bild av stämningen i aktivt förvaltade fonder.
13F- och NPORT-arkiveringar
Detaljer om 13F-arkiveringar är gratis. Detaljer om NP-arkiveringar kräver ett premiummedlemskap. Gröna rader indikerar nya positioner. Röda rader indikerar stängda positioner. Klicka på länk symbolen för att se hela transaktionshistoriken.
Uppgradera
för att låsa upp premiumdata och exportera till Excel ![]() .
.
| Fil Datum | Källa | Investerare | Typ | Genomsnittligt pris (beräknat) |
Aktier | Δ Aktier (%) |
Rapporterat värde (1000 USD) |
Δ Värde (%) |
Portföljallokering (%) |
|
|---|---|---|---|---|---|---|---|---|---|---|
| 2025-08-14 | 13F | Mml Investors Services, Llc | 33 072 | −4,83 | 1 | 0,00 | ||||
| 2025-07-29 | 13F | Yoffe Investment Management, LLC | 8 764 | 0,00 | 349 | 8,39 | ||||
| 2025-04-23 | 13F | Perigon Wealth Management, LLC | 0 | −100,00 | 0 | |||||
| 2025-07-30 | 13F | Bogart Wealth, LLC | 886 | 0,00 | 35 | 9,38 | ||||
| 2025-07-17 | 13F | Oak Family Advisors, Llc | 24 035 | −37,88 | 957 | −32,84 | ||||
| 2025-07-30 | 13F | Loring Wolcott & Coolidge Fiduciary Advisors Llp/ma | 10 975 | 437 | ||||||
| 2025-07-24 | 13F | Us Bancorp \de\ | 8 564 | 14,51 | 341 | 24,00 | ||||
| 2025-05-14 | 13F | Huntington National Bank | 17 | −93,70 | ||||||
| 2025-07-08 | 13F | Juncture Wealth Strategies, Llc | 67 640 | 67,77 | 2 694 | 81,41 | ||||
| 2025-07-24 | 13F | IFP Advisors, Inc | 23 282 | 6,95 | 927 | 15,73 | ||||
| 2025-08-14 | 13F | Bank Of America Corp /de/ | 284 146 | 114,97 | 11 318 | 132,43 | ||||
| 2025-08-08 | 13F | Advisors Capital Management, LLC | 50 176 | 35,87 | 1 999 | 46,91 | ||||
| 2025-08-29 | NP | GDMA - Gadsden Dynamic Multi-Asset ETF | 187 808 | 28,46 | 7 480 | 38,88 | ||||
| 2025-05-14 | 13F | Toroso Investments, LLC | 0 | −100,00 | 0 | |||||
| 2025-08-14 | 13F | Fmr Llc | 509 | 20 | ||||||
| 2025-08-12 | 13F | LPL Financial LLC | 170 826 | 11,72 | 6 804 | 20,79 | ||||
| 2025-08-12 | 13F | Global Retirement Partners, LLC | 1 562 | −16,47 | 62 | −11,43 | ||||
| 2025-06-27 | NP | INTL - Main International ETF | 0 | −100,00 | 0 | −100,00 | ||||
| 2025-08-05 | 13F | Simplex Trading, Llc | 415 | 0 | ||||||
| 2025-08-05 | 13F | Bank Of Montreal /can/ | 107 901 | 211,87 | 4 298 | 237,28 | ||||
| 2025-08-12 | 13F | Boreal Capital Management LLC | 25 | 1 | ||||||
| 2025-07-28 | 13F | Harbour Investments, Inc. | 21 | 0,00 | 1 | |||||
| 2025-08-11 | 13F | HighTower Advisors, LLC | 8 142 | 6,82 | 324 | 15,71 | ||||
| 2025-08-15 | 13F | Montag & Caldwell, Llc | 10 609 | 0,00 | 423 | 8,21 | ||||
| 2025-08-06 | 13F | Commonwealth Equity Services, Llc | 29 088 | −45,24 | 1 | 0,00 | ||||
| 2025-08-12 | 13F | Putnam Fl Investment Management Co | 286 835 | 11 425 | ||||||
| 2025-08-18 | 13F/A | National Bank Of Canada /fi/ | 5 559 | 30,46 | 221 | 41,67 | ||||
| 2025-07-22 | 13F | Old National Bancorp /in/ | 636 044 | 446,95 | 25 334 | 491,34 | ||||
| 2025-08-25 | NP | MAINSTAY VP FUNDS TRUST - MainStay VP IQ Hedge Multi-Strategy Portfolio Initial Class | 110 982 | 4 420 | ||||||
| 2025-08-27 | NP | ACIFX - Advisors Capital International Fund | 18 700 | 171,01 | 745 | 192,91 | ||||
| 2025-08-11 | 13F | Frank, Rimerman Advisors LLC | 5 567 | 0,00 | 222 | 7,80 | ||||
| 2025-08-12 | 13F | Accordant Advisory Group Inc | 72 405 | 2 884 | ||||||
| 2025-08-11 | 13F | Shoker Investment Counsel, Inc. | 0 | −100,00 | 0 | |||||
| 2025-06-25 | NP | QAI - IQ Hedge Multi-Strategy Tracker ETF | 374 332 | 14 329 | ||||||
| 2025-08-14 | 13F | Menora Mivtachim Holdings Ltd. | 9 329 036 | 0,00 | 371 576 | 8,12 | ||||
| 2025-07-18 | 13F | Lynx Investment Advisory | 5 158 | 205 | ||||||
| 2025-08-13 | 13F | Northwestern Mutual Wealth Management Co | 189 225 | 47,09 | 7 537 | 59,02 | ||||
| 2025-08-15 | 13F | Morgan Stanley | 1 675 368 | 35,23 | 66 730 | 46,20 | ||||
| 2025-08-14 | 13F | IHT Wealth Management, LLC | 102 424 | −3,90 | 4 080 | 3,90 | ||||
| 2025-08-05 | 13F | Harel Insurance Investments & Financial Services Ltd. | 5 200 | 44,44 | 0 | |||||
| 2025-07-25 | 13F | Cwm, Llc | 1 457 | 7,21 | 0 | |||||
| 2025-08-12 | 13F | AlphaCore Capital LLC | 13 286 | −7,25 | 529 | 0,38 | ||||
| 2025-08-13 | 13F | Advocacy Wealth Management Services, LLC | 65 965 | −16,64 | 2 627 | −9,88 | ||||
| 2025-08-07 | 13F | Runnymede Capital Advisors, Inc. | 5 621 | 0,00 | 224 | 7,73 | ||||
| 2025-08-14 | 13F | DHK Financial Advisors, Inc. | 45 513 | 0,16 | 1 813 | 8,24 | ||||
| 2025-09-15 | 13F/A | Migdal Insurance & Financial Holdings Ltd. | 1 765 490 | 0,00 | 70 | 7,69 | ||||
| 2025-08-11 | 13F | Citigroup Inc | 28 615 | −8,11 | 1 140 | −0,70 | ||||
| 2025-08-14 | 13F | Bnp Paribas Arbitrage, Sa | 17 860 | 27,53 | 711 | 38,06 | ||||
| 2025-08-14 | 13F | Stifel Financial Corp | 16 366 | −0,40 | 652 | 7,60 | ||||
| 2025-04-01 | 13F | Oliver Lagore Vanvalin Investment Group | 0 | −100,00 | 0 | |||||
| 2025-08-26 | 13F/A | Thrivent Financial For Lutherans | 0 | −100,00 | 0 | |||||
| 2025-08-01 | 13F | New York Life Investment Management Llc | 495 687 | 3 953,37 | 19 743 | 4 287,33 | ||||
| 2025-08-14 | 13F | DZ BANK AG Deutsche Zentral Genossenschafts Bank, Frankfurt am Main | 94 166 | −22,30 | 3 751 | −15,99 | ||||
| 2025-08-13 | 13F | Bare Financial Services, Inc | 1 253 | 314,90 | 50 | 345,45 | ||||
| 2025-08-06 | 13F | Rialto Wealth Management, LLC | 700 | 0,00 | 28 | 8,00 | ||||
| 2025-08-13 | 13F | Avestar Capital, LLC | 32 800 | 1 306 | ||||||
| 2025-08-08 | 13F | Letko, Brosseau & Associates Inc | 20 975 | 30,28 | 835 | 40,81 | ||||
| 2025-05-14 | 13F | Axiom International Investors Llc /de | 0 | −100,00 | 0 | |||||
| 2025-04-23 | 13F | International Assets Investment Management, Llc | 0 | −100,00 | 0 | −100,00 | ||||
| 2025-08-11 | 13F | Empowered Funds, LLC | 188 318 | 28,81 | 7 501 | 39,25 | ||||
| 2025-08-14 | 13F | Wells Fargo & Company/mn | 56 | 9,80 | 2 | 100,00 | ||||
| 2025-03-31 | NP | GIAX - Nicholas Global Equity and Income ETF | 50 504 | 85,50 | 1 847 | 72,68 | ||||
| 2025-08-12 | 13F | Park Square Financial Group, LLC | 623 | −3,26 | 25 | 4,35 | ||||
| 2025-08-13 | 13F | SCS Capital Management LLC | 77 254 | 3 077 | ||||||
| 2025-05-08 | 13F | Pasadena Private Wealth, LLC | 0 | −100,00 | 0 | |||||
| 2025-08-08 | 13F | Creative Planning | 16 914 | −13,08 | 674 | −6,01 | ||||
| 2025-08-12 | 13F | Winnow Wealth Llc | 72 405 | 2 884 | ||||||
| 2025-07-11 | 13F/A | Financiere des Professionnels - Fonds d,investissement inc. | 127 661 | 0,00 | 5 085 | 8,10 | ||||
| 2025-08-14 | 13F | Vident Advisory, LLC | 102 753 | 319,33 | 4 093 | 353,66 | ||||
| 2025-07-18 | 13F | Trust Co Of Vermont | 2 625 | 26,87 | 105 | 36,84 | ||||
| 2025-07-14 | 13F | Painted Porch Advisors LLC | 66 | 0,00 | 3 | 0,00 | ||||
| 2025-07-15 | 13F | Fifth Third Bancorp | 0 | −100,00 | 0 | |||||
| 2025-08-01 | 13F | Envestnet Asset Management Inc | 41 206 | 9,00 | 1 641 | 17,89 | ||||
| 2025-08-04 | 13F | Creative Financial Designs Inc /adv | 71 112 | 13,93 | 2 832 | 23,18 | ||||
| 2025-07-21 | 13F | F&V Capital Management, LLC | 6 700 | 0,00 | 0 | |||||
| 2025-08-14 | 13F | Old Mission Capital Llc | 0 | −100,00 | 0 | |||||
| 2025-08-13 | 13F | Per Stirling Capital Management, LLC. | 8 396 | 32,72 | 334 | 43,35 | ||||
| 2025-08-14 | 13F | Mercer Global Advisors Inc /adv | 21 652 | −50,00 | 862 | −45,96 | ||||
| 2025-08-12 | 13F | Proequities, Inc. | 0 | 0 | ||||||
| 2025-08-14 | 13F | UBS Group AG | 227 665 | −54,15 | 9 068 | −50,43 | ||||
| 2025-08-07 | 13F | Altman Advisors, Inc. | 72 290 | 2,22 | 2 890 | 6,76 | ||||
| 2025-05-14 | 13F | Atomi Financial Group, Inc. | 0 | −100,00 | 0 | |||||
| 2025-08-06 | 13F | AE Wealth Management LLC | 38 | 0,00 | 2 | 0,00 | ||||
| 2025-08-08 | 13F | Advisory Resource Group | 43 902 | 0,26 | 1 749 | 8,37 | ||||
| 2025-07-15 | 13F | Family Investment Center, Inc. | 287 113 | 4,92 | 11 436 | 13,44 | ||||
| 2025-08-07 | 13F | Allworth Financial LP | 37 935 | −31,04 | 1 511 | −28,54 | ||||
| 2025-08-12 | 13F | Steward Partners Investment Advisory, Llc | 167 | 7 | ||||||
| 2025-07-14 | 13F | Westend Capital Management LLC | 50 | 0,00 | 2 | 0,00 | ||||
| 2025-08-14 | 13F | Benjamin Edwards Inc | 9 400 | 0,00 | 374 | 8,09 | ||||
| 2025-08-14 | 13F | Goldman Sachs Group Inc | 0 | −100,00 | 0 | |||||
| 2025-08-04 | 13F | Kovack Advisors, Inc. | 15 869 | 0,00 | 632 | 8,22 | ||||
| 2025-04-10 | 13F | KWB Wealth | 0 | −100,00 | 0 | |||||
| 2025-08-14 | 13F | Raymond James Financial Inc | 230 653 | −19,51 | 9 187 | −12,99 | ||||
| 2025-08-14 | 13F | CoreCap Advisors, LLC | 1 024 | 0,00 | 41 | 8,11 | ||||
| 2025-07-11 | 13F | Adirondack Trust Co | 0 | −100,00 | 0 | |||||
| 2025-08-14 | 13F | Kovitz Investment Group Partners, LLC | 141 451 | −1,40 | 5 634 | 6,58 | ||||
| 2025-08-05 | 13F | Fourth Dimension Wealth, LLC | 933 | 0,11 | 37 | 8,82 | ||||
| 2025-08-14 | 13F | Ieq Capital, Llc | 28 701 | 123,88 | 1 143 | 142,16 | ||||
| 2025-08-04 | 13F | Rede Wealth, LLC | 11 413 | 1,25 | 455 | 9,40 | ||||
| 2025-08-08 | 13F | Avantax Advisory Services, Inc. | 31 037 | 196,75 | 1 236 | 221,04 | ||||
| 2025-07-07 | 13F | First Community Trust Na | 40 | 14,29 | 2 | 0,00 | ||||
| 2025-07-30 | 13F | Phoenix Holdings Ltd. | 13 600 | 542 | ||||||
| 2025-08-06 | 13F | Agf Management Ltd | 1 024 368 | −0,60 | 40 801 | 7,47 | ||||
| 2025-04-25 | 13F | Red Tortoise LLC | 0 | −100,00 | 0 | |||||
| 2025-08-28 | NP | ICCIX - Dynamic International Opportunity Fund Class I | 67 696 | 5,16 | 2 696 | 13,71 | ||||
| 2025-05-15 | 13F | Main Management ETF Advisors, LLC | 0 | −100,00 | 0 | |||||
| 2025-08-13 | 13F | EverSource Wealth Advisors, LLC | 6 889 | 540,84 | 274 | 602,56 | ||||
| 2025-05-15 | 13F | Main Management LLC | 0 | −100,00 | 0 | |||||
| 2025-05-14 | 13F | Caitlin John, LLC | 0 | −100,00 | 0 | |||||
| 2025-08-26 | NP | FFALX - Franklin Founding Funds Allocation Fund Class A | 165 050 | 0,00 | 6 574 | 8,11 | ||||
| 2025-07-29 | 13F | Private Trust Co Na | 423 | 17 | ||||||
| 2025-07-10 | 13F | Focus Financial Network, Inc. | 43 909 | 7,19 | 1 749 | 15,84 | ||||
| 2025-05-06 | 13F | Bank Julius Baer & Co. Ltd, Zurich | 0 | −100,00 | 0 | |||||
| 2025-06-26 | NP | SSXU - Day Hagan/Ned Davis Research Smart Sector International ETF | 64 510 | 19,33 | 2 469 | 24,95 | ||||
| 2025-08-13 | 13F | Scotia Capital Inc. | 5 554 | 221 | ||||||
| 2025-07-31 | 13F | Brighton Jones Llc | 15 254 | 0,16 | 608 | 8,20 | ||||
| 2025-08-12 | 13F | SRS Capital Advisors, Inc. | 143 | 0,00 | 6 | 0,00 | ||||
| 2025-08-13 | 13F | IAG Wealth Partners, LLC | 1 125 | 0,00 | 45 | 7,32 | ||||
| 2025-07-08 | 13F/A | Salem Investment Counselors Inc | 642 | 0,00 | 26 | 8,70 | ||||
| 2025-08-13 | 13F | Basso Capital Management, L.p. | 4 100 | 163 | ||||||
| 2025-08-13 | 13F | Loomis Sayles & Co L P | 8 266 | 315,79 | 329 | |||||
| 2025-08-12 | 13F | Jpmorgan Chase & Co | 890 | −94,46 | 35 | −94,09 | ||||
| 2025-05-14 | 13F | Coco Enterprises, LLC | 0 | −100,00 | 0 | |||||
| 2025-07-21 | 13F | Mirae Asset Global Investments Co., Ltd. | 79 801 | −9,32 | 3 178 | −1,94 | ||||
| 2025-07-24 | 13F | Comprehensive Money Management Services LLC | 9 520 | −1,04 | 379 | 7,06 | ||||
| 2025-08-11 | 13F | Synergy Investment Management, LLC | 0 | −100,00 | 0 | |||||
| 2025-08-27 | 13F/A | Brinker Capital Investments, LLC | 6 046 | 241 | ||||||
| 2025-07-28 | 13F | Ativo Capital Management LLC | 192 310 | −41,09 | 7 660 | −36,31 | ||||
| 2025-08-05 | 13F | Integrity Financial Corp /WA | 723 | 19,50 | 29 | 27,27 | ||||
| 2025-08-15 | 13F | Equitable Holdings, Inc. | 5 304 | −52,14 | 211 | −48,28 | ||||
| 2025-08-11 | 13F | VSM Wealth Advisory, LLC | 1 356 | 54 | ||||||
| 2025-08-08 | 13F | Gts Securities Llc | 6 079 | 242 | ||||||
| 2025-08-11 | 13F | TD Waterhouse Canada Inc. | 515 | 0,00 | 21 | 11,11 | ||||
| 2025-08-12 | 13F | O'shaughnessy Asset Management, Llc | 512 | 20 | ||||||
| 2025-07-30 | 13F | Whittier Trust Co Of Nevada Inc | 49 358 | 42,81 | 1 965 | 54,36 | ||||
| 2025-08-14 | 13F | Royal Bank Of Canada | 97 165 | 85,13 | 3 870 | 100,10 | ||||
| 2025-07-21 | 13F | Old Second National Bank Of Aurora | 308 588 | 33,65 | 12 291 | 44,50 | ||||
| 2025-08-12 | 13F | MAI Capital Management | 0 | −100,00 | 0 | |||||
| 2025-09-04 | 13F/A | Advisor Group Holdings, Inc. | 45 717 | 20,60 | 1 821 | 30,37 | ||||
| 2025-07-24 | 13F | Edge Financial Advisors LLC | 17 125 | 36,14 | 683 | 47,30 | ||||
| 2025-04-21 | 13F | Nelson, Van Denburg & Campbell Wealth Management Group, LLC | 0 | −100,00 | 0 | |||||
| 2025-07-16 | 13F | Northern Oak Wealth Management Inc | 21 844 | 6,61 | 870 | 15,38 | ||||
| 2025-08-19 | 13F | Cape Investment Advisory, Inc. | 1 597 | 23,42 | 64 | 34,04 | ||||
| 2025-08-13 | 13F | Bank Of Nova Scotia | 40 410 | 1 610 | ||||||
| 2025-04-25 | 13F | Stonebridge Financial Group, LLC | 0 | −100,00 | 0 | |||||
| 2025-07-30 | 13F | Whittier Trust Co | 78 644 | 36,77 | 3 132 | 47,83 | ||||
| 2025-08-08 | 13F | Cetera Investment Advisers | 43 107 | −48,83 | 1 717 | −44,70 | ||||
| 2025-08-07 | 13F | Kestra Private Wealth Services, Llc | 13 742 | 21,42 | 547 | 31,49 | ||||
| 2025-08-14 | 13F | Investment Management Corp of Ontario | 1 563 681 | 220,31 | 62 281 | 246,31 | ||||
| 2025-08-08 | 13F | Principal Financial Group Inc | 687 319 | 29,39 | 27 376 | 39,88 | ||||
| 2025-08-08 | 13F | Pnc Financial Services Group, Inc. | 18 785 | 16,89 | 748 | 26,35 | ||||
| 2025-07-22 | 13F | Knights of Columbus Asset Advisors LLC | 18 513 | 0,00 | 737 | 8,06 | ||||
| 2025-08-08 | 13F | Mittelman Wealth Management | 22 742 | 42,00 | 906 | 53,65 | ||||
| 2025-07-31 | 13F | Oppenheimer & Co Inc | 6 208 | 247 | ||||||
| 2025-08-11 | 13F | Private Advisor Group, LLC | 68 917 | −12,26 | 2 745 | −5,15 | ||||
| 2025-08-15 | 13F | Kestra Advisory Services, LLC | 13 405 | 24,88 | 534 | 34,94 | ||||
| 2025-07-10 | 13F | Rfg Holdings, Inc. | 100 363 | −0,47 | 3 997 | 7,59 | ||||
| 2025-08-06 | 13F | Texas Yale Capital Corp. | 26 070 | 0,39 | 1 038 | 8,58 | ||||
| 2025-08-14 | 13F | Avid Wealth Partners LLC | 0 | −100,00 | 0 | |||||
| 2025-08-11 | 13F | Greykasell Wealth Strategies, Inc. | 27 236 | 9,01 | 1 085 | 17,83 | ||||
| 2025-08-14 | 13F | Comerica Bank | 566 | −47,83 | 23 | −43,59 | ||||
| 2025-08-12 | 13F | Franklin Resources Inc | 228 200 | −14,55 | 9 089 | −7,61 | ||||
| 2025-08-13 | 13F | JBR Co Financial Management Inc | 6 260 | −41,23 | 249 | −36,48 | ||||
| 2025-08-06 | 13F | Innealta Capital, Llc | 67 790 | 5,15 | 2 700 | 13,68 | ||||
| 2025-08-05 | 13F | Carolinas Wealth Consulting Llc | 0 | −100,00 | 0 | |||||
| 2025-05-05 | 13F | Csenge Advisory Group | 0 | −100,00 | 0 | |||||
| 2025-08-14 | 13F | Jane Street Group, Llc | 0 | −100,00 | 0 | |||||
| 2025-08-13 | 13F | Quadrature Capital Ltd | 19 141 | −72,68 | 763 | −70,41 | ||||
| 2025-07-11 | 13F | Farther Finance Advisors, LLC | 4 055 | 2,92 | 162 | 11,81 | ||||
| 2025-08-04 | 13F | Arkadios Wealth Advisors | 5 693 | 3,58 | 227 | 11,88 | ||||
| 2025-08-08 | 13F | Capital Investment Advisory Services, LLC | 0 | −100,00 | 0 | |||||
| 2025-07-21 | 13F | Ameritas Advisory Services, LLC | 1 542 | 61 | ||||||
| 2025-08-06 | 13F | C WorldWide Group Holding A/S | 39 569 | 2 | ||||||
| 2025-05-13 | 13F | Heck Capital Advisors, LLC | 0 | −100,00 | 0 | −100,00 | ||||
| 2025-07-21 | 13F | River Street Advisors LLC | 150 280 | 42,12 | 5 986 | 53,66 | ||||
| 2025-08-07 | 13F | Gs Investments, Inc. | 8 085 | 0,00 | 322 | 8,42 | ||||
| 2025-07-31 | 13F | Cambridge Investment Research Advisors, Inc. | 13 431 | −4,14 | 1 | |||||
| 2025-08-14 | 13F | Citadel Advisors Llc | 11 692 | 8,73 | 466 | 17,42 |