Grundläggande statistik
| Institutionella ägare | 128 total, 128 long only, 0 short only, 0 long/short - change of −2,29% MRQ |
| Genomsnittlig portföljallokering | 0.2974 % - change of 23,61% MRQ |
| Institutionella aktier (lång) | 41 336 195 (ex 13D/G) - change of 12,81MM shares 44,92% MRQ |
| Institutionellt värde (lång) | $ 275 548 USD ($1000) |
Institutionellt ägande och aktieägare
Cornerstone Strategic Investment Fund, Inc. (US:CLM) har 128 Institutionella ägare och aktieägare som har lämnat in 13D/G- eller 13F-formulär till Securities Exchange Commission (SEC). Dessa institut innehar totalt 41,336,195 aktier. Största aktieägare inkluderar Alpine Global Management, LLC, Boothbay Fund Management, Llc, Sit Investment Associates Inc, Advisor Group Holdings, Inc., Sculptor Capital LP, Rivernorth Capital Management, Llc, LPL Financial LLC, Absolute Investment Advisers Llc, Yakira Capital Management, Inc., and Thomas J. Herzfeld Advisors, Inc. .
Cornerstone Strategic Investment Fund, Inc. (NYSEAM:CLM) Institutionell ägarstruktur visar institutioners och fonders nuvarande positioner i företaget, samt de senaste förändringarna i positionernas storlek. Större aktieägare kan vara enskilda investerare, fonder, hedgefonder eller institutioner. Bilaga 13D visar att investeraren äger (eller ägde) mer än 5% av företaget och avser (eller avsåg) att aktivt eftersträva en förändring av affärsstrategin. Schedule 13G indikerar en passiv investering på över 5%.
The share price as of September 10, 2025 is 8,18 / share. Previously, on September 11, 2024, the share price was 7,57 / share. This represents an increase of 8,06% over that period.

Fondsentimentets poäng
Fondsentimentet poängen(fka Ägarackumulation-poäng) visar vilka aktier som är mest köpta av fonder. Det är resultatet av en sofistikerad kvantitativ flerfaktormodell som identifierar företag med de högsta nivåerna av institutionell ackumulering. Poängsättningsmodellen använder en kombination av den totala ökningen av redovisade ägare, förändringarna i portföljallokeringarna för dessa ägare och andra mått. Siffran sträcker sig från 0 till 100, där högre siffror indikerar en högre nivå av ackumulering i förhållande till sina konkurrenter, och 50 är genomsnittet.
Uppdateringsfrekvens: Dagligen
Se Ownership Explorer, som innehåller en lista över de högst rankade företagen.
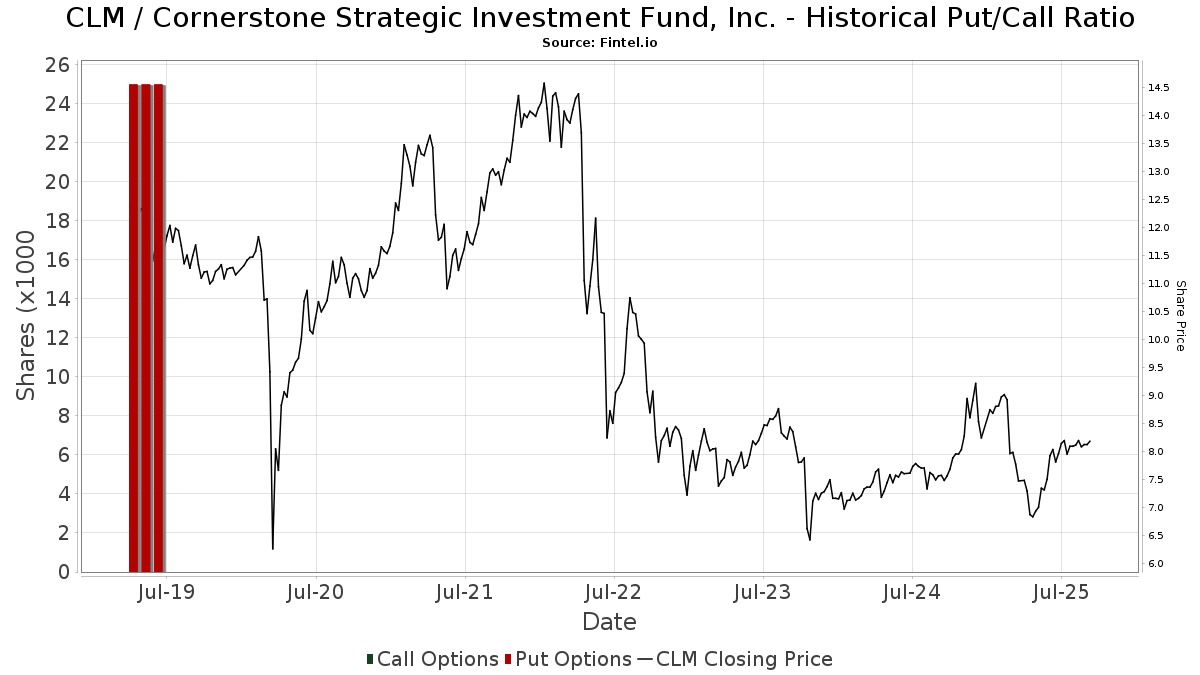
Institutionell sälj/köp-kvot
Förutom att rapportera vanliga eget kapital- och skuldemissioner måste institutioner med mer än 100MM tillgångar under förvaltning också avslöja sina innehav av sälj- och köpoptioner. Eftersom säljoptioner i allmänhet indikerar ett negativt sentiment och köpoptioner indikerar ett positivt sentiment, kan vi få en uppfattning om det övergripande institutionella sentimentet genom att plotta förhållandet mellan säljoptioner och köpoptioner. Diagrammet till höger visar det historiska förhållandet mellan sälj- och köpoptioner för detta instrument.
Genom att använda sälj/köp-kvoten som en indikator på aktieägarnas sentiment undviker man en av de största bristerna med att använda det totala institutionella ägandet, nämligen att en betydande del av de förvaltade tillgångarna investeras passivt för att följa index. Passivt förvaltade fonder köper vanligtvis inte optioner, så indikatorn för sälj/köp-kvoten ger en bättre bild av stämningen i aktivt förvaltade fonder.
13F- och NPORT-arkiveringar
Detaljer om 13F-arkiveringar är gratis. Detaljer om NP-arkiveringar kräver ett premiummedlemskap. Gröna rader indikerar nya positioner. Röda rader indikerar stängda positioner. Klicka på länk symbolen för att se hela transaktionshistoriken.
Uppgradera
för att låsa upp premiumdata och exportera till Excel ![]() .
.
| Fil Datum | Källa | Investerare | Typ | Genomsnittligt pris (beräknat) |
Aktier | Δ Aktier (%) |
Rapporterat värde (1000 USD) |
Δ Värde (%) |
Portföljallokering (%) |
|
|---|---|---|---|---|---|---|---|---|---|---|
| 2025-08-14 | 13F | Garden State Investment Advisory Services LLC | 61 706 | 21,56 | 501 | 32,89 | ||||
| 2025-08-14 | 13F | Sunbelt Securities, Inc. | 1 181 | −4,83 | 10 | 11,11 | ||||
| 2025-08-14 | 13F/A | Rockefeller Capital Management L.P. | 25 702 | −5,17 | 209 | 3,48 | ||||
| 2025-08-14 | 13F | Boothbay Fund Management, Llc | 6 135 929 | 3,99 | 49 824 | 13,64 | ||||
| 2025-07-21 | 13F | Clarity Capital Partners LLC | 14 089 | −78,71 | 114 | −76,78 | ||||
| 2025-07-08 | 13F | Nbc Securities, Inc. | 18 455 | 0,00 | 0 | |||||
| 2025-08-14 | 13F | Ursa Fund Management, LLC | 275 000 | 1 000,00 | 2 233 | 1 107,03 | ||||
| 2025-08-12 | 13F | RPG Investment Advisory, LLC | 0 | −100,00 | 0 | |||||
| 2025-05-15 | 13F | Tower Research Capital LLC (TRC) | 0 | −100,00 | 0 | |||||
| 2025-08-14 | 13F | Banque Transatlantique SA | 0 | −100,00 | 0 | |||||
| 2025-07-10 | 13F | Marshall Financial Group LLC | 10 000 | 0,00 | 82 | 9,46 | ||||
| 2025-08-14 | 13F | UBS Group AG | 23 194 | −56,53 | 188 | −52,53 | ||||
| 2025-08-26 | 13F/A | Thrivent Financial For Lutherans | 145 939 | 45,28 | 1 | |||||
| 2025-07-01 | 13F | Harbor Investment Advisory, Llc | 11 204 | 0,00 | 91 | 8,43 | ||||
| 2025-08-19 | 13F | Newbridge Financial Services Group, Inc. | 10 000 | 81 | ||||||
| 2025-07-25 | 13F | Sequoia Financial Advisors, LLC | 21 400 | −2,73 | 174 | 6,13 | ||||
| 2025-08-12 | 13F | Global Retirement Partners, LLC | 0 | −100,00 | 0 | |||||
| 2025-08-29 | 13F | Evolution Wealth Management Inc. | 19 425 | 158 | ||||||
| 2025-07-14 | 13F | Buska Wealth Management, LLC | 18 017 | 9,07 | 146 | 19,67 | ||||
| 2025-07-29 | 13F | Stratos Wealth Partners, LTD. | 548 477 | 49,72 | 4 454 | 63,65 | ||||
| 2025-08-04 | 13F | Assetmark, Inc | 1 971 | −68,38 | 16 | −65,22 | ||||
| 2025-08-11 | 13F | Anfield Capital Management, LLC | 6 528 | 0,00 | 53 | 10,42 | ||||
| 2025-07-08 | 13F/A | Salem Investment Counselors Inc | 700 | 0,00 | 6 | 0,00 | ||||
| 2025-05-12 | 13F | Independent Advisor Alliance | 0 | −100,00 | 0 | |||||
| 2025-08-14 | 13F | Benjamin Edwards Inc | 109 511 | −10,65 | 889 | −2,31 | ||||
| 2025-08-13 | 13F | Yakira Capital Management, Inc. | 1 197 769 | 80,72 | 9 726 | 97,50 | ||||
| 2025-08-14 | 13F | Ameriprise Financial Inc | 15 916 | 0,00 | 129 | 9,32 | ||||
| 2025-08-01 | 13F | Envestnet Asset Management Inc | 45 212 | −12,29 | 367 | −4,18 | ||||
| 2025-08-05 | 13F | GPS Wealth Strategies Group, LLC | 8 010 | 17,62 | 65 | 30,00 | ||||
| 2025-08-14 | 13F | Alpine Global Management, LLC | 6 612 795 | 5,36 | 53 696 | 15,15 | ||||
| 2025-08-14 | 13F | Cohen & Steers, Inc. | 734 931 | 21,04 | 6 | 25,00 | ||||
| 2025-07-10 | 13F | HF Advisory Group, LLC | 21 939 | 3,96 | 178 | 14,10 | ||||
| 2025-08-11 | 13F | Perennial Investment Advisors, LLC | 451 228 | 3,27 | 3 664 | 12,85 | ||||
| 2025-08-06 | 13F | Vantage Financial Partners, LLC | 21 437 | −14,28 | 174 | −5,95 | ||||
| 2025-08-15 | 13F | Morgan Stanley | 508 044 | 12,11 | 4 125 | 22,51 | ||||
| 2025-07-11 | 13F | Seacrest Wealth Management, Llc | 23 938 | 26,61 | 194 | 38,57 | ||||
| 2025-07-10 | 13F | Redhawk Wealth Advisors, Inc. | 23 678 | 4,94 | 192 | 14,97 | ||||
| 2025-08-13 | 13F | Northwestern Mutual Wealth Management Co | 9 755 | −30,90 | 79 | −24,04 | ||||
| 2025-08-05 | 13F | Dunhill Financial, LLC | 856 | 7 | ||||||
| 2025-07-21 | 13F | Ameritas Advisory Services, LLC | 1 191 | 10 | ||||||
| 2025-07-22 | 13F | Firethorn Wealth Partners, Llc | 17 146 | 4,94 | 139 | 14,88 | ||||
| 2025-08-11 | 13F | United Capital Financial Advisers, Llc | 0 | −100,00 | 0 | |||||
| 2025-08-12 | 13F | Park Square Financial Group, LLC | 5 695 | 0,00 | 46 | 9,52 | ||||
| 2025-07-14 | 13F | Capital CS Group, LLC | 22 568 | 28,56 | 183 | 40,77 | ||||
| 2025-08-14 | 13F | Millennium Management Llc | 26 574 | 216 | ||||||
| 2025-08-27 | NP | ACEFX - Absolute Strategies Fund Institutional Shares | 41 440 | 336 | ||||||
| 2025-08-11 | 13F | HighTower Advisors, LLC | 59 496 | −43,94 | 483 | −38,71 | ||||
| 2025-08-14 | 13F | Fmr Llc | 39 673 | 90 065,91 | 322 | |||||
| 2025-08-07 | 13F | Allworth Financial LP | 14 463 | 2 228,99 | 117 | 2 825,00 | ||||
| 2025-07-15 | 13F | Absolute Investment Advisers Llc | 1 229 119 | 9 980 | ||||||
| 2025-08-11 | 13F | Mosaic Family Wealth Partners, Llc | 11 448 | 7,85 | 93 | 17,95 | ||||
| 2025-03-12 | 13F | Centaurus Financial, Inc. | 0 | −100,00 | 0 | −100,00 | ||||
| 2025-09-04 | 13F/A | Advisor Group Holdings, Inc. | 3 493 550 | 29,30 | 28 367 | 41,31 | ||||
| 2025-08-28 | NP | Rivernorth Opportunities Fund, Inc. | 287 123 | 70,61 | 2 331 | 94,41 | ||||
| 2025-08-01 | 13F | First Command Advisory Services, Inc. | 0 | 0 | ||||||
| 2025-08-15 | 13F/A | Cable Car Capital LLC | 661 825 | −0,11 | 5 374 | 9,18 | ||||
| 2025-07-21 | 13F | Ameriflex Group, Inc. | 0 | −100,00 | 0 | |||||
| 2025-07-31 | 13F | BIP Wealth, LLC | 0 | −100,00 | 0 | |||||
| 2025-07-17 | 13F | Sound Income Strategies, LLC | 4 864 | 0,00 | 39 | 8,33 | ||||
| 2025-08-14 | 13F | Raymond James Financial Inc | 351 430 | 13,12 | 2 854 | 23,61 | ||||
| 2025-07-31 | 13F | Cambridge Investment Research Advisors, Inc. | 498 849 | −4,43 | 4 | 33,33 | ||||
| 2025-08-14 | 13F | Rivernorth Capital Management, Llc | 1 803 392 | 14 644 | ||||||
| 2025-08-27 | NP | AAHYX - Thrivent Diversified Income Plus Fund Class A | 21 815 | 41,12 | 177 | 55,26 | ||||
| 2025-04-10 | 13F | Charles Schwab Trust Co | 0 | −100,00 | 0 | |||||
| 2025-08-27 | NP | THRIVENT SERIES FUND INC - Thrivent Balanced Income Plus Portfolio Class A | 5 094 | 33,35 | 41 | 46,43 | ||||
| 2025-08-07 | 13F | Resources Investment Advisors, LLC. | 10 260 | 83 | ||||||
| 2025-05-02 | 13F | Dakota Wealth Management | 0 | −100,00 | 0 | |||||
| 2025-08-12 | 13F | Proequities, Inc. | 0 | 0 | ||||||
| 2025-07-30 | 13F | BlueChip Wealth Advisors LLC | 13 497 | 3,12 | 110 | 12,37 | ||||
| 2025-08-06 | 13F | Tabor Asset Management, LP | 0 | −100,00 | 0 | −100,00 | ||||
| 2025-07-09 | 13F | Dynamic Advisor Solutions LLC | 41 545 | 5,33 | 337 | 15,02 | ||||
| 2025-08-08 | 13F | Cetera Investment Advisers | 610 585 | 20,88 | 4 958 | 32,08 | ||||
| 2025-05-13 | 13F | Soltis Investment Advisors LLC | 0 | −100,00 | 0 | |||||
| 2025-08-06 | 13F | Commonwealth Equity Services, Llc | 251 740 | 0,51 | 2 | 100,00 | ||||
| 2025-07-29 | 13F | Chicago Partners Investment Group LLC | 26 351 | −15,44 | 213 | −2,29 | ||||
| 2025-08-13 | 13F | Baird Financial Group, Inc. | 91 397 | −1,35 | 742 | 7,85 | ||||
| 2025-08-14 | 13F | Toronto Dominion Bank | 50 000 | 406 | ||||||
| 2025-08-08 | 13F | Avantax Advisory Services, Inc. | 83 899 | 681 | ||||||
| 2025-05-16 | 13F | Jones Financial Companies Lllp | 0 | −100,00 | 0 | |||||
| 2025-08-12 | 13F | BlackRock, Inc. | 83 144 | 79,03 | 675 | 95,65 | ||||
| 2025-07-18 | 13F | PFG Investments, LLC | 37 318 | −26,30 | 303 | −19,41 | ||||
| 2025-08-14 | 13F | Ieq Capital, Llc | 0 | −100,00 | 0 | |||||
| 2025-08-14 | 13F | Stifel Financial Corp | 47 215 | 12,64 | 383 | 23,15 | ||||
| 2025-05-16 | 13F | Coppell Advisory Solutions LLC | 0 | −100,00 | 0 | |||||
| 2025-07-23 | 13F | Valmark Advisers, Inc. | 10 000 | 0,00 | 81 | 9,46 | ||||
| 2025-07-22 | 13F | DAVENPORT & Co LLC | 12 773 | 0,00 | 104 | 9,57 | ||||
| 2025-08-06 | 13F | Wedbush Securities Inc | 13 850 | −30,49 | 0 | |||||
| 2025-08-14 | 13F | GWM Advisors LLC | 29 865 | 29,85 | 243 | 42,35 | ||||
| 2025-07-11 | 13F | Farther Finance Advisors, LLC | 4 804 | 55,52 | 39 | 77,27 | ||||
| 2025-07-17 | 13F | Janney Montgomery Scott LLC | 0 | −100,00 | 0 | |||||
| 2025-08-08 | 13F | Larson Financial Group LLC | 10 122 | 52,42 | 82 | 67,35 | ||||
| 2025-08-14 | 13F | Citadel Advisors Llc | 37 929 | −23,98 | 308 | −17,03 | ||||
| 2025-08-14 | 13F | Sit Investment Associates Inc | 5 730 776 | 16 273,65 | 47 | |||||
| 2025-07-25 | 13F | We Are One Seven, LLC | 35 300 | 42,82 | 287 | 56,28 | ||||
| 2025-08-28 | NP | Cohen & Steers Closed-end Opportunity Fund, Inc. | 734 931 | 21,04 | 5 968 | 32,28 | ||||
| 2025-08-12 | 13F | Pathstone Holdings, LLC | 21 012 | 0,00 | 171 | 8,97 | ||||
| 2025-08-06 | 13F | AE Wealth Management LLC | 50 164 | 407 | ||||||
| 2025-08-13 | 13F | StoneX Group Inc. | 133 949 | 45,52 | 1 088 | 59,15 | ||||
| 2025-07-25 | 13F | Atria Wealth Solutions, Inc. | 32 531 | −84,04 | 268 | −82,33 | ||||
| 2025-08-11 | 13F | Principal Securities, Inc. | 700 | 0,00 | 6 | −16,67 | ||||
| 2025-08-14 | 13F | CoreCap Advisors, LLC | 51 956 | 23,66 | 422 | 34,94 | ||||
| 2025-05-02 | 13F | Signaturefd, Llc | 0 | −100,00 | 0 | |||||
| 2025-04-22 | 13F | TrueMark Investments, LLC | 0 | −100,00 | 0 | |||||
| 2025-08-14 | 13F | Royal Bank Of Canada | 2 594 | 130,37 | 21 | 162,50 | ||||
| 2025-05-13 | 13F | Bokf, Na | 0 | −100,00 | 0 | |||||
| 2025-05-14 | 13F | Karpus Management, Inc. | 0 | −100,00 | 0 | |||||
| 2025-08-14 | 13F | Jane Street Group, Llc | 65 005 | 82,02 | 528 | 98,87 | ||||
| 2025-08-07 | 13F | Kestra Private Wealth Services, Llc | 24 297 | 19,81 | 197 | 31,33 | ||||
| 2025-06-26 | NP | AABFX - Thrivent Balanced Income Plus Fund Class A | 4 131 | 0,00 | 29 | −22,22 | ||||
| 2025-08-12 | 13F | AlphaCore Capital LLC | 0 | −100,00 | 0 | |||||
| 2025-06-26 | NP | AAINX - Thrivent Opportunity Income Plus Fund Class A | 33 107 | 0,00 | 229 | −22,37 | ||||
| 2025-07-17 | 13F | Sonora Investment Management Group, LLC | 10 135 | 0,00 | 82 | 9,33 | ||||
| 2025-08-08 | 13F | Kingsview Wealth Management, LLC | 10 000 | 0,00 | 81 | 9,46 | ||||
| 2025-08-13 | 13F | Townsquare Capital Llc | 0 | −100,00 | 0 | |||||
| 2025-08-11 | 13F | Aptus Capital Advisors, LLC | 217 910 | 1,33 | 1 769 | 10,77 | ||||
| 2025-05-07 | 13F | Sheaff Brock Investment Advisors, LLC | 13 830 | 0,00 | 103 | −13,56 | ||||
| 2025-05-15 | 13F | Mercer Global Advisors Inc /adv | 0 | −100,00 | 0 | |||||
| 2025-08-12 | 13F | Jpmorgan Chase & Co | 0 | −100,00 | 0 | |||||
| 2025-07-23 | 13F | Godsey & Gibb Associates | 1 000 | 0,00 | 8 | 14,29 | ||||
| 2025-05-13 | 13F | SHEPHERD WEALTH MANAGEMENT Ltd LIABILITY Co | 0 | −100,00 | 0 | |||||
| 2025-08-11 | 13F | Private Advisor Group, LLC | 51 681 | 1,27 | 420 | 10,55 | ||||
| 2025-08-04 | 13F | Creative Financial Designs Inc /adv | 81 742 | 15,17 | 664 | 25,81 | ||||
| 2025-07-11 | 13F | Adirondack Trust Co | 0 | −100,00 | 0 | |||||
| 2025-08-14 | 13F | Wells Fargo & Company/mn | 3 | −25,00 | 0 | |||||
| 2025-08-05 | 13F | Strategic Financial Concepts, LLC | 64 700 | −10,26 | 525 | −1,87 | ||||
| 2025-08-15 | 13F | Kestra Advisory Services, LLC | 34 447 | 119,88 | 280 | 140,52 | ||||
| 2025-05-12 | 13F | Evernest Financial Advisors, LLC | 0 | −100,00 | 0 | −100,00 | ||||
| 2025-07-24 | 13F | Us Bancorp \de\ | 256 505 | 0,00 | 2 083 | 9,29 | ||||
| 2025-08-12 | 13F | MAI Capital Management | 19 865 | 6,75 | 161 | 16,67 | ||||
| 2025-08-08 | 13F | Avalon Trust Co | 1 000 | −50,00 | 8 | −42,86 | ||||
| 2025-08-14 | 13F | Goldman Sachs Group Inc | 20 000 | 162 | ||||||
| 2025-08-01 | 13F | Pasadena Private Wealth, LLC | 13 945 | 20,18 | 113 | 31,40 | ||||
| 2025-08-11 | 13F | TD Waterhouse Canada Inc. | 0 | −100,00 | 0 | |||||
| 2025-08-14 | 13F | Sculptor Capital LP | 2 666 574 | 21 653 | ||||||
| 2025-07-28 | 13F | Harbour Investments, Inc. | 38 | 0,00 | 0 | |||||
| 2025-07-31 | 13F | Oppenheimer & Co Inc | 15 966 | −0,03 | 130 | 9,32 | ||||
| 2025-08-14 | 13F | Susquehanna International Group, Llp | 28 161 | −72,03 | 229 | −69,52 | ||||
| 2025-05-08 | 13F | Armis Advisers, LLC | 0 | −100,00 | 0 | |||||
| 2025-07-10 | 13F | Wealth Enhancement Advisory Services, Llc | 31 100 | 73,68 | 256 | 92,48 | ||||
| 2025-05-15 | 13F | Hrt Financial Lp | 0 | −100,00 | 0 | |||||
| 2025-08-12 | 13F | Steward Partners Investment Advisory, Llc | 1 | −99,99 | 0 | −100,00 | ||||
| 2025-08-08 | 13F | Capital Investment Advisory Services, LLC | 12 137 | 99 | ||||||
| 2025-08-12 | 13F | Virtu Financial LLC | 0 | −100,00 | 0 | |||||
| 2025-08-08 | 13F | Pnc Financial Services Group, Inc. | 1 200 | 0,00 | 10 | 12,50 | ||||
| 2025-08-12 | 13F | J.w. Cole Advisors, Inc. | 205 931 | 24,12 | 1 672 | 35,71 | ||||
| 2025-08-05 | 13F | Tsfg, Llc | 2 351 | 13 729,41 | 0 | |||||
| 2025-08-08 | 13F | Creative Planning | 120 974 | 26,88 | 982 | 38,70 | ||||
| 2025-08-08 | 13F | Meridian Wealth Management, LLC | 19 126 | 91,26 | 155 | 109,46 | ||||
| 2025-08-12 | 13F | Change Path, LLC | 39 112 | 318 | ||||||
| 2025-08-13 | 13F | Rsm Us Wealth Management Llc | 14 969 | 122 | ||||||
| 2025-08-14 | 13F | Bank Of America Corp /de/ | 3 904 | −99,79 | 32 | −99,78 | ||||
| 2025-08-13 | 13F | Summit Financial, LLC | 21 627 | 176 | ||||||
| 2025-07-24 | 13F | IFP Advisors, Inc | 0 | −100,00 | 0 | |||||
| 2025-08-14 | 13F | Quarry LP | 506 996 | 4 118,64 | 4 117 | 4 524,72 | ||||
| 2025-08-12 | 13F | LPL Financial LLC | 1 362 299 | 22,37 | 11 062 | 33,73 | ||||
| 2025-07-25 | 13F | Cwm, Llc | 31 | 0,00 | 0 | |||||
| 2025-08-07 | 13F | Encompass More Asset Management | 80 317 | 4,89 | 652 | 14,79 | ||||
| 2025-08-01 | 13F | Winebrenner Capital Management Llc | 108 426 | 0,00 | 880 | 9,32 | ||||
| 2025-08-13 | 13F | Thomas J. Herzfeld Advisors, Inc. | 1 074 966 | 1 109,29 | 8 729 | 1 222,42 | ||||
| 2025-08-04 | 13F | Integrity Alliance, Llc. | 0 | −100,00 | 0 | |||||
| 2025-08-06 | 13F | Prospera Financial Services Inc | 70 726 | 11,27 | 574 | 21,61 | ||||
| 2025-08-14 | 13F | Almitas Capital LLC | 0 | −100,00 | 0 | |||||
| 2025-08-27 | NP | THRIVENT SERIES FUND INC - Thrivent Diversified Income Plus Portfolio Class A | 12 946 | 33,34 | 105 | 45,83 | ||||
| 2025-05-12 | 13F | Kane Investment Management, Inc. | 0 | −100,00 | 0 | |||||
| 2025-08-14 | 13F | Integrated Wealth Concepts LLC | 12 210 | −1,47 | 99 | 7,61 | ||||
| 2025-07-22 | 13F | Grimes & Company, Inc. | 0 | −100,00 | 0 | |||||
| 2025-08-27 | NP | THRIVENT SERIES FUND INC - Thrivent Opportunity Income Plus Portfolio Class A | 9 906 | 33,34 | 80 | 45,45 |