Grundläggande statistik
| Institutionella ägare | 192 total, 192 long only, 0 short only, 0 long/short - change of 6,04% MRQ |
| Genomsnittlig portföljallokering | 0.2795 % - change of 2,44% MRQ |
| Institutionella aktier (lång) | 6 072 620 (ex 13D/G) - change of 0,40MM shares 7,07% MRQ |
| Institutionellt värde (lång) | $ 477 165 USD ($1000) |
Institutionellt ägande och aktieägare
Vanguard Admiral Funds - Vanguard S&P Small-Cap 600 Value ETF (US:VIOV) har 192 Institutionella ägare och aktieägare som har lämnat in 13D/G- eller 13F-formulär till Securities Exchange Commission (SEC). Dessa institut innehar totalt 6,072,620 aktier. Största aktieägare inkluderar Morgan Stanley, Aspiriant, Llc, N.E.W. Advisory Services LLC, UBS Group AG, Raymond James Financial Inc, One Day In July LLC, Gallagher Fiduciary Advisors, LLC, Atria Investments Llc, Envestnet Asset Management Inc, and Cannon Financial Strategists, Inc. .
Vanguard Admiral Funds - Vanguard S&P Small-Cap 600 Value ETF (ARCA:VIOV) Institutionell ägarstruktur visar institutioners och fonders nuvarande positioner i företaget, samt de senaste förändringarna i positionernas storlek. Större aktieägare kan vara enskilda investerare, fonder, hedgefonder eller institutioner. Bilaga 13D visar att investeraren äger (eller ägde) mer än 5% av företaget och avser (eller avsåg) att aktivt eftersträva en förändring av affärsstrategin. Schedule 13G indikerar en passiv investering på över 5%.
The share price as of September 22, 2025 is 96,01 / share. Previously, on September 23, 2024, the share price was 92,55 / share. This represents an increase of 3,74% over that period.

Fondsentimentets poäng
Fondsentimentet poängen(fka Ägarackumulation-poäng) visar vilka aktier som är mest köpta av fonder. Det är resultatet av en sofistikerad kvantitativ flerfaktormodell som identifierar företag med de högsta nivåerna av institutionell ackumulering. Poängsättningsmodellen använder en kombination av den totala ökningen av redovisade ägare, förändringarna i portföljallokeringarna för dessa ägare och andra mått. Siffran sträcker sig från 0 till 100, där högre siffror indikerar en högre nivå av ackumulering i förhållande till sina konkurrenter, och 50 är genomsnittet.
Uppdateringsfrekvens: Dagligen
Se Ownership Explorer, som innehåller en lista över de högst rankade företagen.
AI+ Ask Fintel’s AI assistant about Vanguard Admiral Funds - Vanguard S&P Small-Cap 600 Value ETF.
Thinking of good questions…
Institutionell sälj/köp-kvot
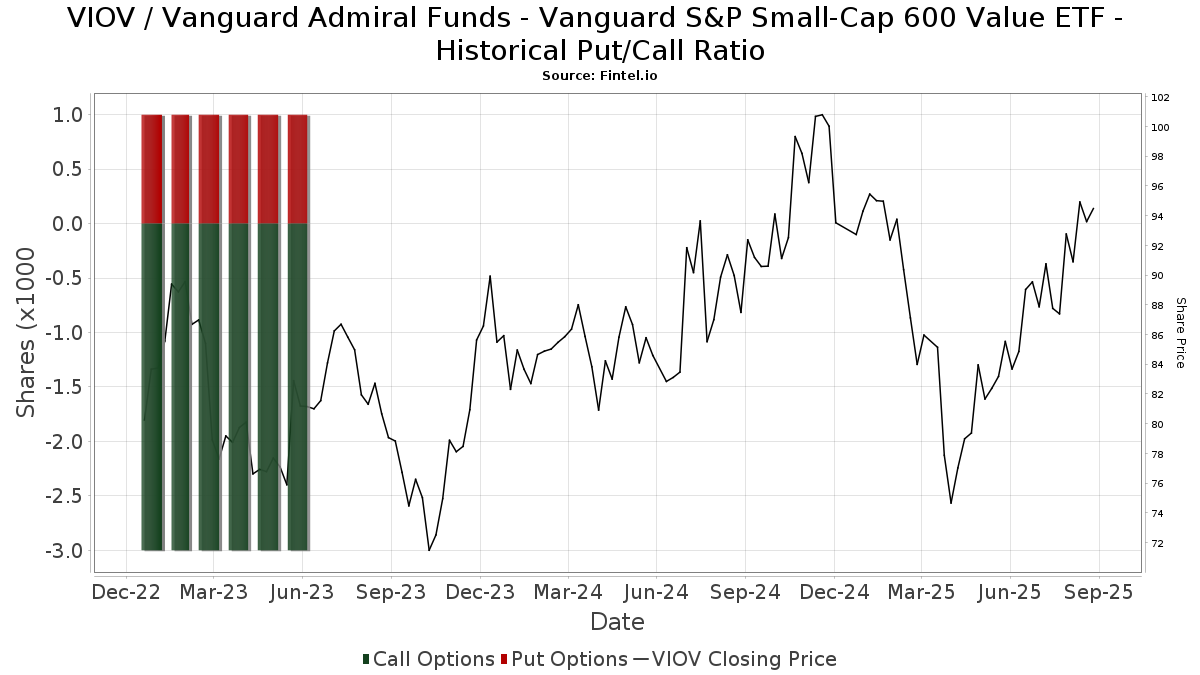
Förutom att rapportera vanliga eget kapital- och skuldemissioner måste institutioner med mer än 100MM tillgångar under förvaltning också avslöja sina innehav av sälj- och köpoptioner. Eftersom säljoptioner i allmänhet indikerar ett negativt sentiment och köpoptioner indikerar ett positivt sentiment, kan vi få en uppfattning om det övergripande institutionella sentimentet genom att plotta förhållandet mellan säljoptioner och köpoptioner. Diagrammet till höger visar det historiska förhållandet mellan sälj- och köpoptioner för detta instrument.
Genom att använda sälj/köp-kvoten som en indikator på aktieägarnas sentiment undviker man en av de största bristerna med att använda det totala institutionella ägandet, nämligen att en betydande del av de förvaltade tillgångarna investeras passivt för att följa index. Passivt förvaltade fonder köper vanligtvis inte optioner, så indikatorn för sälj/köp-kvoten ger en bättre bild av stämningen i aktivt förvaltade fonder.
13F- och NPORT-arkiveringar
Detaljer om 13F-arkiveringar är gratis. Detaljer om NP-arkiveringar kräver ett premiummedlemskap. Gröna rader indikerar nya positioner. Röda rader indikerar stängda positioner. Klicka på länk symbolen för att se hela transaktionshistoriken.
Uppgradera
för att låsa upp premiumdata och exportera till Excel ![]() .
.
| Fil Datum | Källa | Investerare | Typ | Genomsnittligt pris (beräknat) |
Aktier | Δ Aktier (%) |
Rapporterat värde (1000 USD) |
Δ Värde (%) |
Portföljallokering (%) |
|
|---|---|---|---|---|---|---|---|---|---|---|
| 2025-08-06 | 13F | Modera Wealth Management, LLC | 0 | −100,00 | 0 | |||||
| 2025-07-28 | 13F | Harbour Investments, Inc. | 132 | 0,00 | 11 | 0,00 | ||||
| 2025-08-13 | 13F | Congress Wealth Management LLC / DE / | 3 834 | 328 | ||||||
| 2025-07-10 | 13F | Rfg Holdings, Inc. | 46 817 | −41,64 | 4 006 | −40,53 | ||||
| 2025-08-13 | 13F | StoneX Group Inc. | 2 533 | 217 | ||||||
| 2025-08-14 | 13F | Alliancebernstein L.p. | 11 210 | 0,00 | 959 | 2,02 | ||||
| 2025-08-14 | 13F | Wells Fargo & Company/mn | 56 259 | −13,98 | 4 814 | −12,28 | ||||
| 2025-08-04 | 13F | One Day In July LLC | 185 189 | −9,98 | 15 847 | −8,21 | ||||
| 2025-08-07 | 13F | Resources Investment Advisors, LLC. | 8 929 | −13,54 | 764 | −11,78 | ||||
| 2025-08-01 | 13F | American Financial & Tax Strategies Inc | 21 642 | 0,00 | 1 852 | 1,93 | ||||
| 2025-08-06 | 13F | Aspect Partners, LLC | 1 600 | 0,00 | 137 | 1,49 | ||||
| 2025-08-13 | 13F | Jones Financial Companies Lllp | 1 599 | 829,65 | 137 | 878,57 | ||||
| 2025-08-14 | 13F | Wellington Management Group Llp | 54 878 | −47,30 | 4 696 | −46,27 | ||||
| 2025-07-31 | 13F | Buckingham Strategic Partners | 11 436 | 979 | ||||||
| 2025-07-22 | 13F | Evensky & Katz LLC | 23 211 | −3,63 | 2 | −50,00 | ||||
| 2025-08-04 | 13F | Atria Investments Llc | 169 780 | 5,15 | 14 528 | 7,23 | ||||
| 2025-07-22 | 13F | Valley National Advisers Inc | 1 328 | −1,85 | 0 | |||||
| 2025-08-14 | 13F | McIlrath & Eck, LLC | 14 | 0,00 | 1 | 0,00 | ||||
| 2025-08-11 | 13F | Brown Brothers Harriman & Co | 348 | 0,00 | 30 | 0,00 | ||||
| 2025-09-04 | 13F/A | Advisor Group Holdings, Inc. | 130 481 | −0,29 | 11 169 | 1,68 | ||||
| 2025-07-17 | 13F | Fiduciary Advisors, Inc. | 234 | 0,00 | 20 | 5,26 | ||||
| 2025-08-14 | 13F | Gallagher Fiduciary Advisors, LLC | 172 189 | 5,12 | 14 734 | 7,20 | ||||
| 2025-08-14 | 13F | CoreCap Advisors, LLC | 327 | 0,00 | 28 | 0,00 | ||||
| 2025-07-29 | NP | VEVFX - Vanguard Explorer Value Fund Investor Shares | 24 599 | −74,20 | 2 025 | −76,35 | ||||
| 2025-07-31 | 13F | Silver Oak Advisory Group, Inc. | 91 247 | −1,80 | 8 | 0,00 | ||||
| 2025-08-13 | 13F | EverSource Wealth Advisors, LLC | 53 | 0,00 | 5 | 0,00 | ||||
| 2025-07-15 | 13F | Financial Management Professionals, Inc. | 96 | 0,00 | 8 | 0,00 | ||||
| 2025-08-14 | 13F | Evergreen Capital Management Llc | 40 904 | 0,00 | 3 500 | 1,98 | ||||
| 2025-08-07 | 13F | BHK Investment Advisors, LLC | 3 200 | 0,00 | 274 | 1,87 | ||||
| 2025-08-01 | 13F | SYM FINANCIAL Corp | 136 238 | 0,52 | 11 658 | 2,51 | ||||
| 2025-08-12 | 13F | O'shaughnessy Asset Management, Llc | 349 | −14,67 | 30 | −14,71 | ||||
| 2025-04-23 | 13F | Saxony Capital Management, LLC | 0 | −100,00 | 0 | −100,00 | ||||
| 2025-09-22 | 13F | Caldwell Trust Co | 80 | 7 | ||||||
| 2025-08-11 | 13F | TD Waterhouse Canada Inc. | 90 | 0,00 | 8 | 0,00 | ||||
| 2025-08-11 | 13F | Citigroup Inc | 580 | 0,00 | 50 | 2,08 | ||||
| 2025-07-11 | 13F | Harbour Capital Advisors, LLC | 3 991 | 0,00 | 355 | 13,06 | ||||
| 2025-08-12 | 13F | CIBC Private Wealth Group, LLC | 3 424 | 0,00 | 293 | 19,11 | ||||
| 2025-07-18 | 13F | TruNorth Capital Management, LLC | 3 288 | 0,00 | 281 | 2,18 | ||||
| 2025-07-23 | 13F | Proffitt & Goodson Inc | 330 | 0,00 | 28 | 3,70 | ||||
| 2025-08-14 | 13F | Mariner, LLC | 31 839 | −13,49 | 2 724 | −11,79 | ||||
| 2025-08-15 | 13F | Fidelity D & D Bancorp Inc | 2 359 | 0,00 | 202 | −8,64 | ||||
| 2025-08-13 | 13F | Transce3nd, LLC | 896 | −4,17 | 77 | −2,56 | ||||
| 2025-05-05 | 13F | Hollencrest Capital Management | 0 | −100,00 | 0 | −100,00 | ||||
| 2025-07-31 | 13F | Sage Mountain Advisors LLC | 1 890 | 0,00 | 162 | 1,90 | ||||
| 2025-07-15 | 13F | Td Private Client Wealth Llc | 2 919 | 1,60 | 250 | 3,32 | ||||
| 2025-07-25 | 13F | Ackerman Capital Advisors, LLC | 17 564 | 22,89 | 1 503 | 25,27 | ||||
| 2025-07-30 | 13F | D.a. Davidson & Co. | 41 557 | 7,87 | 3 556 | 10,02 | ||||
| 2025-08-14 | 13F | Raymond James Financial Inc | 235 086 | −7,61 | 20 116 | −5,78 | ||||
| 2025-07-15 | 13F | Family Wealth Partners, Llc | 10 081 | 863 | ||||||
| 2025-07-30 | 13F | Rehmann Capital Advisory Group | 0 | −100,00 | 0 | |||||
| 2025-08-07 | 13F | Cahill Financial Advisors Inc | 3 253 | 0,37 | 278 | 2,58 | ||||
| 2025-07-08 | 13F | Parallel Advisors, LLC | 369 | 0,00 | 32 | 3,33 | ||||
| 2025-08-05 | 13F | Carolinas Wealth Consulting Llc | 0 | −100,00 | 0 | |||||
| 2025-07-30 | 13F | Studio Investment Management Llc | 24 815 | 9,65 | 2 123 | 11,80 | ||||
| 2025-08-07 | 13F | Allworth Financial LP | 32 | 0,00 | 3 | 0,00 | ||||
| 2025-07-10 | 13F | Wealth Enhancement Advisory Services, Llc | 74 302 | 229,60 | 6 647 | 251,51 | ||||
| 2025-08-01 | 13F | Envestnet Asset Management Inc | 168 970 | −0,86 | 14 459 | 1,09 | ||||
| 2025-08-13 | 13F | Northwestern Mutual Wealth Management Co | 15 020 | −42,33 | 1 285 | −41,19 | ||||
| 2025-07-25 | 13F | Total Clarity Wealth Management, Inc. | 22 390 | 1 916 | ||||||
| 2025-08-01 | 13F | Gwn Securities Inc. | 5 200 | 96,90 | 446 | 101,36 | ||||
| 2025-05-12 | 13F | Independent Advisor Alliance | 0 | −100,00 | 0 | |||||
| 2025-07-09 | 13F | Christopher J. Hasenberg, Inc | 20 | 0,00 | 2 | 0,00 | ||||
| 2025-05-12 | 13F | Sandy Spring Bank | 2 | −91,67 | 0 | −100,00 | ||||
| 2025-08-04 | 13F | Assetmark, Inc | 2 189 | 927,70 | 187 | 1 000,00 | ||||
| 2025-07-23 | 13F | Asset Planning Corporation | 123 949 | 14,91 | 10 606 | 17,18 | ||||
| 2025-08-14 | 13F | Moneta Group Investment Advisors Llc | 20 708 | −87,72 | 1 772 | −87,48 | ||||
| 2025-08-14 | 13F | CIBC World Markets Inc. | 20 076 | 1,35 | 1 718 | 3,31 | ||||
| 2025-08-14 | 13F | Marquette Associates, Inc. | 38 278 | 3 275 | ||||||
| 2025-05-14 | 13F | Atomi Financial Group, Inc. | 0 | −100,00 | 0 | |||||
| 2025-08-12 | 13F | Pathstone Holdings, LLC | 69 561 | 5 952 | ||||||
| 2025-08-08 | 13F | Bailard, Inc. | 8 171 | 699 | ||||||
| 2025-05-09 | 13F | Atria Wealth Solutions, Inc. | 0 | −100,00 | 0 | |||||
| 2025-08-25 | 13F | Silverlake Wealth Management Llc | 3 934 | 15,16 | 337 | 17,48 | ||||
| 2025-05-15 | 13F | Hrt Financial Lp | 0 | −100,00 | 0 | |||||
| 2025-07-17 | 13F | HB Wealth Management, LLC | 8 666 | 0,00 | 742 | 1,93 | ||||
| 2025-07-21 | 13F | Ameriflex Group, Inc. | 171 | 0,00 | 15 | 0,00 | ||||
| 2025-07-25 | 13F | Inman Jager Wealth Management, LLC | 21 979 | 30,84 | 1 881 | 33,43 | ||||
| 2025-08-12 | 13F | Proequities, Inc. | 0 | 0 | ||||||
| 2025-08-14 | 13F | Betterment LLC | 8 656 | 35,31 | 1 | |||||
| 2025-07-11 | 13F | Diversified Trust Co | 6 377 | 546 | ||||||
| 2025-08-06 | 13F | Commonwealth Equity Services, Llc | 28 474 | −50,05 | 2 | −50,00 | ||||
| 2025-08-11 | 13F | Empowered Funds, LLC | 6 334 | 542 | ||||||
| 2025-08-14 | 13F | EP Wealth Advisors, Inc. | 25 608 | 0,00 | 2 191 | 2,00 | ||||
| 2025-07-21 | 13F | Barrett & Company, Inc. | 3 105 | 0,03 | 266 | 1,92 | ||||
| 2025-08-14 | 13F | Ameriprise Financial Inc | 38 651 | −8,92 | 3 307 | −7,16 | ||||
| 2025-07-11 | 13F | Farther Finance Advisors, LLC | 3 358 | −26,44 | 287 | −24,87 | ||||
| 2025-07-29 | 13F | Salomon & Ludwin, LLC | 746 | 0,00 | 66 | 6,45 | ||||
| 2025-07-09 | 13F | Riversedge Advisors, Llc | 103 387 | 43,49 | 8 847 | 46,31 | ||||
| 2025-07-17 | 13F | Vermillion Wealth Management, Inc. | 17 | 0,00 | 1 | 0,00 | ||||
| 2025-07-25 | 13F | Envestnet Portfolio Solutions, Inc. | 8 581 | 0,32 | 734 | 2,37 | ||||
| 2025-07-17 | 13F | Janney Montgomery Scott LLC | 7 906 | −6,30 | 1 | |||||
| 2025-08-14 | 13F | Jane Street Group, Llc | 10 539 | 902 | ||||||
| 2025-08-14 | 13F | Two Sigma Investments, Lp | 0 | −100,00 | 0 | |||||
| 2025-08-08 | 13F | SBI Securities Co., Ltd. | 78 | 0,00 | 7 | 0,00 | ||||
| 2025-08-14 | 13F | Integrated Investment Consultants, LLC | 25 911 | −4,35 | 2 217 | −2,46 | ||||
| 2025-07-09 | 13F | Bruce G. Allen Investments, LLC | 2 297 | 272,29 | 197 | 284,31 | ||||
| 2025-05-14 | 13F | Smartleaf Asset Management LLC | 0 | −100,00 | 0 | |||||
| 2025-08-08 | 13F | Larson Financial Group LLC | 860 | 0,70 | 74 | 2,82 | ||||
| 2025-08-14 | 13F | Mml Investors Services, Llc | 23 641 | 1,35 | 2 | 100,00 | ||||
| 2025-08-13 | 13F | Financial Freedom, LLC | 1 450 | −28,92 | 124 | −27,49 | ||||
| 2025-07-24 | 13F | Morton Brown Family Wealth, LLC | 28 | 0,00 | 2 | 0,00 | ||||
| 2025-08-12 | 13F | Howe & Rusling Inc | 1 175 | 0,00 | 101 | 2,04 | ||||
| 2025-07-16 | 13F | Crowley Wealth Management, Inc. | 34 | 0,00 | 3 | 0,00 | ||||
| 2025-08-05 | 13F | Bank Of Montreal /can/ | 0 | −100,00 | 0 | |||||
| 2025-08-12 | 13F | Global Retirement Partners, LLC | 38 598 | 4,21 | 3 303 | −4,46 | ||||
| 2025-08-12 | 13F | Coldstream Capital Management Inc | 0 | −100,00 | 0 | |||||
| 2025-08-04 | 13F | Bristlecone Advisors, LLC | 7 800 | 0,00 | 667 | 1,99 | ||||
| 2025-07-22 | 13F | Red Door Wealth Management, LLC | 27 780 | 4,02 | 2 377 | 6,12 | ||||
| 2025-08-05 | 13F | Code Waechter LLC | 69 170 | 5 919 | ||||||
| 2025-08-19 | 13F | Asset Dedication, LLC | 584 | 0,00 | 50 | 0,00 | ||||
| 2025-08-11 | 13F | HighTower Advisors, LLC | 5 774 | −0,09 | 494 | 2,07 | ||||
| 2025-08-14 | 13F | Susquehanna International Group, Llp | 18 127 | 178,79 | 1 551 | 184,59 | ||||
| 2025-07-25 | 13F | Cwm, Llc | 90 527 | −4,51 | 8 | 0,00 | ||||
| 2025-08-15 | 13F | Tower Research Capital LLC (TRC) | 5 | 0 | ||||||
| 2025-08-13 | 13F | Russell Investments Group, Ltd. | 136 | −5,56 | 12 | −8,33 | ||||
| 2025-08-06 | 13F | Stokes Family Office, LLC | 5 880 | 20,49 | 503 | 22,98 | ||||
| 2025-07-28 | 13F | BRYN MAWR TRUST Co | 220 | 0,00 | 19 | 0,00 | ||||
| 2025-08-15 | 13F | CI Private Wealth, LLC | 7 346 | 629 | ||||||
| 2025-07-31 | 13F | FSA Investment Group, LLC | 0 | −100,00 | 0 | |||||
| 2025-08-11 | 13F | Aptus Capital Advisors, LLC | 1 068 | 0,00 | 91 | 2,25 | ||||
| 2025-08-12 | 13F | MAI Capital Management | 174 | 0,58 | 15 | 0,00 | ||||
| 2025-08-14 | 13F | Silvercrest Asset Management Group Llc | 105 065 | 4,77 | 8 990 | 6,83 | ||||
| 2025-08-11 | 13F | Mosaic Family Wealth Partners, Llc | 3 942 | 0,20 | 337 | 2,12 | ||||
| 2025-07-29 | 13F | Aspiriant, Llc | 340 934 | 957,09 | 29 174 | 978,09 | ||||
| 2025-08-14 | 13F | Financial Advisory Service, Inc. | 2 964 | 2,53 | 254 | 4,55 | ||||
| 2025-08-08 | 13F | Cetera Investment Advisers | 28 677 | −17,23 | 2 454 | −15,62 | ||||
| 2025-07-22 | 13F | Simplicity Wealth,LLC | 0 | −100,00 | 0 | |||||
| 2025-08-05 | 13F | Snider Financial Group | 3 997 | −3,10 | 342 | −1,16 | ||||
| 2025-08-13 | 13F | Brown Advisory Inc | 19 117 | 274,77 | 1 636 | 282,01 | ||||
| 2025-07-31 | 13F | Glass Jacobson Investment Advisors llc | 637 | 0,00 | 55 | −8,47 | ||||
| 2025-08-04 | 13F | Pensionmark Financial Group, Llc | 47 490 | 5,76 | 4 064 | 7,86 | ||||
| 2025-07-28 | 13F | Naviter Wealth, LLC | 12 814 | 0,00 | 1 096 | 2,33 | ||||
| 2025-08-08 | 13F | Ogorek Anthony Joseph /ny/ /adv | 0 | −100,00 | 0 | |||||
| 2025-08-06 | 13F | Vestmark Advisory Solutions, Inc. | 10 746 | 17,19 | 920 | 19,51 | ||||
| 2025-08-06 | 13F | Adviser Investments LLC | 6 051 | −36,71 | 518 | −35,54 | ||||
| 2025-07-18 | 13F | Lowery Thomas, Llc | 0 | −100,00 | 0 | |||||
| 2025-08-11 | 13F | FSA Wealth Management LLC | 0 | −100,00 | 0 | |||||
| 2025-05-14 | 13F | Huntington National Bank | 3 | 200,00 | ||||||
| 2025-07-24 | 13F | Brandywine Oak Private Wealth Llc | 34 355 | −1,15 | 2 940 | 0,79 | ||||
| 2025-08-08 | 13F | Keyvantage Wealth, Llc | 8 116 | −7,63 | 694 | −5,83 | ||||
| 2025-07-09 | 13F | First Bank & Trust | 78 422 | 0,00 | 6 711 | 1,98 | ||||
| 2025-07-22 | 13F | Miracle Mile Advisors, LLC | 16 331 | 4,25 | 1 397 | 6,32 | ||||
| 2025-08-14 | 13F | Financial Strategies Group, Inc. | 14 055 | 9,93 | 1 256 | 30,16 | ||||
| 2025-05-15 | 13F | Lido Advisors, LLC | 0 | −100,00 | 0 | |||||
| 2025-07-29 | 13F | Stephens Inc /ar/ | 2 958 | 0,00 | 253 | 2,02 | ||||
| 2025-08-14 | 13F | Colony Group, LLC | 7 891 | 675 | ||||||
| 2025-07-23 | 13F | Richardson Capital Management LLC | 13 | 0,00 | 1 | 0,00 | ||||
| 2025-08-14 | 13F | Beaird Harris Wealth Management, LLC | 4 044 | 0,35 | 346 | 2,37 | ||||
| 2025-07-14 | 13F | AdvisorNet Financial, Inc | 206 | 0,49 | 18 | 0,00 | ||||
| 2025-08-11 | 13F | Sierra Capital LLC | 4 729 | −49,67 | 0 | |||||
| 2025-08-04 | 13F | Creative Financial Designs Inc /adv | 495 | 42 | ||||||
| 2025-08-07 | 13F | Verus Capital Partners, Llc | 2 879 | 246 | ||||||
| 2025-07-09 | 13F | Hardin Capital Partners, LLC | 3 062 | 1,09 | 269 | 5,51 | ||||
| 2025-04-30 | 13F | Stratos Wealth Partners, LTD. | 0 | −100,00 | 0 | |||||
| 2025-05-12 | 13F | Simplex Trading, Llc | 0 | −100,00 | 0 | |||||
| 2025-08-06 | 13F | Atlantic Union Bankshares Corp | 102 | 9 | ||||||
| 2025-08-13 | 13F | Sepio Capital, LP | 0 | −100,00 | 0 | −100,00 | ||||
| 2025-07-14 | 13F | Park Avenue Securities Llc | 64 815 | 6 | ||||||
| 2025-08-14 | 13F | Van Eck Associates Corp | 78 364 | −42,57 | 7 | −45,45 | ||||
| 2025-04-28 | 13F | Strategic Financial Concepts, LLC | 0 | −100,00 | 0 | −100,00 | ||||
| 2025-08-12 | 13F | Bokf, Na | 62 | 5 | ||||||
| 2025-04-15 | 13F | Noble Wealth Management PBC | 893 | 0,00 | 75 | −10,84 | ||||
| 2025-07-24 | 13F | Us Bancorp \de\ | 1 007 | 0,20 | 86 | 2,38 | ||||
| 2025-08-12 | 13F | Jefferies Financial Group Inc. | 75 000 | 6 418 | ||||||
| 2025-08-06 | 13F | AE Wealth Management LLC | 133 | 3,91 | 11 | 10,00 | ||||
| 2025-08-06 | 13F | Decker Retirement Planning Inc. | 0 | −100,00 | 0 | |||||
| 2025-05-09 | 13F | Chicago Partners Investment Group LLC | 0 | −100,00 | 0 | |||||
| 2025-07-23 | 13F | Valmark Advisers, Inc. | 4 955 | −5,85 | 424 | −4,08 | ||||
| 2025-07-17 | 13F | Stone Point Wealth LLC | 3 731 | −8,62 | 319 | −6,73 | ||||
| 2025-07-25 | 13F | Integrated Capital Management, Inc. | 39 364 | −0,52 | 3 368 | 1,45 | ||||
| 2025-08-12 | 13F | Jpmorgan Chase & Co | 24 399 | −8,28 | 2 088 | −6,50 | ||||
| 2025-04-29 | 13F | Fairway Wealth LLC | 0 | −100,00 | 0 | |||||
| 2025-08-18 | 13F | N.E.W. Advisory Services LLC | 322 805 | −8,79 | 27 622 | −6,99 | ||||
| 2025-07-21 | 13F | Ameritas Advisory Services, LLC | 208 | 18 | ||||||
| 2025-08-04 | 13F | Spire Wealth Management | 17 876 | −28,83 | 1 530 | −27,43 | ||||
| 2025-05-02 | 13F | Wealthfront Advisers Llc | 0 | −100,00 | 0 | −100,00 | ||||
| 2025-08-06 | 13F | Rialto Wealth Management, LLC | 1 924 | 6,95 | 165 | 9,33 | ||||
| 2025-08-14 | 13F | Bank Of America Corp /de/ | 132 040 | −5,80 | 11 299 | −3,94 | ||||
| 2025-08-14 | 13F | Glen Eagle Advisors, LLC | 200 | 0,00 | 17 | 6,25 | ||||
| 2025-05-12 | 13F | Virtu Financial LLC | 0 | −100,00 | 0 | |||||
| 2025-08-11 | 13F | Rockbridge Investment Management, LCC | 4 273 | 0,09 | 366 | 1,96 | ||||
| 2025-07-22 | 13F | Integrated Capital Management, LLC | 6 741 | −3,52 | 1 | |||||
| 2025-07-30 | 13F | Exencial Wealth Advisors, Llc | 30 893 | −0,74 | 2 643 | 1,23 | ||||
| 2025-08-06 | 13F | Cannon Financial Strategists, Inc. | 159 234 | 35,87 | 13 626 | 38,56 | ||||
| 2025-07-17 | 13F | Saxon Interests, Inc. | 29 953 | 0,00 | 2 514 | 0,00 | ||||
| 2025-08-11 | 13F | Private Advisor Group, LLC | 20 178 | −13,63 | 1 727 | −11,94 | ||||
| 2025-07-25 | 13F | St. Louis Trust Co | 16 300 | 1 395 | ||||||
| 2025-08-14 | 13F | Hurley Capital, LLC | 734 | 0,00 | 63 | 1,64 | ||||
| 2025-07-16 | 13F | Legend Financial Advisors, Inc. | 96 376 | −0,86 | 8 247 | 1,09 | ||||
| 2025-08-14 | 13F | Icon Wealth Advisors, LLC | 4 438 | 0,00 | 380 | 1,88 | ||||
| 2025-07-22 | 13F | Relyea Zuckerberg Hanson LLC | 8 017 | −25,29 | 686 | −23,78 | ||||
| 2025-07-31 | 13F | Cambridge Investment Research Advisors, Inc. | 71 452 | 1,93 | 6 | 20,00 | ||||
| 2025-08-08 | 13F | Creative Planning | 3 706 | −30,30 | 317 | −28,92 | ||||
| 2025-08-11 | 13F | Insight 2811, Inc. | 2 817 | 241 | ||||||
| 2025-07-28 | 13F | Mutual Advisors, LLC | 56 544 | 10,54 | 5 067 | 26,15 | ||||
| 2025-07-07 | 13F | Thurston, Springer, Miller, Herd & Titak, Inc. | 114 | 0,00 | 10 | 0,00 | ||||
| 2025-07-17 | 13F | Mokosak Advisory Group, LLC | 90 596 | 2,16 | 7 752 | 4,18 | ||||
| 2025-07-30 | 13F | Pacific Sun Financial Corp | 11 684 | −5,35 | 1 000 | −3,48 | ||||
| 2025-08-11 | 13F | Hexagon Capital Partners LLC | 0 | −100,00 | 0 | |||||
| 2025-07-25 | 13F | Keener Financial Planning LLC | 39 | 0 | ||||||
| 2025-07-25 | 13F | Wealth Architects, LLC | 12 070 | 0,00 | 1 033 | 1,98 | ||||
| 2025-04-14 | 13F | Octavia Wealth Advisors, LLC | 0 | −100,00 | 0 | |||||
| 2025-08-11 | 13F | Principal Securities, Inc. | 101 | 9,78 | 9 | 0,00 | ||||
| 2025-07-29 | 13F | Rodgers & Associates, LTD | 10 185 | 60,49 | 872 | 63,72 | ||||
| 2025-08-15 | 13F | Equitable Holdings, Inc. | 4 165 | 13,15 | 356 | 15,58 | ||||
| 2025-08-14 | 13F | Cardiff Park Advisors, Llc | 139 | 0,00 | 12 | 0,00 | ||||
| 2025-08-14 | 13F | Bragg Financial Advisors, Inc | 3 130 | 0,00 | 268 | 1,91 | ||||
| 2025-08-14 | 13F | UBS Group AG | 301 363 | −2,39 | 25 788 | −0,46 | ||||
| 2025-07-24 | 13F | Jfs Wealth Advisors, Llc | 216 | 0,00 | 18 | 0,00 | ||||
| 2025-07-17 | 13F | Nelson, Van Denburg & Campbell Wealth Management Group, LLC | 90 984 | 1 388,37 | 7 785 | 1 420,51 | ||||
| 2025-08-07 | 13F | Kestra Private Wealth Services, Llc | 7 637 | 14,51 | 653 | 16,82 | ||||
| 2025-07-30 | 13F | Phillips Financial Management, Llc | 13 980 | 0,00 | 1 196 | 1,96 | ||||
| 2025-09-09 | 13F | Cambridge Financial Group, LLC | 50 196 | 325,82 | 4 295 | 334,28 | ||||
| 2025-08-13 | 13F | Summit Wealth Group Llc / Co | 23 348 | 1 998 | ||||||
| 2025-08-14 | 13F | Citadel Advisors Llc | 0 | −100,00 | 0 | |||||
| 2025-08-13 | 13F | Continuum Advisory, LLC | 0 | −100,00 | 0 | |||||
| 2025-08-14 | 13F | First Manhattan Co | 122 225 | −0,97 | 10 459 | 0,98 | ||||
| 2025-08-15 | 13F | Morgan Stanley | 350 506 | 8,24 | 29 993 | 10,37 | ||||
| 2025-05-14 | 13F | Renaissance Technologies Llc | 0 | −100,00 | 0 | |||||
| 2025-05-15 | 13F | Old Mission Capital Llc | 0 | −100,00 | 0 | |||||
| 2025-04-22 | 13F | World Equity Group, Inc. | 0 | −100,00 | 0 | |||||
| 2025-07-17 | 13F | Fifth Third Securities, Inc. | 6 791 | 0,00 | 581 | 2,11 | ||||
| 2025-08-05 | 13F | Sigma Planning Corp | 4 204 | −21,97 | 360 | −20,58 | ||||
| 2025-08-12 | 13F | LPL Financial LLC | 123 166 | 20,01 | 10 539 | 22,38 | ||||
| 2025-08-14 | 13F | Royal Bank Of Canada | 25 721 | −25,98 | 2 200 | −24,55 | ||||
| 2025-08-08 | 13F | Pnc Financial Services Group, Inc. | 52 | 0,00 | 4 | 0,00 | ||||
| 2025-05-08 | 13F | Parkside Financial Bank & Trust | 0 | −100,00 | 0 | |||||
| 2025-08-14 | 13F | Fmr Llc | 4 679 | −8,92 | 400 | −7,19 | ||||
| 2025-08-14 | 13F | Qube Research & Technologies Ltd | 926 | 1 870,21 | 79 | 2 533,33 | ||||
| 2025-08-14 | 13F | Comerica Bank | 5 792 | 1,22 | 496 | 3,13 |