Grundläggande statistik
| Institutionella ägare | 170 total, 169 long only, 0 short only, 1 long/short - change of −6,56% MRQ |
| Genomsnittlig portföljallokering | 0.3498 % - change of −11,72% MRQ |
| Institutionella aktier (lång) | 11 199 401 (ex 13D/G) - change of 0,46MM shares 4,28% MRQ |
| Institutionellt värde (lång) | $ 552 962 USD ($1000) |
Institutionellt ägande och aktieägare
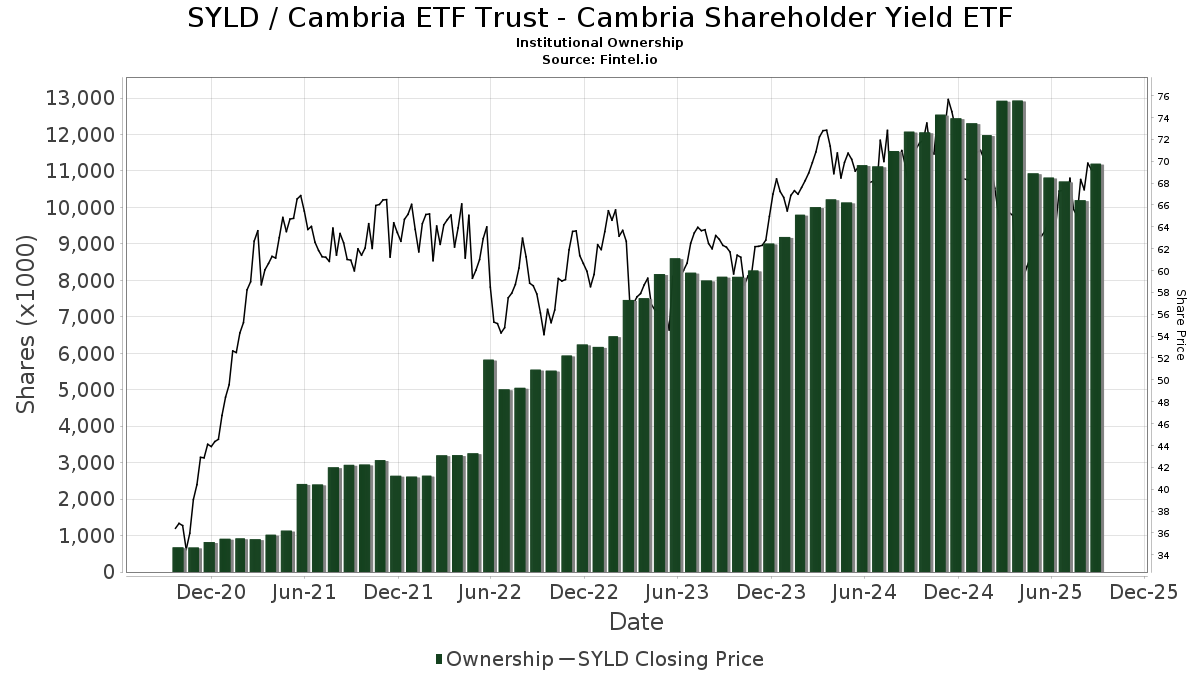
Cambria ETF Trust - Cambria Shareholder Yield ETF (US:SYLD) har 170 Institutionella ägare och aktieägare som har lämnat in 13D/G- eller 13F-formulär till Securities Exchange Commission (SEC). Dessa institut innehar totalt 11,199,401 aktier. Största aktieägare inkluderar Laurel Wealth Advisors LLC, Morgan Stanley, LPL Financial LLC, Raymond James Financial Inc, Intellus Advisors LLC, Commonwealth Equity Services, Llc, Revolve Wealth Partners, LLC, Colony Group, LLC, UBS Group AG, and VestGen Advisors, LLC .
Cambria ETF Trust - Cambria Shareholder Yield ETF (BATS:SYLD) Institutionell ägarstruktur visar institutioners och fonders nuvarande positioner i företaget, samt de senaste förändringarna i positionernas storlek. Större aktieägare kan vara enskilda investerare, fonder, hedgefonder eller institutioner. Bilaga 13D visar att investeraren äger (eller ägde) mer än 5% av företaget och avser (eller avsåg) att aktivt eftersträva en förändring av affärsstrategin. Schedule 13G indikerar en passiv investering på över 5%.
The share price as of September 11, 2025 is 70,35 / share. Previously, on September 12, 2024, the share price was 68,21 / share. This represents an increase of 3,14% over that period.
Fondsentimentets poäng
Fondsentimentet poängen(fka Ägarackumulation-poäng) visar vilka aktier som är mest köpta av fonder. Det är resultatet av en sofistikerad kvantitativ flerfaktormodell som identifierar företag med de högsta nivåerna av institutionell ackumulering. Poängsättningsmodellen använder en kombination av den totala ökningen av redovisade ägare, förändringarna i portföljallokeringarna för dessa ägare och andra mått. Siffran sträcker sig från 0 till 100, där högre siffror indikerar en högre nivå av ackumulering i förhållande till sina konkurrenter, och 50 är genomsnittet.
Uppdateringsfrekvens: Dagligen
Se Ownership Explorer, som innehåller en lista över de högst rankade företagen.
Institutionell sälj/köp-kvot
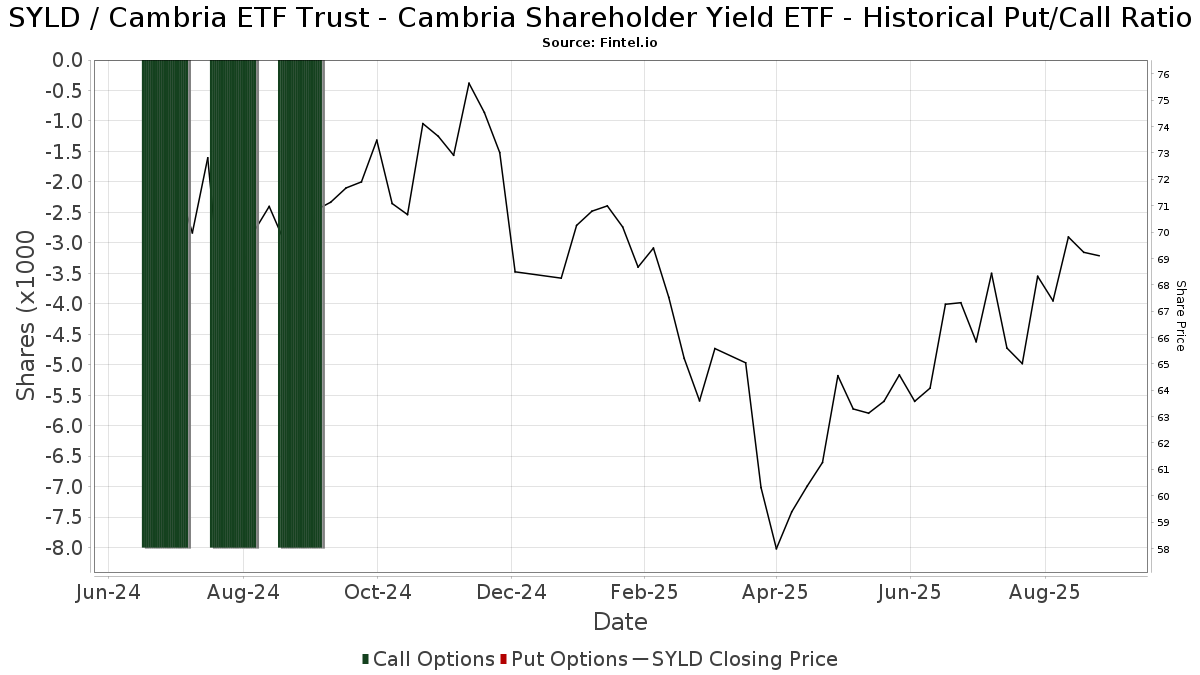
Förutom att rapportera vanliga eget kapital- och skuldemissioner måste institutioner med mer än 100MM tillgångar under förvaltning också avslöja sina innehav av sälj- och köpoptioner. Eftersom säljoptioner i allmänhet indikerar ett negativt sentiment och köpoptioner indikerar ett positivt sentiment, kan vi få en uppfattning om det övergripande institutionella sentimentet genom att plotta förhållandet mellan säljoptioner och köpoptioner. Diagrammet till höger visar det historiska förhållandet mellan sälj- och köpoptioner för detta instrument.
Genom att använda sälj/köp-kvoten som en indikator på aktieägarnas sentiment undviker man en av de största bristerna med att använda det totala institutionella ägandet, nämligen att en betydande del av de förvaltade tillgångarna investeras passivt för att följa index. Passivt förvaltade fonder köper vanligtvis inte optioner, så indikatorn för sälj/köp-kvoten ger en bättre bild av stämningen i aktivt förvaltade fonder.
13F- och NPORT-arkiveringar
Detaljer om 13F-arkiveringar är gratis. Detaljer om NP-arkiveringar kräver ett premiummedlemskap. Gröna rader indikerar nya positioner. Röda rader indikerar stängda positioner. Klicka på länk symbolen för att se hela transaktionshistoriken.
Uppgradera
för att låsa upp premiumdata och exportera till Excel ![]() .
.
| Fil Datum | Källa | Investerare | Typ | Genomsnittligt pris (beräknat) |
Aktier | Δ Aktier (%) |
Rapporterat värde (1000 USD) |
Δ Värde (%) |
Portföljallokering (%) |
|
|---|---|---|---|---|---|---|---|---|---|---|
| 2025-04-21 | 13F | Autumn Glory Partners, LLC | 0 | −100,00 | 0 | −100,00 | ||||
| 2025-08-14 | 13F/A | Rockefeller Capital Management L.P. | 12 296 | −16,13 | 800 | −14,55 | ||||
| 2025-08-15 | 13F | Morgan Stanley | 806 590 | −23,17 | 52 453 | −21,69 | ||||
| 2025-07-24 | 13F | Capital Advisors, Ltd. LLC | 5 350 | 2,73 | 0 | |||||
| 2025-04-29 | 13F | Resources Investment Advisors, LLC. | 0 | −100,00 | 0 | −100,00 | ||||
| 2025-08-12 | 13F | Cowa, Llc | 8 342 | −1,09 | 542 | 0,74 | ||||
| 2025-04-21 | 13F | Ronald Blue Trust, Inc. | 0 | −100,00 | 0 | −100,00 | ||||
| 2025-08-12 | 13F | Laurel Wealth Advisors LLC | 1 744 885 | 6 498,91 | 27 | −98,46 | ||||
| 2025-07-11 | 13F | Wealth Management Partners, LLC | 7 979 | −5,96 | 531 | −2,03 | ||||
| 2025-08-12 | 13F | Steward Partners Investment Advisory, Llc | 56 279 | 3,93 | 3 660 | 5,94 | ||||
| 2025-07-11 | 13F | Diversified Trust Co | 0 | −100,00 | 0 | −100,00 | ||||
| 2025-08-14 | 13F | Betterment LLC | 12 048 | −54,61 | 1 | −100,00 | ||||
| 2025-08-14 | 13F | Wells Fargo & Company/mn | 201 027 | −0,50 | 13 073 | 1,42 | ||||
| 2025-08-14 | 13F/A | Skopos Labs, Inc. | 414 | 27 | ||||||
| 2025-07-29 | 13F | Koshinski Asset Management, Inc. | 3 592 | −2,71 | 234 | −0,85 | ||||
| 2025-08-11 | 13F | Dorsey & Whitney Trust CO LLC | 8 620 | 0,00 | 561 | 2,00 | ||||
| 2025-08-14 | 13F | Federation des caisses Desjardins du Quebec | 155 | 0,00 | 10 | 11,11 | ||||
| 2025-07-28 | 13F | Sagespring Wealth Partners, Llc | 4 038 | 4,69 | 263 | 6,50 | ||||
| 2025-08-11 | 13F | United Advisor Group, LLC | 19 767 | 10,11 | 1 285 | 12,23 | ||||
| 2025-08-13 | 13F | Beacon Pointe Advisors, LLC | 10 315 | 18,90 | 671 | 21,16 | ||||
| 2025-08-11 | 13F | Private Advisor Group, LLC | 68 226 | −12,69 | 4 437 | −11,01 | ||||
| 2025-08-11 | 13F | Private Advisor Group, LLC | Put | 500 | 1 | |||||
| 2025-07-30 | 13F | Nottingham Advisors, Inc. | 20 617 | −0,84 | 1 341 | 1,06 | ||||
| 2025-08-13 | 13F | Valued Retirements, Inc. | 21 092 | −25,29 | 1 372 | −23,88 | ||||
| 2025-05-12 | 13F | Aveo Capital Partners, LLC | 0 | −100,00 | 0 | −100,00 | ||||
| 2025-08-06 | 13F | True Wealth Design, LLC | 1 574 | 0,00 | 102 | 2,00 | ||||
| 2025-08-14 | 13F | Two Sigma Securities, Llc | 0 | −100,00 | 0 | |||||
| 2025-06-27 | NP | TRTY - Cambria Trinity ETF | 36 124 | −44,02 | 2 180 | −52,00 | ||||
| 2025-08-12 | 13F | Bravias Capital Group, LLC | 22 571 | −0,52 | 1 468 | 1,38 | ||||
| 2025-08-14 | 13F | Goldman Sachs Group Inc | 16 537 | 8,57 | 1 075 | 10,71 | ||||
| 2025-08-04 | 13F | Center for Financial Planning, Inc. | 0 | −100,00 | 0 | |||||
| 2025-07-01 | 13F | First National Bank Sioux Falls | 8 253 | 3,05 | 537 | 5,10 | ||||
| 2025-07-25 | 13F | Atria Wealth Solutions, Inc. | 0 | −100,00 | 0 | |||||
| 2025-07-24 | 13F | IFP Advisors, Inc | 1 843 | 17,39 | 120 | 19,00 | ||||
| 2025-05-05 | 13F | Lindbrook Capital, Llc | 326 | 0,93 | 21 | −9,09 | ||||
| 2025-08-12 | 13F | Proequities, Inc. | 0 | 0 | ||||||
| 2025-07-24 | 13F | MSH Capital Advisors LLC | 3 386 | 0,03 | 220 | 2,33 | ||||
| 2025-08-05 | 13F | Atlas Wealth LLC | 54 535 | 3 638 | ||||||
| 2025-07-11 | 13F | OxenFree Capital LLC | 8 730 | 0,48 | 568 | 14,08 | ||||
| 2025-05-14 | 13F | Joseph P. Lucia & Associates, LLC | 0 | −100,00 | 0 | |||||
| 2025-08-14 | 13F | UBS Group AG | 321 319 | −6,27 | 20 895 | −4,47 | ||||
| 2025-08-06 | 13F | Founders Financial Securities Llc | 4 695 | −29,82 | 305 | −24,32 | ||||
| 2025-08-06 | 13F | 360 Financial, Inc. | 246 693 | 5,33 | 16 042 | 7,36 | ||||
| 2025-08-18 | 13F | Geneos Wealth Management Inc. | 23 937 | −1,93 | 1 557 | −0,06 | ||||
| 2025-05-12 | 13F | Blueprint Investment Partners LLC | 0 | −100,00 | 0 | |||||
| 2025-05-19 | 13F | Ubs Asset Management Americas Inc | 0 | −100,00 | 0 | |||||
| 2025-08-12 | 13F | LPL Financial LLC | 546 456 | −30,22 | 35 536 | −28,88 | ||||
| 2025-08-05 | 13F | Simplex Trading, Llc | 0 | −100,00 | 0 | |||||
| 2025-08-14 | 13F | Atomi Financial Group, Inc. | 236 710 | 8,26 | 15 393 | 10,35 | ||||
| 2025-07-21 | 13F | Ameritas Advisory Services, LLC | 683 | 44 | ||||||
| 2025-08-05 | 13F | Kesler, Norman & Wride, LLC | 58 592 | −0,08 | 3 810 | 1,84 | ||||
| 2025-07-16 | 13F | Meridian Financial, LLC | 13 634 | −0,45 | 887 | 1,49 | ||||
| 2025-08-04 | 13F | Atria Investments Llc | 0 | −100,00 | 0 | −100,00 | ||||
| 2025-07-09 | 13F | Dynamic Advisor Solutions LLC | 0 | −100,00 | 0 | |||||
| 2025-07-11 | 13F | Farther Finance Advisors, LLC | 367 | 0,00 | 24 | 0,00 | ||||
| 2025-08-05 | 13F | Harel Insurance Investments & Financial Services Ltd. | 7 000 | 204,35 | 0 | |||||
| 2025-07-18 | 13F | Dogwood Wealth Management LLC | 0 | −100,00 | 0 | −100,00 | ||||
| 2025-09-04 | 13F/A | Advisor Group Holdings, Inc. | 59 224 | 2,47 | 3 852 | 4,45 | ||||
| 2025-08-12 | 13F | Change Path, LLC | 4 254 | −43,12 | 277 | −42,14 | ||||
| 2025-08-13 | 13F | Baird Financial Group, Inc. | 4 927 | 0,69 | 320 | 2,56 | ||||
| 2025-07-15 | 13F | Verum Partners LLC | 164 704 | −8,90 | 10 711 | −7,14 | ||||
| 2025-07-31 | 13F | Longview Financial Advisors, Inc. | 20 509 | −11,71 | 1 334 | −10,05 | ||||
| 2025-07-10 | 13F | Rfg Holdings, Inc. | 0 | −100,00 | 0 | |||||
| 2025-08-12 | 13F | J.w. Cole Advisors, Inc. | 20 865 | 8,28 | 1 357 | 10,33 | ||||
| 2025-05-16 | 13F | Coppell Advisory Solutions LLC | 0 | −100,00 | 0 | |||||
| 2025-07-14 | 13F | UMA Financial Services, Inc. | 4 673 | −3,85 | 304 | −2,26 | ||||
| 2025-07-14 | 13F | Sentinel Pension Advisors Inc | 8 232 | 1,37 | 535 | 3,28 | ||||
| 2025-08-08 | 13F | Cetera Investment Advisers | 157 916 | −1,62 | 10 269 | 0,28 | ||||
| 2025-07-17 | 13F | Sound Income Strategies, LLC | 1 | 0 | ||||||
| 2025-06-27 | NP | GAA - Cambria Global Asset Allocation ETF | 30 986 | 0,00 | 1 870 | −14,26 | ||||
| 2025-07-10 | 13F | Wealth Enhancement Advisory Services, Llc | 50 124 | −15,53 | 3 378 | −10,78 | ||||
| 2025-08-05 | 13F | Astra Wealth Partners LLC | 6 810 | −36,62 | 443 | −35,47 | ||||
| 2025-07-30 | NP | ENDW - Cambria Endowment Style ETF | 1 130 | 71 | ||||||
| 2025-07-17 | 13F | Janney Montgomery Scott LLC | 14 946 | −64,75 | 1 | −100,00 | ||||
| 2025-07-15 | 13F | DKM Wealth Management, Inc. | 124 843 | −8,58 | 8 119 | −6,82 | ||||
| 2025-07-24 | 13F | Costello Asset Management, INC | 22 | 0,00 | 1 | 0,00 | ||||
| 2025-04-25 | 13F | Almanack Investment Partners, LLC. | 0 | −100,00 | 0 | −100,00 | ||||
| 2025-08-14 | 13F | Ancora Advisors, LLC | 3 302 | −19,11 | 215 | −17,69 | ||||
| 2025-08-05 | 13F | Huntington National Bank | 0 | |||||||
| 2025-08-04 | 13F | Arkadios Wealth Advisors | 112 900 | 28,16 | 7 342 | 30,62 | ||||
| 2025-05-14 | 13F | CIBC Private Wealth Group, LLC | 0 | −100,00 | 0 | −100,00 | ||||
| 2025-04-30 | 13F | Allworth Financial LP | 0 | −100,00 | 0 | |||||
| 2025-08-15 | 13F | Equitable Holdings, Inc. | 28 272 | 13,18 | 1 839 | 15,38 | ||||
| 2025-08-07 | 13F | BOK Financial Private Wealth, Inc. | 2 952 | 0,00 | 192 | 1,60 | ||||
| 2025-08-14 | 13F | Susquehanna International Group, Llp | 29 136 | 89,29 | 1 895 | 92,87 | ||||
| 2025-08-14 | 13F | Dagco, Inc. | 0 | −100,00 | 0 | |||||
| 2025-07-24 | 13F | Us Bancorp \de\ | 418 | 0,00 | 27 | 3,85 | ||||
| 2025-04-30 | 13F | Sofos Investments, Inc. | 1 500 | 71,23 | 96 | 61,02 | ||||
| 2025-08-04 | 13F | JDM Financial Group LLC | 162 | 0,00 | 11 | 0,00 | ||||
| 2025-08-14 | 13F | Raymond James Financial Inc | 509 081 | 5,14 | 33 106 | 7,17 | ||||
| 2025-08-01 | 13F | Brinker Capital Investments, LLC | 0 | −100,00 | 0 | −100,00 | ||||
| 2025-08-06 | 13F | Moors & Cabot, Inc. | 4 030 | −16,55 | 262 | −14,94 | ||||
| 2025-08-04 | 13F | Creekmur Asset Management LLC | 37 | 0,00 | 2 | 0,00 | ||||
| 2025-08-06 | 13F | Aspect Partners, LLC | 19 510 | 21,82 | 1 269 | 24,19 | ||||
| 2025-07-31 | 13F | Cambridge Investment Research Advisors, Inc. | 62 138 | −15,13 | 4 | 0,00 | ||||
| 2025-07-10 | 13F | Sharkey, Howes & Javer | 0 | −100,00 | 0 | |||||
| 2025-08-11 | 13F | HighTower Advisors, LLC | 195 999 | 25,68 | 12 746 | 28,10 | ||||
| 2025-08-11 | 13F | CFS Investment Advisory Services, LLC | 4 407 | 0 | ||||||
| 2025-08-14 | 13F | Colony Group, LLC | 339 231 | −2,91 | 22 060 | −1,04 | ||||
| 2025-07-31 | 13F | Opus Capital Group, LLC | 223 534 | −0,20 | 15 | 0,00 | ||||
| 2025-05-14 | 13F | Orion Portfolio Solutions, LLC | 4 245 | 0,00 | 291 | 0,00 | ||||
| 2025-08-15 | 13F | Kestra Advisory Services, LLC | 8 244 | 29,12 | 536 | 31,70 | ||||
| 2025-07-21 | 13F | DHJJ Financial Advisors, Ltd. | 14 | 0,00 | 1 | |||||
| 2025-07-25 | 13F | Apollon Wealth Management, LLC | 11 769 | −50,84 | 765 | −49,90 | ||||
| 2025-08-14 | 13F | Fmr Llc | 25 | 0,00 | 2 | 0,00 | ||||
| 2025-07-23 | 13F | Tcfg Wealth Management, Llc | 4 062 | 264 | ||||||
| 2025-07-30 | 13F | Evermay Wealth Management Llc | 0 | −100,00 | 0 | |||||
| 2025-04-01 | NP | GMOM - Cambria Global Momentum ETF | 90 949 | −2,92 | 6 402 | −2,42 | ||||
| 2025-07-11 | 13F | Kingstone Capital Partners Texas, LLC | 30 096 | 2 | ||||||
| 2025-08-12 | 13F | Intellus Advisors LLC | 475 582 | −3,96 | 30 927 | −2,10 | ||||
| 2025-08-14 | 13F | AllSquare Wealth Management LLC | 0 | −100,00 | 0 | |||||
| 2025-07-21 | 13F | HighMark Wealth Management LLC | 51 | 0,00 | 3 | 0,00 | ||||
| 2025-05-06 | 13F | Quadrant Private Wealth Management, LLC | 0 | −100,00 | 0 | |||||
| 2025-08-14 | 13F | Certified Advisory Corp | 0 | −100,00 | 0 | |||||
| 2025-07-28 | 13F | Revolve Wealth Partners, LLC | 366 072 | 11,02 | 23 806 | 13,16 | ||||
| 2025-08-13 | 13F | VestGen Advisors, LLC | 311 389 | 69,09 | 20 250 | 72,36 | ||||
| 2025-08-12 | 13F | MAI Capital Management | 18 146 | −32,03 | 1 180 | −30,71 | ||||
| 2025-08-13 | 13F | Jones Financial Companies Lllp | 19 691 | −8,41 | 1 282 | −6,22 | ||||
| 2025-08-14 | 13F | Stifel Financial Corp | 35 671 | −41,61 | 2 320 | −40,49 | ||||
| 2025-05-12 | 13F | Kohmann Bosshard Financial Services, LLC | 0 | −100,00 | 0 | |||||
| 2025-07-25 | 13F | We Are One Seven, LLC | 38 340 | −12,96 | 2 493 | −11,28 | ||||
| 2025-08-13 | 13F | Capital Analysts, Inc. | 82 | 0 | ||||||
| 2025-08-14 | 13F | Mercer Global Advisors Inc /adv | 0 | −100,00 | 0 | |||||
| 2025-08-11 | 13F | Rothschild Investment Llc | 213 537 | 8,09 | 13 886 | 10,17 | ||||
| 2025-08-04 | 13F | Assetmark, Inc | 82 | 5 | ||||||
| 2025-08-05 | 13F | Obermeyer Wood Investment Counsel, Lllp | 6 363 | 0,00 | 414 | 1,98 | ||||
| 2025-08-06 | 13F | Commonwealth Equity Services, Llc | 391 367 | −16,76 | 25 | −13,79 | ||||
| 2025-07-23 | 13F | Heck Capital Advisors, LLC | 0 | −100,00 | 0 | |||||
| 2025-08-14 | 13F | Hrt Financial Lp | 3 678 | 0 | ||||||
| 2025-08-11 | 13F | Compass Capital Corp /ma/ /adv | 0 | −100,00 | 0 | |||||
| 2025-08-04 | 13F | Hantz Financial Services, Inc. | 0 | −100,00 | 0 | |||||
| 2025-08-08 | 13F | Meridian Wealth Management, LLC | 14 860 | 3,07 | 966 | 5,11 | ||||
| 2025-08-14 | 13F | Warren Averett Asset Management, LLC | 5 955 | 0,00 | 387 | 2,11 | ||||
| 2025-07-24 | 13F/A | Mraz, Amerine & Associates, Inc. | 0 | −100,00 | 0 | −100,00 | ||||
| 2025-08-05 | 13F | Dunhill Financial, LLC | 150 | 10 | ||||||
| 2025-04-16 | 13F | Accordant Advisory Group Inc | 0 | −100,00 | 0 | |||||
| 2025-07-22 | 13F | Hubbell Strickland Wealth Management, LLC | 3 615 | 1,18 | 235 | 3,52 | ||||
| 2025-08-06 | 13F | Ethos Financial Group, LLC | 71 562 | 11,93 | 4 654 | 14,07 | ||||
| 2025-08-14 | 13F | Aqr Capital Management Llc | 10 662 | 51,30 | 693 | 54,34 | ||||
| 2025-07-08 | 13F | Parallel Advisors, LLC | 710 | 0,00 | 46 | 2,22 | ||||
| 2025-07-22 | 13F | Beacon Financial Advisory LLC | 5 228 | −7,73 | 340 | −6,09 | ||||
| 2025-07-28 | 13F | RFG Advisory, LLC | 14 323 | −1,53 | 931 | 0,32 | ||||
| 2025-08-12 | 13F | SRS Capital Advisors, Inc. | 1 000 | 65 | ||||||
| 2025-08-14 | 13F | Citadel Advisors Llc | 29 514 | −14,10 | 1 919 | −12,45 | ||||
| 2025-07-28 | 13F | Harbour Investments, Inc. | 1 164 | −80,07 | 76 | −79,84 | ||||
| 2025-07-14 | 13F | Southland Equity Partners LLC | 17 146 | 7,55 | 1 115 | 9,64 | ||||
| 2025-07-23 | 13F | Pure Portfolios Holdings Llc | 31 237 | −7,21 | 2 031 | −5,40 | ||||
| 2025-08-04 | 13F | Pensionmark Financial Group, Llc | 0 | −100,00 | 0 | |||||
| 2025-05-15 | 13F | Smith, Moore & Co. | 0 | −100,00 | 0 | −100,00 | ||||
| 2025-07-15 | 13F | Sheets Smith Wealth Management | 22 299 | −2,79 | 1 450 | −0,89 | ||||
| 2025-05-14 | 13F | Caitlin John, LLC | 0 | −100,00 | 0 | |||||
| 2025-08-06 | 13F | Rps Advisory Solutions Llc | 8 936 | 581 | ||||||
| 2025-07-15 | 13F | Evanson Asset Management, LLC | 16 483 | 0,00 | 1 072 | 1,90 | ||||
| 2025-08-12 | 13F | Gladstone Institutional Advisory LLC | 0 | −100,00 | 0 | −100,00 | ||||
| 2025-07-23 | 13F | Kingswood Wealth Advisors, Llc | 21 753 | −9,47 | 1 415 | −7,70 | ||||
| 2025-07-15 | 13F | Financial Partners Group, Inc | 17 684 | −33,98 | 1 150 | −32,67 | ||||
| 2025-04-11 | 13F | Godsey & Gibb Associates | 0 | −100,00 | 0 | |||||
| 2025-05-12 | 13F | Independent Advisor Alliance | 0 | −100,00 | 0 | −100,00 | ||||
| 2025-08-13 | 13F | Van Hulzen Asset Management, LLC | 5 720 | 5,19 | 372 | 7,23 | ||||
| 2025-08-11 | 13F | Baldwin Investment Management, LLC | 4 213 | 0,48 | 274 | 2,25 | ||||
| 2025-08-11 | 13F | Nations Financial Group Inc, /ia/ /adv | 4 849 | −17,04 | 315 | −15,32 | ||||
| 2025-04-29 | 13F | U.S. Capital Wealth Advisors, LLC | 0 | −100,00 | 0 | |||||
| 2025-07-15 | 13F | Genesis Wealth Advisors, LLC | 6 078 | 0,00 | 395 | 2,07 | ||||
| 2025-08-14 | 13F | Mml Investors Services, Llc | 31 334 | −32,79 | 2 | 0,00 | ||||
| 2025-05-15 | 13F | Mariner, LLC | 0 | −100,00 | 0 | |||||
| 2025-08-01 | 13F | Envestnet Asset Management Inc | 60 461 | −18,74 | 3 932 | −17,19 | ||||
| 2025-08-04 | 13F | Creative Financial Designs Inc /adv | 160 | −93,15 | 10 | −93,24 | ||||
| 2025-07-23 | 13F | Ameliora Wealth Management Ltd. | 303 | −96,53 | 20 | −96,58 | ||||
| 2025-07-11 | 13F | Compass Ion Advisors, LLC | 9 876 | −40,41 | 642 | −39,26 | ||||
| 2025-08-14 | 13F | Visionary Wealth Advisors | 59 297 | −5,20 | 3 856 | −3,36 | ||||
| 2025-07-09 | 13F | Fermata Advisors, LLC | 129 641 | −8,37 | 8 431 | −6,60 | ||||
| 2025-08-06 | 13F | Summit Wealth & Retirement Planning, Inc. | 17 151 | 5,30 | 1 115 | 7,31 | ||||
| 2025-08-14 | 13F | GWM Advisors LLC | 153 | 0,00 | 10 | 0,00 | ||||
| 2025-07-31 | 13F | Oppenheimer & Co Inc | 19 467 | −1,77 | 1 266 | 0,08 | ||||
| 2025-04-18 | 13F | Edge Financial Advisors LLC | 0 | −100,00 | 0 | |||||
| 2025-07-14 | 13F | Sowell Financial Services LLC | 0 | −100,00 | 0 | −100,00 | ||||
| 2025-07-14 | 13F | AdvisorNet Financial, Inc | 540 | 0,00 | 35 | 2,94 | ||||
| 2025-07-21 | 13F | TFG Advisers LLC | 11 627 | −4,15 | 756 | −2,33 | ||||
| 2025-08-13 | 13F | Per Stirling Capital Management, LLC. | 4 379 | −15,46 | 285 | −13,94 | ||||
| 2025-08-13 | 13F | Flow Traders U.s. Llc | 0 | −100,00 | 0 | |||||
| 2025-07-30 | 13F | LGT Financial Advisors LLC | 1 | −80,00 | 0 | |||||
| 2025-07-09 | 13F | Breakwater Capital Group | 98 757 | −22,86 | 6 422 | −21,38 | ||||
| 2025-07-17 | 13F | Smith Anglin Financial, LLC | 38 963 | −60,67 | 2 534 | −59,93 | ||||
| 2025-08-14 | 13F | Wiley Bros.-aintree Capital, Llc | 6 524 | −8,25 | 424 | −6,19 | ||||
| 2025-08-11 | 13F | Principal Securities, Inc. | 46 | 0,00 | 3 | −33,33 | ||||
| 2025-07-29 | 13F | Private Trust Co Na | 1 015 | 1 620,34 | 66 | 2 100,00 | ||||
| 2025-08-06 | 13F | AE Wealth Management LLC | 1 986 | −28,10 | 129 | −26,70 | ||||
| 2025-07-28 | 13F | Mutual Advisors, LLC | 13 487 | 0,96 | 908 | 12,94 | ||||
| 2025-07-30 | 13F | D.a. Davidson & Co. | 21 451 | −23,34 | 1 395 | −21,90 | ||||
| 2025-08-14 | 13F | Ausdal Financial Partners, Inc. | 4 543 | −57,82 | 295 | −57,06 | ||||
| 2025-07-25 | 13F | Cwm, Llc | 150 310 | −40,78 | 10 | −43,75 | ||||
| 2025-08-05 | 13F | ALM First Financial Advisors, LLC | 236 286 | 0,00 | 14 492 | 1,93 | ||||
| 2025-08-07 | 13F | 49 Wealth Management, Llc | 0 | −100,00 | 0 | |||||
| 2025-07-17 | 13F | Nelson, Van Denburg & Campbell Wealth Management Group, LLC | 4 619 | 0,00 | 300 | 2,04 | ||||
| 2025-08-14 | 13F | Royal Bank Of Canada | 79 330 | −51,60 | 5 159 | −50,66 | ||||
| 2025-08-01 | 13F | MorganRosel Wealth Management, LLC | 3 269 | 0,00 | 213 | 1,92 | ||||
| 2025-08-12 | 13F | Jpmorgan Chase & Co | 422 | −18,53 | 27 | −18,18 | ||||
| 2025-08-14 | 13F | CoreCap Advisors, LLC | 120 | 0,00 | 8 | 0,00 | ||||
| 2025-08-15 | 13F | CI Private Wealth, LLC | 5 524 | 359 | ||||||
| 2025-07-18 | 13F | Truist Financial Corp | 44 445 | 8,58 | 2 890 | 10,69 | ||||
| 2025-08-14 | 13F | Money Concepts Capital Corp | 9 100 | 5,53 | 592 | 7,45 | ||||
| 2025-07-29 | 13F | International Assets Investment Management, Llc | 0 | −100,00 | 0 | |||||
| 2025-08-13 | 13F | Northwestern Mutual Wealth Management Co | 307 825 | −26,66 | 20 018 | −25,25 | ||||
| 2025-08-05 | 13F | Sigma Planning Corp | 22 097 | 10,17 | 1 437 | 12,28 | ||||
| 2025-07-25 | 13F | Total Clarity Wealth Management, Inc. | 3 630 | 0,00 | 236 | −4,84 | ||||
| 2025-08-14 | 13F | Bank Of America Corp /de/ | 240 931 | −2,40 | 15 668 | −0,51 | ||||
| 2025-08-14 | 13F | Snowden Capital Advisors LLC | 15 180 | −0,52 | 987 | 1,44 | ||||
| 2025-08-06 | 13F | ZEGA Investments, LLC | 8 170 | 27,90 | 531 | 30,47 | ||||
| 2025-07-30 | 13F | Brookstone Capital Management | 102 198 | 33,41 | 6 646 | 35,97 | ||||
| 2025-07-22 | 13F | Belpointe Asset Management LLC | 17 569 | 39,79 | 1 143 | 42,57 | ||||
| 2025-08-11 | 13F | Comprehensive Wealth Management, LLC | 6 943 | −44,97 | 452 | −43,91 | ||||
| 2025-08-13 | 13F | StoneX Group Inc. | 4 635 | 0,46 | 301 | 2,38 | ||||
| 2025-07-29 | 13F | Manchester Financial Inc | 27 050 | −44,36 | 1 759 | −43,28 | ||||
| 2025-08-13 | 13F | Cambria Investment Management, L.P. | 81 862 | −7,64 | 5 323 | −7,75 | ||||
| 2025-08-08 | 13F | Financial Gravity Companies, Inc. | 1 500 | 129,71 | 98 | 120,45 | ||||
| 2025-08-12 | 13F | Global Retirement Partners, LLC | 173 | 0,00 | 11 | 0,00 | ||||
| 2025-08-14 | 13F | CoreFirst Bank & Trust | 70 | 5 | ||||||
| 2025-05-19 | 13F/A | Jane Street Group, Llc | 0 | −100,00 | 0 | −100,00 | ||||
| 2025-08-14 | 13F | Comerica Bank | 3 073 | −25,76 | 200 | −24,62 | ||||
| 2025-08-08 | 13F | Thoroughbred Financial Services, Llc | 8 460 | −81,89 | 1 | −100,00 | ||||
| 2025-08-13 | 13F | MONECO Advisors, LLC | 102 480 | −18,55 | 6 664 | −16,97 |