Grundläggande statistik
| Institutionella ägare | 166 total, 166 long only, 0 short only, 0 long/short - change of 5,06% MRQ |
| Genomsnittlig portföljallokering | 0.2043 % - change of −0,13% MRQ |
| Institutionella aktier (lång) | 7 021 185 (ex 13D/G) - change of −0,12MM shares −1,71% MRQ |
| Institutionellt värde (lång) | $ 570 455 USD ($1000) |
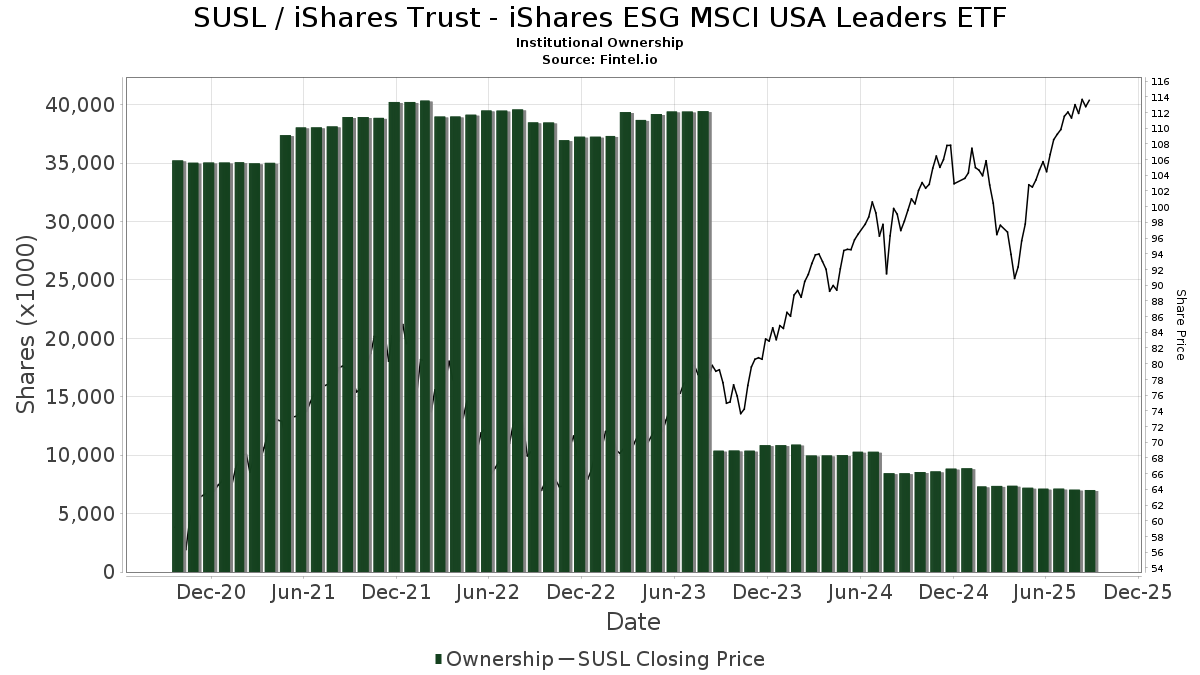
Institutionellt ägande och aktieägare
iShares Trust - iShares ESG MSCI USA Leaders ETF (US:SUSL) har 166 Institutionella ägare och aktieägare som har lämnat in 13D/G- eller 13F-formulär till Securities Exchange Commission (SEC). Dessa institut innehar totalt 7,021,185 aktier. Största aktieägare inkluderar Bank of Italy, Mercer Global Advisors Inc /adv, Envestnet Asset Management Inc, Jpmorgan Chase & Co, Fmr Llc, Royal Bank Of Canada, Wealth Enhancement Advisory Services, Llc, Creative Planning, Allworth Financial LP, and Ellevest, Inc. .
iShares Trust - iShares ESG MSCI USA Leaders ETF (NasdaqGM:SUSL) Institutionell ägarstruktur visar institutioners och fonders nuvarande positioner i företaget, samt de senaste förändringarna i positionernas storlek. Större aktieägare kan vara enskilda investerare, fonder, hedgefonder eller institutioner. Bilaga 13D visar att investeraren äger (eller ägde) mer än 5% av företaget och avser (eller avsåg) att aktivt eftersträva en förändring av affärsstrategin. Schedule 13G indikerar en passiv investering på över 5%.
The share price as of September 19, 2025 is 115,94 / share. Previously, on September 23, 2024, the share price was 101,02 / share. This represents an increase of 14,77% over that period.
Fondsentimentets poäng
Fondsentimentet poängen(fka Ägarackumulation-poäng) visar vilka aktier som är mest köpta av fonder. Det är resultatet av en sofistikerad kvantitativ flerfaktormodell som identifierar företag med de högsta nivåerna av institutionell ackumulering. Poängsättningsmodellen använder en kombination av den totala ökningen av redovisade ägare, förändringarna i portföljallokeringarna för dessa ägare och andra mått. Siffran sträcker sig från 0 till 100, där högre siffror indikerar en högre nivå av ackumulering i förhållande till sina konkurrenter, och 50 är genomsnittet.
Uppdateringsfrekvens: Dagligen
Se Ownership Explorer, som innehåller en lista över de högst rankade företagen.
AI+ Ask Fintel’s AI assistant about iShares Trust - iShares ESG MSCI USA Leaders ETF.
Thinking of good questions…
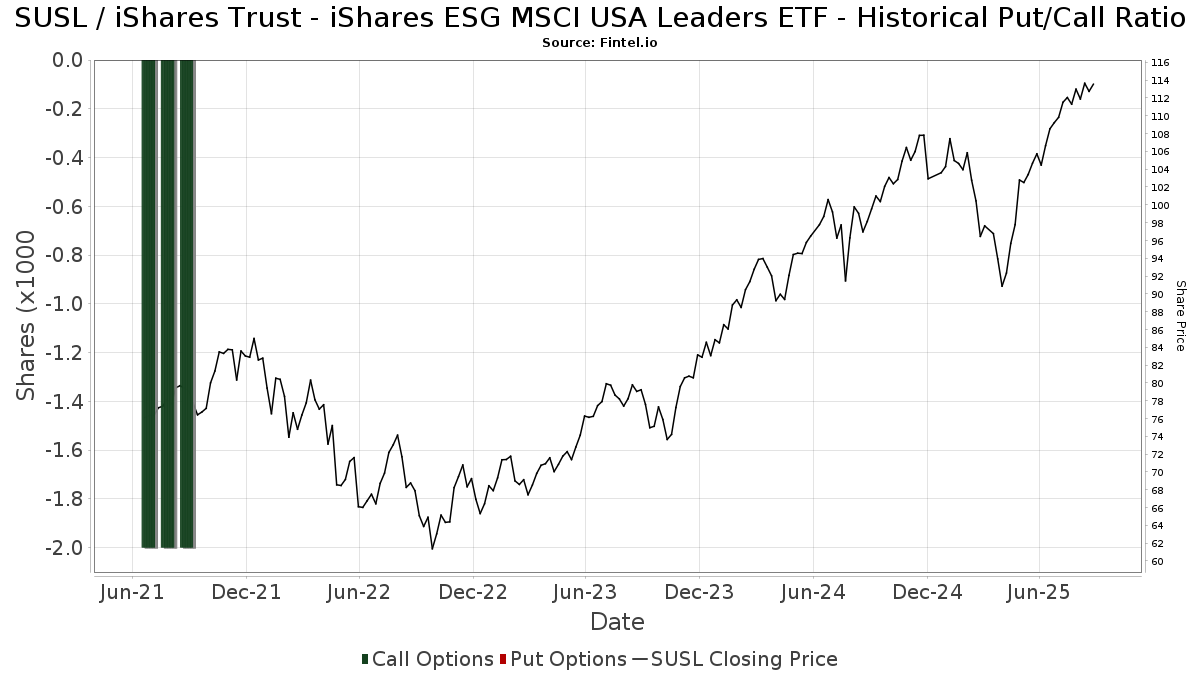
Institutionell sälj/köp-kvot
Förutom att rapportera vanliga eget kapital- och skuldemissioner måste institutioner med mer än 100MM tillgångar under förvaltning också avslöja sina innehav av sälj- och köpoptioner. Eftersom säljoptioner i allmänhet indikerar ett negativt sentiment och köpoptioner indikerar ett positivt sentiment, kan vi få en uppfattning om det övergripande institutionella sentimentet genom att plotta förhållandet mellan säljoptioner och köpoptioner. Diagrammet till höger visar det historiska förhållandet mellan sälj- och köpoptioner för detta instrument.
Genom att använda sälj/köp-kvoten som en indikator på aktieägarnas sentiment undviker man en av de största bristerna med att använda det totala institutionella ägandet, nämligen att en betydande del av de förvaltade tillgångarna investeras passivt för att följa index. Passivt förvaltade fonder köper vanligtvis inte optioner, så indikatorn för sälj/köp-kvoten ger en bättre bild av stämningen i aktivt förvaltade fonder.
13F- och NPORT-arkiveringar
Detaljer om 13F-arkiveringar är gratis. Detaljer om NP-arkiveringar kräver ett premiummedlemskap. Gröna rader indikerar nya positioner. Röda rader indikerar stängda positioner. Klicka på länk symbolen för att se hela transaktionshistoriken.
Uppgradera
för att låsa upp premiumdata och exportera till Excel ![]() .
.
| Fil Datum | Källa | Investerare | Typ | Genomsnittligt pris (beräknat) |
Aktier | Δ Aktier (%) |
Rapporterat värde (1000 USD) |
Δ Värde (%) |
Portföljallokering (%) |
|
|---|---|---|---|---|---|---|---|---|---|---|
| 2025-08-01 | 13F | Milestone Asset Management Group, LLC | 2 247 | 0,04 | 243 | 13,02 | ||||
| 2025-08-05 | 13F | Ellevest, Inc. | 127 760 | 7,06 | 13 843 | 21,07 | ||||
| 2025-04-30 | 13F | Stratos Wealth Advisors, LLC | 0 | −100,00 | 0 | |||||
| 2025-08-01 | 13F | Biltmore Family Office, LLC | 8 | 1 | ||||||
| 2025-07-28 | 13F | Harbour Investments, Inc. | 267 | −50,00 | 29 | −45,10 | ||||
| 2025-08-05 | 13F | GHP Investment Advisors, Inc. | 320 | 0,00 | 35 | 13,33 | ||||
| 2025-07-24 | 13F | Blair William & Co/il | 8 135 | 0,17 | 881 | 13,24 | ||||
| 2025-08-13 | 13F | Flow Traders U.s. Llc | 0 | −100,00 | 0 | |||||
| 2025-08-11 | 13F | Retirement Capital Strategies | 1 911 | −81,81 | 207 | −79,50 | ||||
| 2025-08-07 | 13F | Allworth Financial LP | 189 743 | 0,74 | 20 559 | 16,01 | ||||
| 2025-07-22 | 13F | Relyea Zuckerberg Hanson LLC | 4 719 | 511 | ||||||
| 2025-08-14 | 13F | Mml Investors Services, Llc | 2 859 | 4,96 | 0 | |||||
| 2025-08-08 | 13F | United Asset Strategies, Inc. | 4 378 | 4,19 | 474 | 17,91 | ||||
| 2025-07-21 | 13F | Keystone Financial Group, Inc. | 525 | 0,00 | 58 | 13,73 | ||||
| 2025-08-15 | 13F | Captrust Financial Advisors | 4 893 | 0,00 | 530 | 13,25 | ||||
| 2025-07-11 | 13F | Compass Ion Advisors, LLC | 9 600 | 0,00 | 1 040 | 13,17 | ||||
| 2025-08-08 | 13F | Glassman Wealth Services | 172 | 0,00 | 19 | 12,50 | ||||
| 2025-07-29 | 13F | Novare Capital Management Llc | 3 885 | 0,00 | 421 | 12,90 | ||||
| 2025-07-31 | 13F | GenTrust, LLC | 5 675 | 0,00 | 615 | 13,08 | ||||
| 2025-07-14 | 13F | Sweeney & Michel, Llc | 3 853 | 2,17 | 421 | 29,94 | ||||
| 2025-07-16 | 13F | Perigon Wealth Management, LLC | 5 622 | −5,46 | 609 | 7,03 | ||||
| 2025-08-06 | 13F | Agf Management Ltd | 3 600 | −14,29 | 390 | −2,99 | ||||
| 2025-08-14 | 13F | Clarity Asset Management, Inc. | 1 476 | 0,07 | 160 | 12,77 | ||||
| 2025-07-15 | 13F | Bfsg, Llc | 28 416 | 0,04 | 3 079 | 13,12 | ||||
| 2025-05-14 | 13F | Humankind Investments LLC | 0 | −100,00 | 0 | |||||
| 2025-08-11 | 13F | HHM Wealth Advisors, LLC | 137 | 0,00 | 15 | 7,69 | ||||
| 2025-07-15 | 13F | Bank of Italy | 1 653 185 | 0,00 | 179 | 13,29 | ||||
| 2025-08-11 | 13F | Landaas & Co /wi /adv | 3 154 | 0,00 | 342 | 13,25 | ||||
| 2025-05-13 | 13F | High Falls Advisors, Inc | 0 | −100,00 | 0 | |||||
| 2025-08-08 | 13F | Principal Financial Group Inc | 73 469 | −19,52 | 7 960 | −8,99 | ||||
| 2025-08-14 | 13F | Goldman Sachs Group Inc | 53 621 | 55,88 | 5 810 | 76,30 | ||||
| 2025-07-30 | 13F | Strategic Blueprint, LLC | 3 065 | −7,26 | 332 | 5,06 | ||||
| 2025-07-11 | 13F | Ridgeline Wealth, LLC | 2 560 | −10,68 | 277 | 1,09 | ||||
| 2025-07-16 | 13F | Evergreen Private Wealth LLC | 1 422 | 0,00 | 154 | 13,24 | ||||
| 2025-08-06 | 13F | Commonwealth Equity Services, Llc | 57 611 | 3,89 | 6 | 20,00 | ||||
| 2025-07-22 | 13F | Vested Financial Planning, LLC | 3 940 | 0,00 | 427 | 13,00 | ||||
| 2025-08-11 | 13F | Aptus Capital Advisors, LLC | 42 460 | −0,14 | 4 601 | 12,94 | ||||
| 2025-08-04 | 13F | Horizon Wealth Management, LLC | 2 666 | 1,29 | 289 | 14,29 | ||||
| 2025-04-15 | 13F | Noble Wealth Management PBC | 180 | 0,00 | 17 | −5,56 | ||||
| 2025-05-12 | 13F | Townsquare Capital Llc | 0 | −100,00 | 0 | |||||
| 2025-08-13 | 13F | Cerity Partners LLC | 2 845 | −28,41 | 308 | −18,95 | ||||
| 2025-07-29 | 13F | Stratos Wealth Partners, LTD. | 7 687 | −3,41 | 833 | 9,19 | ||||
| 2025-07-28 | 13F | Aries Wealth Management | 5 976 | 0,00 | 648 | 13,11 | ||||
| 2025-08-06 | 13F | SNS Financial Group, LLC | 12 010 | 10,08 | 1 301 | 24,50 | ||||
| 2025-07-11 | 13F | Diversified Trust Co | 2 561 | −16,99 | 277 | −6,10 | ||||
| 2025-08-14 | 13F | Susquehanna International Group, Llp | 0 | −100,00 | 0 | |||||
| 2025-07-25 | 13F | Cwm, Llc | 850 | 22,48 | 0 | |||||
| 2025-08-01 | 13F | Envestnet Asset Management Inc | 688 104 | −1,26 | 74 556 | 11,66 | ||||
| 2025-08-08 | 13F | Omega Financial Group, LLC | 22 327 | 0,50 | 2 419 | 13,67 | ||||
| 2025-04-22 | 13F | Veridan Wealth LLC | 3 203 | −16,93 | 307 | −23,31 | ||||
| 2025-08-06 | 13F | Walkner Condon Financial Advisors LLC | 19 217 | −1,32 | 2 082 | 11,64 | ||||
| 2025-07-09 | 13F | Affinity Capital Advisors, LLC | 10 581 | −2,66 | 1 146 | 14,14 | ||||
| 2025-08-11 | 13F | Wealthspire Advisors, LLC | 12 019 | 0,12 | 1 302 | 13,22 | ||||
| 2025-08-13 | 13F | EverSource Wealth Advisors, LLC | 4 445 | −2,33 | 482 | 10,32 | ||||
| 2025-08-14 | 13F | Aqr Capital Management Llc | 2 771 | 300 | ||||||
| 2025-08-08 | 13F | Wealth Alliance | 4 832 | −24,36 | 524 | −14,54 | ||||
| 2025-07-11 | 13F | Bond & Devick Financial Network, Inc. | 13 229 | 5,41 | 1 433 | 19,22 | ||||
| 2025-07-29 | 13F | Angeles Wealth Management, Llc | 567 | 61 | ||||||
| 2025-08-04 | 13F | Mayflower Financial Advisors, LLC | 3 222 | 0,00 | 349 | 13,31 | ||||
| 2025-04-17 | 13F | Janney Montgomery Scott LLC | 0 | −100,00 | 0 | |||||
| 2025-07-23 | 13F | Friedenthal Financial | 7 880 | −44,86 | 854 | −37,69 | ||||
| 2025-07-28 | 13F | Cypress Wealth Services, LLC | 13 574 | −0,12 | 1 471 | 12,90 | ||||
| 2025-07-09 | 13F | Fragasso Group Inc. | 4 620 | 9,76 | 501 | 24,07 | ||||
| 2025-08-12 | 13F | Steward Partners Investment Advisory, Llc | 16 387 | 0,00 | 1 776 | 13,06 | ||||
| 2025-08-14 | 13F | Citadel Advisors Llc | 7 874 | 6,51 | 853 | 20,48 | ||||
| 2025-07-25 | 13F | Lodestar Private Asset Management Llc | 2 325 | 0,26 | 252 | 13,06 | ||||
| 2025-08-14 | 13F | Royal Bank Of Canada | 362 592 | 3,45 | 39 287 | 16,99 | ||||
| 2025-08-08 | 13F | Your Advocates Ltd., LLP | 1 049 | 0,10 | 114 | 13,00 | ||||
| 2025-07-17 | 13F | One Wealth Advisors, LLC | 64 996 | −7,37 | 7 042 | 4,76 | ||||
| 2025-07-10 | 13F | Orgel Wealth Management, LLC | 13 770 | 3,88 | 1 492 | 17,40 | ||||
| 2025-08-15 | 13F | CI Private Wealth, LLC | 23 602 | 1,97 | 2 557 | 15,34 | ||||
| 2025-08-12 | 13F | Manchester Capital Management LLC | 3 | 0,00 | 0 | |||||
| 2025-07-23 | 13F | Sax Wealth Advisors, Llc | 24 945 | −4,29 | 2 703 | 8,21 | ||||
| 2025-05-05 | 13F | Pictet Asset Management Holding SA | 0 | −100,00 | 0 | |||||
| 2025-08-14 | 13F | Fmr Llc | 388 794 | −7,61 | 42 126 | 4,48 | ||||
| 2025-07-24 | 13F | IFP Advisors, Inc | 2 916 | 213,89 | 316 | 343,66 | ||||
| 2025-08-12 | 13F | Proequities, Inc. | 0 | 0 | ||||||
| 2025-07-10 | 13F | Redhawk Wealth Advisors, Inc. | 4 205 | 7,27 | 456 | 21,33 | ||||
| 2025-08-07 | 13F | Shared Vision Wealth Group LLC | 4 479 | −0,24 | 499 | 15,81 | ||||
| 2025-08-07 | 13F | Capitol Family Office, Inc. | 164 | 0,00 | 18 | 13,33 | ||||
| 2025-07-22 | 13F | Firethorn Wealth Partners, Llc | 4 203 | −0,19 | 455 | 12,90 | ||||
| 2025-07-29 | 13F | Elevation Capital Advisory, LLC | 0 | −100,00 | 0 | |||||
| 2025-08-08 | 13F | Avantax Advisory Services, Inc. | 8 180 | 3,40 | 886 | 17,04 | ||||
| 2025-08-05 | 13F | Cherry Tree Wealth Management, LLC | 98 | 0,00 | 11 | 11,11 | ||||
| 2025-07-22 | 13F | DT Investment Partners, LLC | 587 | 10,75 | 64 | 26,00 | ||||
| 2025-08-12 | 13F | Ci Investments Inc. | 3 519 | −35,06 | 0 | |||||
| 2025-07-15 | 13F | Armis Advisers, LLC | 2 555 | 0,00 | 277 | 13,11 | ||||
| 2025-04-17 | 13F | Dynamic Advisor Solutions LLC | 0 | −100,00 | 0 | |||||
| 2025-08-14 | 13F | Wharton Business Group, LLC | 3 875 | 0,00 | 0 | |||||
| 2025-07-15 | 13F | RVW Wealth, LLC | 5 632 | 80,98 | 610 | 104,70 | ||||
| 2025-07-29 | 13F | Gladwyn Financial Advisors, Inc. | 128 | 14 | ||||||
| 2025-08-12 | 13F | Martin Worley Group | 8 744 | 0,00 | 947 | 13,14 | ||||
| 2025-08-14 | 13F | Two Sigma Investments, Lp | 9 500 | 1 029 | ||||||
| 2025-08-14 | 13F | Bank Of America Corp /de/ | 59 741 | −7,26 | 6 473 | 4,88 | ||||
| 2025-08-14 | 13F | Stifel Financial Corp | 8 197 | 3,76 | 888 | 17,46 | ||||
| 2025-08-06 | 13F | Csenge Advisory Group | 8 022 | −9,84 | 831 | 2,47 | ||||
| 2025-08-14 | 13F | Mariner, LLC | 4 237 | 6,22 | 459 | 20,16 | ||||
| 2025-07-21 | 13F | Cliftonlarsonallen Wealth Advisors, Llc | 80 013 | −2,17 | 8 669 | 10,64 | ||||
| 2025-08-11 | 13F | One Capital Management, LLC | 7 760 | 0,00 | 841 | 13,06 | ||||
| 2025-07-28 | 13F | WealthPlan Investment Management, LLC | 6 480 | 702 | ||||||
| 2025-07-31 | 13F | Cambridge Investment Research Advisors, Inc. | 9 718 | −5,43 | 1 | |||||
| 2025-07-17 | 13F | HB Wealth Management, LLC | 6 053 | −0,69 | 656 | 12,35 | ||||
| 2025-08-14 | 13F | CoreCap Advisors, LLC | 250 | 0,00 | 27 | 17,39 | ||||
| 2025-07-18 | 13F | Institute for Wealth Management, LLC. | 2 200 | 0,00 | 238 | 13,33 | ||||
| 2025-08-14 | 13F | Mercer Global Advisors Inc /adv | 794 658 | −1,91 | 86 101 | 10,93 | ||||
| 2025-08-15 | 13F | Tower Research Capital LLC (TRC) | 196 | −97,81 | 21 | −97,54 | ||||
| 2025-07-25 | 13F | We Are One Seven, LLC | 9 588 | −14,02 | 1 039 | −2,81 | ||||
| 2025-08-08 | 13F | Larson Financial Group LLC | 474 | 78,20 | 51 | 104,00 | ||||
| 2025-08-15 | 13F | Morgan Stanley | 3 374 | −84,93 | 366 | −82,98 | ||||
| 2025-07-14 | 13F | Park Avenue Securities Llc | 7 031 | 2,58 | 1 | |||||
| 2025-07-28 | 13F | JGP Wealth Management, LLC | 2 813 | 0,18 | 305 | 13,01 | ||||
| 2025-07-22 | 13F | Kickstand Ventures, Llc. | 19 372 | −7,33 | 2 099 | 4,80 | ||||
| 2025-08-14 | 13F | Keebeck Wealth Management, LLC | 15 261 | −1,02 | 1 654 | 11,92 | ||||
| 2025-08-06 | 13F | First Horizon Advisors, Inc. | 420 | 46 | ||||||
| 2025-07-22 | 13F | Duncan Williams Asset Management, LLC | 19 372 | 2 099 | ||||||
| 2025-08-07 | 13F | Nwam Llc | 2 436 | 0,00 | 273 | 16,74 | ||||
| 2025-08-11 | 13F | Citigroup Inc | 2 354 | −22,21 | 255 | −11,76 | ||||
| 2025-08-14 | 13F | UBS Group AG | 99 | −84,41 | 11 | −83,33 | ||||
| 2025-08-18 | 13F | Front Row Advisors LLC | 221 | 0,00 | 24 | 9,52 | ||||
| 2025-08-08 | 13F | Pnc Financial Services Group, Inc. | 985 | 35,30 | 107 | 53,62 | ||||
| 2025-08-11 | 13F | Private Advisor Group, LLC | 5 848 | 3,58 | 634 | 17,22 | ||||
| 2025-08-12 | 13F | Change Path, LLC | 3 301 | −9,29 | 358 | 2,59 | ||||
| 2025-07-10 | 13F | Wealth Enhancement Advisory Services, Llc | 241 388 | 0,50 | 26 425 | 14,83 | ||||
| 2025-08-07 | 13F | Resources Investment Advisors, LLC. | 78 194 | −10,18 | 8 472 | 1,57 | ||||
| 2025-07-18 | 13F | First Pacific Financial | 1 680 | 0,00 | 182 | 13,75 | ||||
| 2025-09-04 | 13F/A | Advisor Group Holdings, Inc. | 31 443 | −11,65 | 3 409 | −0,09 | ||||
| 2025-08-14 | 13F | Wells Fargo & Company/mn | 22 527 | 12,44 | 2 441 | 27,15 | ||||
| 2025-08-08 | 13F | Better Money Decisions, LLC | 2 812 | 0,25 | 305 | 13,43 | ||||
| 2025-07-09 | 13F | Beacon Financial Group | 5 443 | −6,25 | 590 | 5,94 | ||||
| 2025-08-15 | 13F | SkyView Investment Advisors, LLC | 4 764 | −2,26 | 1 | |||||
| 2025-07-18 | 13F | Marino, Stram & Associates Llc | 2 451 | 0,00 | 266 | 13,25 | ||||
| 2025-07-24 | 13F | Us Bancorp \de\ | 1 028 | 0,00 | 111 | 13,27 | ||||
| 2025-07-30 | 13F | Brookstone Capital Management | 18 312 | −6,76 | 1 984 | 5,48 | ||||
| 2025-07-16 | 13F | MKT Advisors LLC | 3 130 | 0,00 | 338 | 24,26 | ||||
| 2025-07-22 | 13F | Wealthcare Advisory Partners LLC | 7 538 | 11,64 | 817 | 26,32 | ||||
| 2025-08-07 | 13F | W Advisors, Llc | 68 193 | −2,95 | 7 389 | 9,76 | ||||
| 2025-07-29 | 13F | Horst & Graben Wealth Management LLC | 2 152 | 233 | ||||||
| 2025-08-08 | 13F | Firestone Capital Management | 2 815 | 0,14 | 305 | 13,01 | ||||
| 2025-07-11 | 13F | My Legacy Advisors, LLC | 9 025 | −2,92 | 990 | 11,12 | ||||
| 2025-07-22 | 13F | Apexium Financial, Lp | 4 509 | 34,76 | 489 | 52,50 | ||||
| 2025-08-12 | 13F | O'shaughnessy Asset Management, Llc | 7 243 | 0,00 | 785 | 13,13 | ||||
| 2025-08-01 | 13F | Zhang Financial LLC | 0 | −100,00 | 0 | |||||
| 2025-07-21 | 13F | Triad Wealth Partners, LLC | 2 050 | 222 | ||||||
| 2025-08-14 | 13F | Raymond James Financial Inc | 46 871 | 284,00 | 5 078 | 334,39 | ||||
| 2025-07-18 | 13F | PFG Investments, LLC | 4 806 | 0,17 | 521 | 13,29 | ||||
| 2025-08-13 | 13F | Northwestern Mutual Wealth Management Co | 22 546 | −0,79 | 2 443 | 12,17 | ||||
| 2025-07-24 | 13F | Robertson Stephens Wealth Management, LLC | 63 663 | −2,22 | 6 898 | 10,58 | ||||
| 2025-08-08 | 13F | Cetera Investment Advisers | 6 866 | 52,31 | 744 | 72,39 | ||||
| 2025-08-12 | 13F | Pathstone Holdings, LLC | 77 332 | 8 379 | ||||||
| 2025-07-23 | 13F | Values Added Financial LLC | 15 516 | 0,00 | 1 681 | 13,12 | ||||
| 2025-08-14 | 13F | Ieq Capital, Llc | 4 501 | 0,04 | 488 | 12,99 | ||||
| 2025-05-12 | 13F | Independent Advisor Alliance | 0 | −100,00 | 0 | |||||
| 2025-07-16 | 13F | BOS Asset Management, LLC | 2 872 | 0,00 | 311 | 13,09 | ||||
| 2025-08-12 | 13F | Jpmorgan Chase & Co | 460 643 | −4,82 | 49 911 | 7,64 | ||||
| 2025-04-21 | 13F | Kingswood Wealth Advisors, Llc | 0 | −100,00 | 0 | |||||
| 2025-08-14 | 13F | GWM Advisors LLC | 990 | 0,00 | 107 | 13,83 | ||||
| 2025-07-15 | 13F | Mather Group, Llc. | 17 252 | 5,10 | 1 869 | 18,89 | ||||
| 2025-08-08 | 13F | Creative Planning | 217 973 | −3,28 | 23 617 | 9,38 | ||||
| 2025-08-01 | 13F | Ashton Thomas Private Wealth, LLC | 15 759 | −0,04 | 1 707 | 13,05 | ||||
| 2025-08-13 | 13F | Balance Wealth, LLC | 3 747 | −4,92 | 406 | 7,43 | ||||
| 2025-07-10 | 13F | SK Wealth Management, LLC | 43 736 | 2,25 | 4 777 | 25,75 | ||||
| 2025-08-12 | 13F | LPL Financial LLC | 23 200 | 5,38 | 2 514 | 19,16 | ||||
| 2025-05-15 | 13F | Advisory Services Network, LLC | 0 | −100,00 | 0 | |||||
| 2025-08-14 | 13F | Integrated Wealth Concepts LLC | 43 930 | 0,53 | 4 760 | 13,69 | ||||
| 2025-05-12 | 13F | Regal Investment Advisors LLC | 0 | −100,00 | 0 | −100,00 | ||||
| 2025-07-23 | 13F | Bluestem Financial Advisors, Llc | 49 563 | −4,64 | 5 370 | 7,85 | ||||
| 2025-04-22 | 13F/A | NorthRock Partners, LLC | 0 | −100,00 | 0 | −100,00 | ||||
| 2025-07-10 | 13F | Charter Oak Capital Management, LLC | 6 240 | 0,00 | 676 | 13,23 | ||||
| 2025-08-14 | 13F | Obsido Oy | 11 647 | 2,93 | 1 262 | 16,33 | ||||
| 2025-08-14 | 13F | Financial Network Wealth Advisors LLC | 302 | −56,61 | 33 | −51,52 | ||||
| 2025-08-06 | 13F | SOUTH STATE Corp | 6 154 | 3,94 | 667 | 17,46 | ||||
| 2025-07-08 | 13F | Parallel Advisors, LLC | 2 763 | 0,00 | 299 | 13,26 | ||||
| 2025-08-12 | 13F | Global Retirement Partners, LLC | 217 | −37,10 | 24 | −34,29 | ||||
| 2025-07-15 | 13F | IMS Capital Management | 7 213 | 0,00 | 782 | 13,02 | ||||
| 2025-07-11 | 13F | Farther Finance Advisors, LLC | 13 927 | −8,07 | 1 509 | 3,36 | ||||
| 2025-08-14 | 13F | Ancora Advisors, LLC | 248 | 0,00 | 27 | 13,04 | ||||
| 2025-07-14 | 13F | Foster Group, Inc. | 3 495 | 6,43 | 379 | 20,38 | ||||
| 2025-08-14 | 13F | Sunbelt Securities, Inc. | 1 464 | 0,00 | 151 | 7,14 | ||||
| 2025-08-15 | 13F | Equitable Holdings, Inc. | 16 552 | 0,00 | 1 793 | 13,12 | ||||
| 2025-08-11 | 13F | CFS Investment Advisory Services, LLC | 16 194 | 0,73 | 2 | 0,00 | ||||
| 2025-08-13 | 13F | GeoWealth Management, LLC | 94 721 | −14,93 | 10 263 | −3,80 | ||||
| 2025-08-13 | 13F | Jones Financial Companies Lllp | 2 851 | 28,31 | 308 | 44,81 | ||||
| 2025-08-13 | 13F | Marshall Wace, Llp | 3 084 | 334 |
Other Listings
| CL:SUSL |