Grundläggande statistik
| Institutionella ägare | 173 total, 173 long only, 0 short only, 0 long/short - change of 2,37% MRQ |
| Genomsnittlig portföljallokering | 0.2883 % - change of 0,24% MRQ |
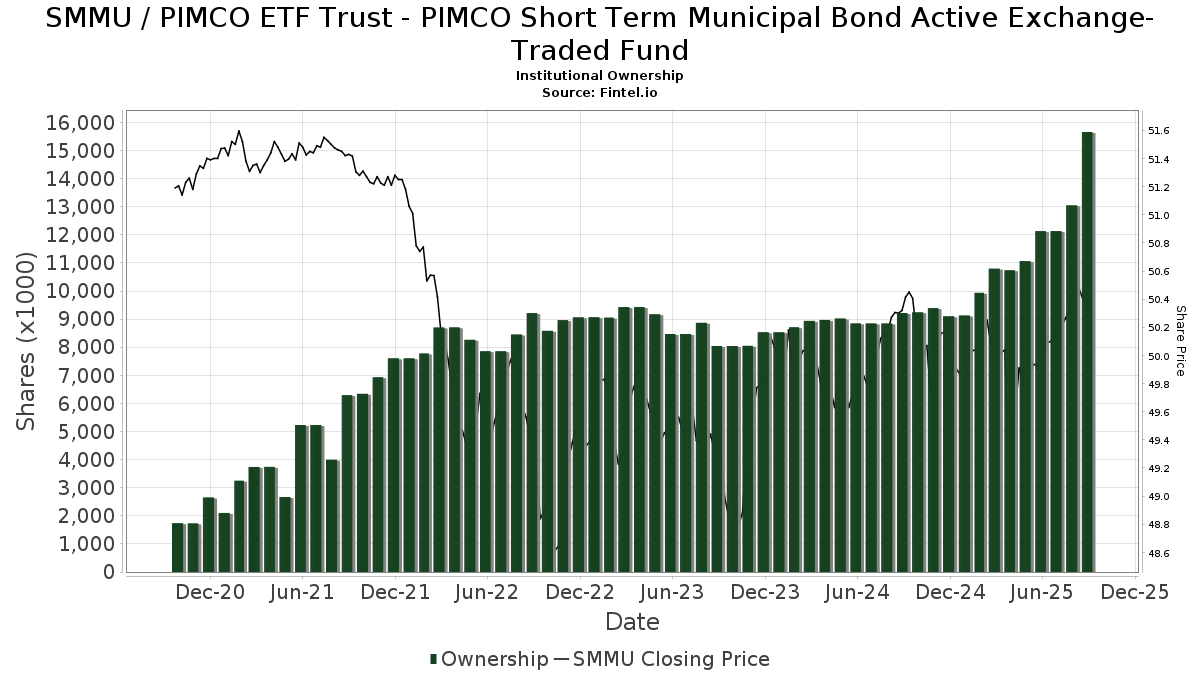
| Institutionella aktier (lång) | 15 659 884 (ex 13D/G) - change of 3,53MM shares 29,08% MRQ |
| Institutionellt värde (lång) | $ 749 317 USD ($1000) |
Institutionellt ägande och aktieägare
PIMCO ETF Trust - PIMCO Short Term Municipal Bond Active Exchange-Traded Fund (US:SMMU) har 173 Institutionella ägare och aktieägare som har lämnat in 13D/G- eller 13F-formulär till Securities Exchange Commission (SEC). Dessa institut innehar totalt 15,659,884 aktier. Största aktieägare inkluderar Morgan Stanley, Stonebridge Financial Group, LLC, Bank Of America Corp /de/, Jpmorgan Chase & Co, Wealth Enhancement Advisory Services, Llc, Cetera Investment Advisers, Sagespring Wealth Partners, Llc, Cwm, Llc, Captrust Financial Advisors, and LPL Financial LLC .
PIMCO ETF Trust - PIMCO Short Term Municipal Bond Active Exchange-Traded Fund (ARCA:SMMU) Institutionell ägarstruktur visar institutioners och fonders nuvarande positioner i företaget, samt de senaste förändringarna i positionernas storlek. Större aktieägare kan vara enskilda investerare, fonder, hedgefonder eller institutioner. Bilaga 13D visar att investeraren äger (eller ägde) mer än 5% av företaget och avser (eller avsåg) att aktivt eftersträva en förändring av affärsstrategin. Schedule 13G indikerar en passiv investering på över 5%.
The share price as of September 17, 2025 is 50,72 / share. Previously, on September 18, 2024, the share price was 50,41 / share. This represents an increase of 0,61% over that period.
Fondsentimentets poäng
Fondsentimentet poängen(fka Ägarackumulation-poäng) visar vilka aktier som är mest köpta av fonder. Det är resultatet av en sofistikerad kvantitativ flerfaktormodell som identifierar företag med de högsta nivåerna av institutionell ackumulering. Poängsättningsmodellen använder en kombination av den totala ökningen av redovisade ägare, förändringarna i portföljallokeringarna för dessa ägare och andra mått. Siffran sträcker sig från 0 till 100, där högre siffror indikerar en högre nivå av ackumulering i förhållande till sina konkurrenter, och 50 är genomsnittet.
Uppdateringsfrekvens: Dagligen
Se Ownership Explorer, som innehåller en lista över de högst rankade företagen.
Institutionell sälj/köp-kvot
Förutom att rapportera vanliga eget kapital- och skuldemissioner måste institutioner med mer än 100MM tillgångar under förvaltning också avslöja sina innehav av sälj- och köpoptioner. Eftersom säljoptioner i allmänhet indikerar ett negativt sentiment och köpoptioner indikerar ett positivt sentiment, kan vi få en uppfattning om det övergripande institutionella sentimentet genom att plotta förhållandet mellan säljoptioner och köpoptioner. Diagrammet till höger visar det historiska förhållandet mellan sälj- och köpoptioner för detta instrument.
Genom att använda sälj/köp-kvoten som en indikator på aktieägarnas sentiment undviker man en av de största bristerna med att använda det totala institutionella ägandet, nämligen att en betydande del av de förvaltade tillgångarna investeras passivt för att följa index. Passivt förvaltade fonder köper vanligtvis inte optioner, så indikatorn för sälj/köp-kvoten ger en bättre bild av stämningen i aktivt förvaltade fonder.
13F- och NPORT-arkiveringar
Detaljer om 13F-arkiveringar är gratis. Detaljer om NP-arkiveringar kräver ett premiummedlemskap. Gröna rader indikerar nya positioner. Röda rader indikerar stängda positioner. Klicka på länk symbolen för att se hela transaktionshistoriken.
Uppgradera
för att låsa upp premiumdata och exportera till Excel ![]() .
.
| Fil Datum | Källa | Investerare | Typ | Genomsnittligt pris (beräknat) |
Aktier | Δ Aktier (%) |
Rapporterat värde (1000 USD) |
Δ Värde (%) |
Portföljallokering (%) |
|
|---|---|---|---|---|---|---|---|---|---|---|
| 2025-08-08 | 13F | TD Capital Management LLC | 368 809 | 8,59 | 18 503 | 8,92 | ||||
| 2025-08-05 | 13F | Dynasty Wealth Management, Llc | 0 | −100,00 | 0 | |||||
| 2025-08-05 | 13F | BCGM Wealth Management, LLC | 24 372 | −8,28 | 1 223 | −8,05 | ||||
| 2025-08-07 | 13F | Allworth Financial LP | 97 905 | 15,12 | 4 912 | 16,18 | ||||
| 2025-07-31 | 13F | Whipplewood Advisors, LLC | 7 157 | 35 685,00 | 359 | 35,98 | ||||
| 2025-08-07 | 13F | Resources Investment Advisors, LLC. | 44 435 | −17,87 | 2 229 | −17,63 | ||||
| 2025-08-13 | 13F | MBM Wealth Consultants, LLC | 60 482 | 7,98 | 3 034 | 8,32 | ||||
| 2025-08-08 | 13F | Cetera Investment Advisers | 681 268 | −11,10 | 34 179 | −10,83 | ||||
| 2025-07-28 | 13F | Allianz Asset Management GmbH | 270 | −1,82 | 14 | 0,00 | ||||
| 2025-07-24 | 13F | Us Bancorp \de\ | 1 715 | 0,00 | 86 | 1,18 | ||||
| 2025-09-04 | 13F/A | Advisor Group Holdings, Inc. | 305 545 | 41,53 | 15 330 | 41,95 | ||||
| 2025-07-22 | 13F | Merit Financial Group, LLC | 6 525 | 327 | ||||||
| 2025-07-31 | 13F | Briaud Financial Planning, Inc | 302 | 0 | ||||||
| 2025-08-11 | 13F | Inspire Advisors, LLC | 31 394 | −6,04 | 1 575 | −5,75 | ||||
| 2025-07-30 | 13F | Onyx Bridge Wealth Group LLC | 10 656 | 0,69 | 535 | 0,95 | ||||
| 2025-07-29 | 13F | Mattson Financial Services, LLC | 0 | −100,00 | 0 | |||||
| 2025-07-24 | 13F | Blair William & Co/il | 1 620 | −25,07 | 81 | −25,00 | ||||
| 2025-08-14 | 13F | Royal Bank Of Canada | 5 521 | −71,26 | 277 | −71,18 | ||||
| 2025-07-22 | 13F | PUREfi Wealth, LLC | 0 | −100,00 | 0 | |||||
| 2025-08-14 | 13F | UBS Group AG | 74 991 | 9,59 | 3 762 | 9,94 | ||||
| 2025-08-12 | 13F | Financial Advocates Investment Management | 13 934 | 202,06 | 699 | 203,91 | ||||
| 2025-08-14 | 13F | Mml Investors Services, Llc | 25 600 | 7,81 | 1 | 0,00 | ||||
| 2025-07-14 | 13F | AdvisorNet Financial, Inc | 12 757 | −8,87 | 640 | −8,57 | ||||
| 2025-08-12 | 13F | J.w. Cole Advisors, Inc. | 8 311 | 417 | ||||||
| 2025-08-14 | 13F | Wiley Bros.-aintree Capital, Llc | 6 882 | 0,00 | 345 | 0,58 | ||||
| 2025-08-14 | 13F | Great Valley Advisor Group, Inc. | 39 716 | 1 993 | ||||||
| 2025-08-14 | 13F | Certified Advisory Corp | 47 013 | 2,97 | 2 359 | 3,29 | ||||
| 2025-07-21 | 13F | AIFG Consultants Ltd. | 42 341 | 0,34 | 2 124 | 0,66 | ||||
| 2025-08-14 | 13F | Beaird Harris Wealth Management, LLC | 13 400 | 41,28 | 672 | 41,77 | ||||
| 2025-04-28 | 13F | Dean, Jacobson Financial Services, LLC | 0 | −100,00 | 0 | |||||
| 2025-07-28 | 13F | Founders Grove Wealth Partners, Llc | 20 035 | 0,00 | 1 005 | 0,30 | ||||
| 2025-08-11 | 13F | Principal Securities, Inc. | 33 | 65,00 | 2 | |||||
| 2025-08-14 | 13F | Clarity Asset Management, Inc. | 0 | −100,00 | 0 | |||||
| 2025-08-14 | 13F | Stifel Financial Corp | 115 993 | −5,78 | 5 819 | −5,49 | ||||
| 2025-07-25 | 13F | Total Clarity Wealth Management, Inc. | 12 901 | −19,44 | 647 | −18,92 | ||||
| 2025-07-29 | 13F | Harbor Asset Planning, Inc. | 690 | 35 | ||||||
| 2025-08-04 | 13F | Creative Financial Designs Inc /adv | 618 | 0,65 | 31 | 0,00 | ||||
| 2025-08-14 | 13F | Warren Averett Asset Management, LLC | 50 017 | −5,91 | 2 509 | −5,64 | ||||
| 2025-08-14 | 13F | Jane Street Group, Llc | 38 787 | 183,12 | 1 946 | 183,94 | ||||
| 2025-08-14 | 13F | Bank Of America Corp /de/ | 1 052 638 | −1,68 | 52 811 | −1,38 | ||||
| 2025-08-08 | 13F | Crossmark Global Holdings, Inc. | 11 860 | −15,90 | 595 | −13,89 | ||||
| 2025-08-08 | 13F | Sittner & Nelson, Llc | 36 038 | 426,10 | 1 808 | 428,65 | ||||
| 2025-07-10 | 13F | Websterrogers Financial Advisors, Llc | 128 660 | 0,76 | 6 455 | 1,05 | ||||
| 2025-08-27 | 13F | Barnes Wealth Management Group, Inc | 7 187 | 0,67 | 361 | 0,84 | ||||
| 2025-08-13 | 13F | Virtue Capital Management, LLC | 0 | −100,00 | 0 | |||||
| 2025-08-13 | 13F | Rockport Wealth LLC | 5 000 | 251 | ||||||
| 2025-08-04 | 13F | Assetmark, Inc | 258 | 1,18 | 13 | 0,00 | ||||
| 2025-08-07 | 13F | Davis R M Inc | 68 370 | 3,86 | 3 430 | 4,19 | ||||
| 2025-08-12 | 13F | Pathstone Holdings, LLC | 0 | −100,00 | 0 | |||||
| 2025-07-15 | 13F | StoneCrest Wealth Management, Inc. | 29 721 | 0,00 | 1 491 | 0,34 | ||||
| 2025-08-14 | 13F | Wells Fargo & Company/mn | 257 033 | −6,44 | 12 895 | −6,16 | ||||
| 2025-07-17 | 13F | Clear Point Advisors Inc. | 7 755 | 0,65 | 389 | 1,04 | ||||
| 2025-07-08 | 13F | IAM Advisory, LLC | 32 254 | 0,63 | 1 618 | 0,94 | ||||
| 2025-04-23 | 13F | Econ Financial Services Corp | 0 | −100,00 | 0 | |||||
| 2025-08-13 | 13F | Baird Financial Group, Inc. | 8 359 | −0,98 | 419 | −0,71 | ||||
| 2025-08-19 | 13F | Newbridge Financial Services Group, Inc. | 579 | 29 | ||||||
| 2025-08-13 | 13F | Cerity Partners LLC | 76 692 | −69,39 | 3 848 | −69,30 | ||||
| 2025-07-02 | 13F | Crumly & Associates Inc. | 68 982 | −7,99 | 3 461 | −7,73 | ||||
| 2025-04-24 | 13F | Boyd Wealth Management, LLC | 0 | −100,00 | 0 | |||||
| 2025-07-30 | 13F | Crewe Advisors LLC | 234 | 12 | ||||||
| 2025-08-12 | 13F | Watchman Group, Inc. | 5 540 | 0,00 | 278 | 0,00 | ||||
| 2025-04-16 | 13F | New Century Financial Group, LLC | 0 | −100,00 | 0 | |||||
| 2025-04-22 | 13F/A | NorthRock Partners, LLC | 0 | −100,00 | 0 | |||||
| 2025-07-10 | 13F | Marshall Financial Group LLC | 5 100 | 0,00 | 256 | 0,00 | ||||
| 2025-08-07 | 13F | Sierra Ocean, Llc | 12 429 | 5,32 | 624 | 5,59 | ||||
| 2025-08-12 | 13F | Proequities, Inc. | 0 | 0 | ||||||
| 2025-07-29 | 13F | Quotient Wealth Partners, LLC | 145 958 | 11,50 | 7 323 | 11,84 | ||||
| 2025-08-04 | 13F | Bridgewealth Advisory Group, LLC | 4 527 | −13,94 | 227 | −13,69 | ||||
| 2025-07-11 | 13F | Farther Finance Advisors, LLC | 19 973 | 5,50 | 1 002 | 5,92 | ||||
| 2025-07-31 | 13F | CVA Family Office, LLC | 2 588 | 0,00 | 130 | 0,00 | ||||
| 2025-07-23 | 13F | L.K. Benson & Company, P.C. | 14 029 | 0,26 | 704 | 0,57 | ||||
| 2025-07-14 | 13F | GAMMA Investing LLC | 133 | −96,63 | 7 | −96,95 | ||||
| 2025-08-05 | 13F | American Institute for Advanced Investment Management, LLP | 4 500 | −19,64 | 226 | −19,64 | ||||
| 2025-07-30 | 13F | LifeWealth Investments, LLC | 35 056 | 0,00 | 1 759 | 0,29 | ||||
| 2025-08-15 | 13F | Captrust Financial Advisors | 524 063 | 13,56 | 26 292 | 13,90 | ||||
| 2025-08-14 | 13F | Raymond James Financial Inc | 192 627 | 12,83 | 9 664 | 13,17 | ||||
| 2025-08-26 | 13F/A | Thrivent Financial For Lutherans | 0 | −100,00 | 0 | −100,00 | ||||
| 2025-08-12 | 13F | Titleist Asset Management, Llc | 13 872 | 32,89 | 696 | 33,14 | ||||
| 2025-05-08 | 13F | LGT Financial Advisors LLC | 0 | −100,00 | 0 | |||||
| 2025-08-12 | 13F | Bedel Financial Consulting, Inc. | 13 184 | 0,00 | 661 | 0,76 | ||||
| 2025-07-15 | 13F | Signet Financial Management, Llc | 90 057 | −1,66 | 4 518 | −1,35 | ||||
| 2025-08-05 | 13F | Westside Investment Management, Inc. | 69 628 | −7,63 | 3 492 | −7,35 | ||||
| 2025-04-29 | 13F | Element Wealth, LLC | 0 | −100,00 | 0 | |||||
| 2025-07-22 | 13F | Unique Wealth, Llc | 69 866 | 82,92 | 3 505 | 83,51 | ||||
| 2025-07-18 | 13F | Magnolia Private Wealth, LLC | 0 | −100,00 | 0 | |||||
| 2025-07-28 | 13F | Axxcess Wealth Management, Llc | 96 870 | 34,86 | 4 860 | 35,27 | ||||
| 2025-08-15 | 13F | Kestra Advisory Services, LLC | 21 329 | −3,51 | 1 070 | −3,17 | ||||
| 2025-08-14 | 13F | Comerica Bank | 26 658 | 306,06 | 1 337 | 307,62 | ||||
| 2025-07-29 | 13F | Madison Wealth Partners, Inc | 4 569 | −20,88 | 229 | −20,49 | ||||
| 2025-08-15 | 13F | Equitable Holdings, Inc. | 16 458 | 20,55 | 826 | 20,97 | ||||
| 2025-08-11 | 13F | PAX Financial Group, LLC | 45 442 | −17,13 | 2 280 | −16,89 | ||||
| 2025-08-14 | 13F | Mercer Global Advisors Inc /adv | 14 644 | 0,00 | 735 | 0,27 | ||||
| 2025-07-22 | 13F | MBL Wealth, LLC | 22 422 | 2,15 | 1 125 | 2,46 | ||||
| 2025-08-05 | 13F | Key FInancial Inc | 989 | 0,00 | 50 | 0,00 | ||||
| 2025-05-15 | 13F/A | Orion Portfolio Solutions, LLC | 31 560 | −3,45 | 1 579 | −3,13 | ||||
| 2025-05-15 | 13F | Garden State Investment Advisory Services LLC | 0 | −100,00 | 0 | |||||
| 2025-08-08 | 13F | Bouchey Financial Group Ltd | 0 | −100,00 | 0 | |||||
| 2025-07-10 | 13F | Wealth Enhancement Advisory Services, Llc | 842 230 | 22,13 | 42 196 | 22,32 | ||||
| 2025-08-12 | 13F | Steward Partners Investment Advisory, Llc | 3 600 | 0,00 | 181 | 0,00 | ||||
| 2025-08-29 | 13F | Centaurus Financial, Inc. | 3 394 | 0 | ||||||
| 2025-08-07 | 13F | Sollinda Capital Management LLC | 4 060 | 0,00 | 204 | 0,00 | ||||
| 2025-08-07 | 13F | PFG Advisors | 9 969 | 10,42 | 500 | 10,86 | ||||
| 2025-07-22 | 13F | DAVENPORT & Co LLC | 26 540 | 31,56 | 1 332 | 31,91 | ||||
| 2025-07-17 | 13F | Beacon Capital Management, LLC | 109 | 0,93 | 5 | 0,00 | ||||
| 2025-07-09 | 13F | Biltmore Wealth Management, LLC | 430 018 | 4,91 | 21 574 | 5,22 | ||||
| 2025-07-15 | 13F | Oak Wealth Advisors LLC | 16 623 | 0,00 | 834 | 0,24 | ||||
| 2025-08-14 | 13F | Susquehanna International Group, Llp | 13 781 | 1,07 | 691 | 1,32 | ||||
| 2025-08-01 | 13F | Envestnet Asset Management Inc | 90 096 | 3,22 | 4 520 | 3,53 | ||||
| 2025-08-14 | 13F/A | Rockefeller Capital Management L.P. | 30 469 | 0,17 | 1 529 | 0,46 | ||||
| 2025-07-24 | 13F | IFP Advisors, Inc | 2 863 | 0,00 | 144 | 0,00 | ||||
| 2025-05-12 | 13F | Independent Advisor Alliance | 0 | −100,00 | 0 | |||||
| 2025-07-31 | 13F | Cambridge Investment Research Advisors, Inc. | 42 231 | −16,44 | 2 | 0,00 | ||||
| 2025-08-14 | 13F | Integrated Wealth Concepts LLC | 4 156 | 209 | ||||||
| 2025-07-22 | 13F | Private Wealth Group, LLC | 7 539 | −13,67 | 378 | −13,30 | ||||
| 2025-07-08 | 13F | Parallel Advisors, LLC | 27 | 1 | ||||||
| 2025-08-08 | 13F | Advyzon Investment Management, LLC | 9 722 | −11,96 | 488 | −11,78 | ||||
| 2025-07-10 | 13F | YHB Investment Advisors, Inc. | 39 857 | 14,99 | 2 000 | 15,35 | ||||
| 2025-08-18 | 13F | Geneos Wealth Management Inc. | 225 | 0,00 | 11 | 0,00 | ||||
| 2025-05-01 | 13F | Bleakley Financial Group, LLC | 0 | −100,00 | 0 | −100,00 | ||||
| 2025-07-24 | 13F | CarsonAllaria Wealth Management, Ltd. | 95 192 | 13,50 | 4 776 | 13,83 | ||||
| 2025-08-14 | 13F | Aqr Capital Management Llc | 0 | −100,00 | 0 | |||||
| 2025-07-14 | 13F | Abacus Planning Group, Inc. | 12 500 | 627 | ||||||
| 2025-08-12 | 13F | LPL Financial LLC | 448 317 | 7,56 | 22 492 | 7,89 | ||||
| 2025-05-12 | 13F | Fmr Llc | 0 | −100,00 | 0 | |||||
| 2025-08-06 | 13F | Commonwealth Equity Services, Llc | 43 323 | 2,72 | 2 | 0,00 | ||||
| 2025-07-09 | 13F | Inspirion Wealth Advisors, Llc | 40 758 | 0,00 | 2 045 | 0,29 | ||||
| 2025-08-14 | 13F | GWM Advisors LLC | 94 843 | 34,12 | 4 758 | 34,52 | ||||
| 2025-08-07 | 13F | Vise Technologies, Inc. | 5 639 | 283 | ||||||
| 2025-07-09 | 13F | Dynamic Advisor Solutions LLC | 32 322 | 0,07 | 1 622 | 0,37 | ||||
| 2025-08-06 | 13F | Atlantic Union Bankshares Corp | 1 330 | 67 | ||||||
| 2025-08-18 | 13F | Hollencrest Capital Management | 1 430 | 0,00 | 72 | 0,00 | ||||
| 2025-07-29 | 13F | Rodgers & Associates, LTD | 9 956 | −4,37 | 499 | −4,04 | ||||
| 2025-07-23 | 13F | Prime Capital Investment Advisors, LLC | 6 175 | 310 | ||||||
| 2025-07-07 | 13F | TruWealth Advisors, LLC | 5 056 | 0,12 | 254 | 0,40 | ||||
| 2025-07-09 | 13F | Summit Financial Consulting LLC | 11 918 | 9,33 | 598 | 9,54 | ||||
| 2025-08-08 | 13F | Avantax Advisory Services, Inc. | 41 349 | 19,39 | 2 074 | 19,75 | ||||
| 2025-08-07 | 13F | Kestra Private Wealth Services, Llc | 4 746 | −16,65 | 238 | −16,20 | ||||
| 2025-08-13 | 13F | Flow Traders U.s. Llc | 0 | −100,00 | 0 | |||||
| 2025-08-11 | 13F | Elequin Capital Lp | 45 444 | 2 280 | ||||||
| 2025-08-13 | 13F | Milestone Investment Advisors LLC | 32 477 | 35,55 | 1 629 | 35,98 | ||||
| 2025-05-09 | 13F | GeoWealth Management, LLC | 0 | −100,00 | 0 | |||||
| 2025-08-18 | 13F | Tyler-Stone Wealth Management | 28 620 | −1,31 | 1 436 | −1,03 | ||||
| 2025-07-29 | 13F | Stratos Wealth Partners, LTD. | 15 138 | 759 | ||||||
| 2025-07-24 | 13F | Capital Advisors, Ltd. LLC | 6 600 | 0,00 | 0 | |||||
| 2025-07-29 | 13F | Private Trust Co Na | 798 | 0,00 | 40 | 2,56 | ||||
| 2025-08-12 | 13F | Change Path, LLC | 8 182 | 1,35 | 411 | 1,74 | ||||
| 2025-08-27 | 13F/A | Brinker Capital Investments, LLC | 21 184 | −32,88 | 1 063 | −32,70 | ||||
| 2025-04-21 | 13F | Nelson, Van Denburg & Campbell Wealth Management Group, LLC | 0 | −100,00 | 0 | |||||
| 2025-07-25 | 13F | Envestnet Portfolio Solutions, Inc. | 5 430 | −14,04 | 272 | −13,65 | ||||
| 2025-08-12 | 13F | Jpmorgan Chase & Co | 893 294 | 123,59 | 44 817 | 124,26 | ||||
| 2025-05-15 | 13F | Mariner, LLC | 0 | −100,00 | 0 | |||||
| 2025-08-08 | 13F | Condor Capital Management | 259 726 | 0,41 | 13 030 | 0,72 | ||||
| 2025-07-08 | 13F | Gradient Investments LLC | 4 271 | 214 | ||||||
| 2025-08-14 | 13F | Family Management Corp | 4 626 | 232 | ||||||
| 2025-07-10 | 13F | Fortress Wealth Management, Inc. | 5 979 | 0,67 | 300 | 0,67 | ||||
| 2025-07-24 | 13F | Cyndeo Wealth Partners, LLC | 22 248 | −40,48 | 1 116 | −40,29 | ||||
| 2025-07-30 | 13F | Wbh Advisory Inc | 8 552 | 0,35 | 429 | 0,70 | ||||
| 2025-08-12 | 13F | Global Retirement Partners, LLC | 16 325 | 16 729,90 | 819 | 20 375,00 | ||||
| 2025-05-13 | 13F | Watts Gwilliam & Co., LLC | 4 013 | 0,00 | 201 | 0,00 | ||||
| 2025-07-28 | 13F | Sagespring Wealth Partners, Llc | 571 694 | 140,22 | 28 682 | 140,94 | ||||
| 2025-08-13 | 13F | Northwestern Mutual Wealth Management Co | 12 440 | 41,69 | 624 | 42,14 | ||||
| 2025-05-12 | 13F | Sandy Spring Bank | 1 293 | −71,99 | 65 | −72,17 | ||||
| 2025-08-04 | 13F | Premier Path Wealth Partners, LLC | 35 813 | −9,83 | 1 797 | −9,57 | ||||
| 2025-07-28 | 13F | Morris Financial Concepts, Inc. | 1 998 | 68,04 | 100 | 69,49 | ||||
| 2025-07-21 | 13F | Ameriflex Group, Inc. | 12 | 0,00 | 1 | |||||
| 2025-07-28 | 13F | Harbour Investments, Inc. | 6 038 | −0,43 | 303 | −0,33 | ||||
| 2025-08-15 | 13F | Morgan Stanley | 3 312 726 | 242,70 | 166 200 | 243,73 | ||||
| 2025-08-06 | 13F | AE Wealth Management LLC | 137 | −2,84 | 7 | −14,29 | ||||
| 2025-07-11 | 13F | LongView Wealth Management | 29 154 | −8,19 | 1 463 | −7,93 | ||||
| 2025-08-13 | 13F | Jones Financial Companies Lllp | 22 253 | 55,83 | 1 116 | 56,74 | ||||
| 2025-08-14 | 13F | Sunbelt Securities, Inc. | 474 | 0,00 | 24 | 0,00 | ||||
| 2025-08-13 | 13F | Kuhn & Co Investment Counsel | 14 495 | 6,56 | 727 | 6,91 | ||||
| 2025-08-06 | 13F | Golden State Wealth Management, LLC | 15 032 | 5,48 | 754 | 5,90 | ||||
| 2025-08-06 | 13F | Atlas Legacy Advisors, LLC | 5 702 | 37,70 | 286 | 38,16 | ||||
| 2025-07-24 | 13F | Stonebridge Financial Group, LLC | 1 063 477 | 69,37 | 53 355 | 69,87 | ||||
| 2025-08-14 | 13F | Visionary Wealth Advisors | 0 | −100,00 | 0 | |||||
| 2025-07-08 | 13F | Ehrlich Financial Group | 30 681 | −2,58 | 1 539 | −2,29 | ||||
| 2025-08-05 | 13F | Fourth Dimension Wealth, LLC | 132 | 0,00 | 7 | 0,00 | ||||
| 2025-08-14 | 13F | Objective Capital Management, LLC | 0 | −100,00 | 0 | |||||
| 2025-07-14 | 13F | ABLE Financial Group, LLC | 72 452 | 9,99 | 3 635 | 10,29 | ||||
| 2025-08-11 | 13F | Aptus Capital Advisors, LLC | 283 | 0,00 | 14 | 0,00 | ||||
| 2025-08-13 | 13F | SageView Advisory Group, LLC | 10 247 | −7,88 | 515 | −7,55 | ||||
| 2025-08-11 | 13F | CFS Investment Advisory Services, LLC | 60 162 | 3 | ||||||
| 2025-05-20 | 13F | Belpointe Asset Management LLC | 0 | −100,00 | 0 | |||||
| 2025-08-06 | 13F | Hallmark Capital Management Inc | 237 | −12,87 | 12 | −15,38 | ||||
| 2025-07-17 | 13F | Cyr Financial Inc. | 0 | −100,00 | 0 | −100,00 | ||||
| 2025-07-24 | 13F | Williams & Novak, LLC | 0 | −100,00 | 0 | |||||
| 2025-07-16 | 13F | Kooman & Associates | 12 500 | −10,10 | 627 | −9,78 | ||||
| 2025-07-30 | 13F | DecisionMap Wealth Management, LLC | 8 481 | 11,77 | 425 | 12,14 | ||||
| 2025-07-17 | 13F | Summit Financial Strategies, Inc. | 24 324 | 42,05 | 1 220 | 42,52 | ||||
| 2025-08-11 | 13F | HighTower Advisors, LLC | 28 783 | −1,88 | 1 444 | −1,57 | ||||
| 2025-08-05 | 13F | NewSquare Capital LLC | 26 172 | 2,28 | 1 313 | 2,66 | ||||
| 2025-07-07 | 13F | Capital Asset Advisory Services LLC | 96 459 | 29,40 | 4 832 | 29,52 | ||||
| 2025-08-12 | 13F | MAI Capital Management | 90 908 | 7,54 | 4 561 | 7,85 | ||||
| 2025-07-25 | 13F | Cwm, Llc | 540 386 | −23,01 | 27 | −22,86 | ||||
| 2025-07-29 | 13F | Kelman-Lazarov, Inc. | 119 464 | 13,89 | 5 994 | 14,24 | ||||
| 2025-08-13 | 13F | IAG Wealth Partners, LLC | 700 | 0,00 | 35 | 0,00 | ||||
| 2025-08-28 | NP | STMYX - Sierra Tactical Municipal Fund Class Special Shares | 41 300 | 2 072 | ||||||
| 2025-07-11 | 13F | Skyline Advisors, Inc. | 25 376 | −1,16 | 1 273 | −0,86 | ||||
| 2025-08-01 | 13F | Cedar Point Capital Partners, LLC | 62 003 | −7,18 | 3 111 | −6,91 | ||||
| 2025-08-11 | 13F | Private Advisor Group, LLC | 5 948 | 14,32 | 298 | 14,62 | ||||
| 2025-08-19 | 13F | Anchor Investment Management, LLC | 8 000 | 0,00 | 401 | 0,25 | ||||
| 2025-07-23 | 13F | Equitable Trust Co | 5 613 | 1,34 | 282 | 1,44 | ||||
| 2025-07-17 | 13F | Sage Rhino Capital Llc | 13 579 | −19,01 | 681 | −18,74 |