Grundläggande statistik
| Institutionella ägare | 156 total, 156 long only, 0 short only, 0 long/short - change of 0,65% MRQ |
| Genomsnittlig portföljallokering | 0.0740 % - change of −59,03% MRQ |
| Institutionella aktier (lång) | 6 318 220 (ex 13D/G) - change of −0,21MM shares −3,17% MRQ |
| Institutionellt värde (lång) | $ 341 018 USD ($1000) |
Institutionellt ägande och aktieägare
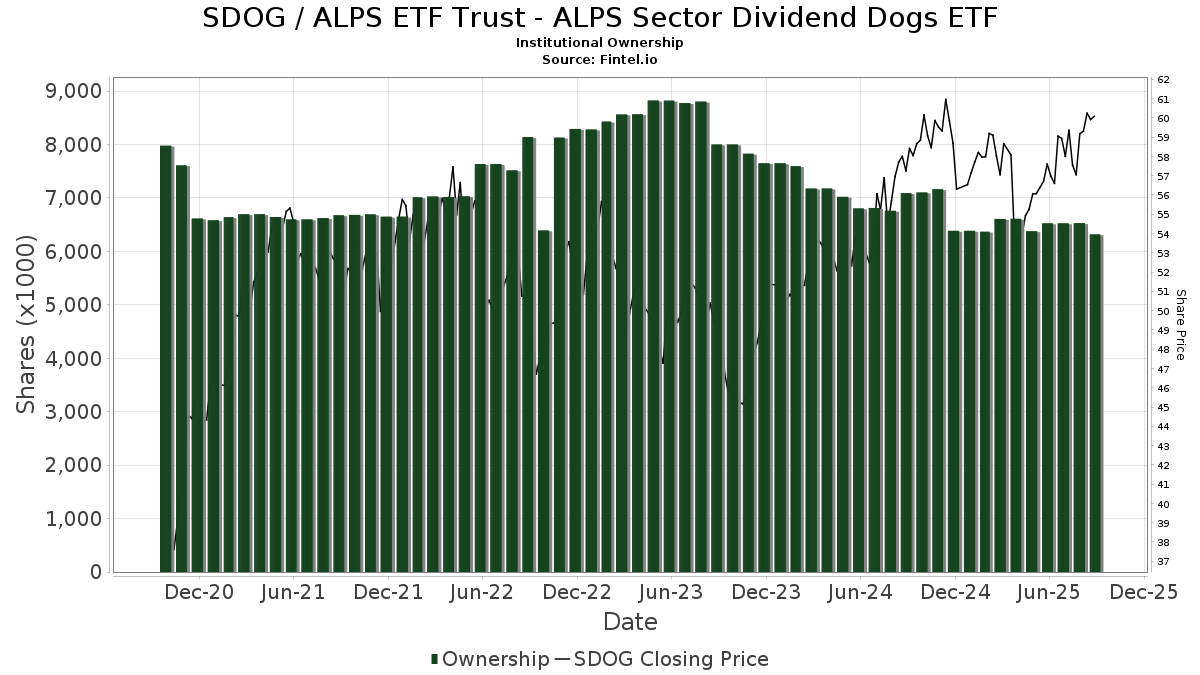
ALPS ETF Trust - ALPS Sector Dividend Dogs ETF (US:SDOG) har 156 Institutionella ägare och aktieägare som har lämnat in 13D/G- eller 13F-formulär till Securities Exchange Commission (SEC). Dessa institut innehar totalt 6,318,220 aktier. Största aktieägare inkluderar Bank Of America Corp /de/, Morgan Stanley, Wells Fargo & Company/mn, UBS Group AG, Raymond James Financial Inc, LPL Financial LLC, Commonwealth Equity Services, Llc, Royal Bank Of Canada, Janney Montgomery Scott LLC, and Capital Investment Counsel, LLC .
ALPS ETF Trust - ALPS Sector Dividend Dogs ETF (ARCA:SDOG) Institutionell ägarstruktur visar institutioners och fonders nuvarande positioner i företaget, samt de senaste förändringarna i positionernas storlek. Större aktieägare kan vara enskilda investerare, fonder, hedgefonder eller institutioner. Bilaga 13D visar att investeraren äger (eller ägde) mer än 5% av företaget och avser (eller avsåg) att aktivt eftersträva en förändring av affärsstrategin. Schedule 13G indikerar en passiv investering på över 5%.
The share price as of September 12, 2025 is 60,34 / share. Previously, on September 16, 2024, the share price was 58,47 / share. This represents an increase of 3,20% over that period.
Fondsentimentets poäng
Fondsentimentet poängen(fka Ägarackumulation-poäng) visar vilka aktier som är mest köpta av fonder. Det är resultatet av en sofistikerad kvantitativ flerfaktormodell som identifierar företag med de högsta nivåerna av institutionell ackumulering. Poängsättningsmodellen använder en kombination av den totala ökningen av redovisade ägare, förändringarna i portföljallokeringarna för dessa ägare och andra mått. Siffran sträcker sig från 0 till 100, där högre siffror indikerar en högre nivå av ackumulering i förhållande till sina konkurrenter, och 50 är genomsnittet.
Uppdateringsfrekvens: Dagligen
Se Ownership Explorer, som innehåller en lista över de högst rankade företagen.
Institutionell sälj/köp-kvot
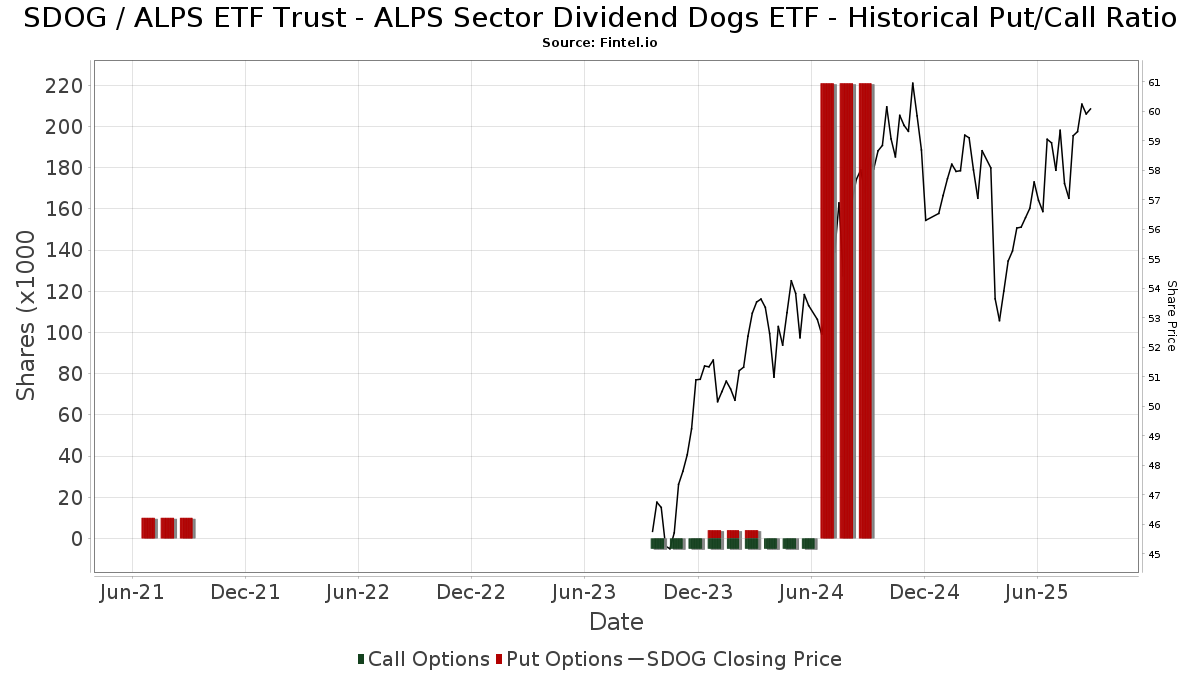
Förutom att rapportera vanliga eget kapital- och skuldemissioner måste institutioner med mer än 100MM tillgångar under förvaltning också avslöja sina innehav av sälj- och köpoptioner. Eftersom säljoptioner i allmänhet indikerar ett negativt sentiment och köpoptioner indikerar ett positivt sentiment, kan vi få en uppfattning om det övergripande institutionella sentimentet genom att plotta förhållandet mellan säljoptioner och köpoptioner. Diagrammet till höger visar det historiska förhållandet mellan sälj- och köpoptioner för detta instrument.
Genom att använda sälj/köp-kvoten som en indikator på aktieägarnas sentiment undviker man en av de största bristerna med att använda det totala institutionella ägandet, nämligen att en betydande del av de förvaltade tillgångarna investeras passivt för att följa index. Passivt förvaltade fonder köper vanligtvis inte optioner, så indikatorn för sälj/köp-kvoten ger en bättre bild av stämningen i aktivt förvaltade fonder.
13F- och NPORT-arkiveringar
Detaljer om 13F-arkiveringar är gratis. Detaljer om NP-arkiveringar kräver ett premiummedlemskap. Gröna rader indikerar nya positioner. Röda rader indikerar stängda positioner. Klicka på länk symbolen för att se hela transaktionshistoriken.
Uppgradera
för att låsa upp premiumdata och exportera till Excel ![]() .
.
| Fil Datum | Källa | Investerare | Typ | Genomsnittligt pris (beräknat) |
Aktier | Δ Aktier (%) |
Rapporterat värde (1000 USD) |
Δ Värde (%) |
Portföljallokering (%) |
|
|---|---|---|---|---|---|---|---|---|---|---|
| 2025-08-14 | 13F | Comerica Bank | 4 687 | −14,50 | 269 | −15,41 | ||||
| 2025-08-14 | 13F | GWM Advisors LLC | 14 059 | 175,45 | 808 | 172,97 | ||||
| 2025-08-08 | 13F | Hibernia Wealth Partners, LLC | 3 572 | 205 | ||||||
| 2025-08-11 | 13F | Principal Securities, Inc. | 300 | 17 | ||||||
| 2025-08-14 | 13F | Integrated Wealth Concepts LLC | 45 392 | 0,49 | 2 609 | −0,57 | ||||
| 2025-07-24 | 13F | Thompson Investment Management, Inc. | 3 829 | 282,90 | 220 | 279,31 | ||||
| 2025-08-14 | 13F | Wells Fargo & Company/mn | 652 872 | −3,28 | 37 526 | −4,31 | ||||
| 2025-08-13 | 13F | Lido Advisors, LLC | 4 638 | 0,00 | 267 | −1,12 | ||||
| 2025-07-16 | 13F | Signaturefd, Llc | 1 000 | 0,00 | 57 | −1,72 | ||||
| 2025-08-15 | 13F | Tower Research Capital LLC (TRC) | 1 646 | 24,70 | 95 | 23,68 | ||||
| 2025-04-15 | 13F | Transform Wealth, LLC | 4 841 | 21,72 | 281 | 25,45 | ||||
| 2025-07-10 | 13F | Wealth Enhancement Advisory Services, Llc | 74 826 | −5,06 | 4 425 | −3,34 | ||||
| 2025-08-11 | 13F | Private Advisor Group, LLC | 12 153 | 3,13 | 698 | 2,05 | ||||
| 2025-08-12 | 13F | O'shaughnessy Asset Management, Llc | 160 | 0,00 | 9 | 0,00 | ||||
| 2025-07-30 | 13F | Pittenger & Anderson Inc | 0 | −100,00 | 0 | |||||
| 2025-08-14 | 13F | Mariner, LLC | 13 171 | 17,55 | 757 | 16,28 | ||||
| 2025-07-30 | 13F | Whittier Trust Co Of Nevada Inc | 504 | 29 | ||||||
| 2025-08-12 | 13F | Tocqueville Asset Management L.p. | 0 | −100,00 | 0 | |||||
| 2025-08-13 | 13F | Russell Investments Group, Ltd. | 124 | 7 | ||||||
| 2025-08-11 | 13F | TD Waterhouse Canada Inc. | 505 | 0,00 | 30 | 0,00 | ||||
| 2025-07-23 | 13F | GGM Financials LLC | 6 187 | 356 | ||||||
| 2025-08-12 | 13F | Tradition Wealth Management, LLC | 7 781 | −0,09 | 447 | −1,11 | ||||
| 2025-08-13 | 13F | Keystone Financial Group | 6 209 | 0,00 | 357 | −1,11 | ||||
| 2025-08-06 | 13F | Prospera Financial Services Inc | 18 044 | 5,15 | 1 037 | 4,01 | ||||
| 2025-07-11 | 13F | SILVER OAK SECURITIES, Inc | 4 105 | −3,75 | 236 | −3,69 | ||||
| 2025-08-12 | 13F | Steward Partners Investment Advisory, Llc | 25 284 | −19,29 | 1 453 | −20,16 | ||||
| 2025-07-25 | 13F | Commonwealth Financial Services, LLC | 5 170 | 0,00 | 297 | −1,00 | ||||
| 2025-08-14 | 13F | Goldman Sachs Group Inc | 75 332 | 32,34 | 4 330 | 30,90 | ||||
| 2025-08-08 | 13F | Larson Financial Group LLC | 4 | 0,00 | 0 | |||||
| 2025-08-12 | 13F | J.w. Cole Advisors, Inc. | 8 137 | 0,74 | 468 | −0,43 | ||||
| 2025-05-08 | 13F | Plante Moran Financial Advisors, LLC | 0 | −100,00 | 0 | |||||
| 2025-05-08 | 13F | Hopwood Financial Services, Inc. | 0 | −100,00 | 0 | |||||
| 2025-08-18 | 13F/A | National Bank Of Canada /fi/ | 2 096 | 0,00 | 120 | −0,83 | ||||
| 2025-07-31 | 13F | Gill Capital Partners, Llc | 4 182 | 0,00 | 240 | −0,83 | ||||
| 2025-05-14 | 13F | Colonial Trust Co / SC | 0 | −100,00 | 0 | |||||
| 2025-07-31 | 13F | Cambridge Investment Research Advisors, Inc. | 26 678 | −0,57 | 2 | 0,00 | ||||
| 2025-07-23 | 13F | Madden Advisory Services, Inc. | 14 978 | −0,50 | 861 | −1,60 | ||||
| 2025-08-11 | 13F | United Capital Financial Advisers, Llc | 36 974 | −11,08 | 2 125 | −12,01 | ||||
| 2025-08-15 | 13F | Kestra Advisory Services, LLC | 30 169 | 2,76 | 1 734 | 1,70 | ||||
| 2025-09-04 | 13F/A | Advisor Group Holdings, Inc. | 38 300 | 11,47 | 2 201 | 10,27 | ||||
| 2025-08-18 | 13F | Goodman Advisory Group, LLC | 0 | −100,00 | 0 | |||||
| 2025-08-08 | 13F | Gts Securities Llc | 42 016 | 38,62 | 2 415 | 37,14 | ||||
| 2025-08-14 | 13F | Royal Bank Of Canada | 152 604 | −0,68 | 8 772 | −1,74 | ||||
| 2025-08-14 | 13F | Ameriprise Financial Inc | 40 082 | −26,83 | 2 305 | −27,59 | ||||
| 2025-08-05 | 13F | Bank Of Montreal /can/ | 500 | 0,00 | 29 | −3,45 | ||||
| 2025-08-12 | 13F | SRS Capital Advisors, Inc. | 797 | 0,00 | 46 | −2,17 | ||||
| 2025-07-08 | 13F | Nbc Securities, Inc. | 2 010 | 0,00 | 0 | |||||
| 2025-07-25 | 13F | Concurrent Investment Advisors, LLC | 14 504 | 834 | ||||||
| 2025-08-13 | 13F | Transce3nd, LLC | 423 | 24 | ||||||
| 2025-08-14 | 13F | Bank Of America Corp /de/ | 1 511 488 | 5,11 | 86 878 | 3,99 | ||||
| 2025-07-15 | 13F | Capstone Wealth Management Group LLC | 9 835 | −6,20 | 565 | −7,22 | ||||
| 2025-08-07 | 13F | Cahill Financial Advisors Inc | 18 110 | 6,06 | 1 041 | 4,84 | ||||
| 2025-08-14 | 13F | Parvin Asset Management, LLC | 7 521 | 0,00 | 432 | −0,92 | ||||
| 2025-07-17 | 13F | Janney Montgomery Scott LLC | 108 339 | −2,80 | 6 | 0,00 | ||||
| 2025-08-14 | 13F | Kovitz Investment Group Partners, LLC | 5 263 | 303 | ||||||
| 2025-04-22 | 13F | Castleview Partners, Llc | 0 | −100,00 | 0 | −100,00 | ||||
| 2025-07-30 | 13F | D.a. Davidson & Co. | 6 582 | 0,00 | 378 | −1,05 | ||||
| 2025-07-16 | 13F | Register Financial Advisors LLC | 1 050 | 0,00 | 60 | −1,64 | ||||
| 2025-08-11 | 13F | Citigroup Inc | 115 | 7 | ||||||
| 2025-08-13 | 13F | Northwestern Mutual Wealth Management Co | 8 531 | 24,11 | 490 | 22,81 | ||||
| 2025-08-14 | 13F | Federation des caisses Desjardins du Quebec | 27 377 | −0,18 | 1 574 | −1,26 | ||||
| 2025-08-14 | 13F | Susquehanna International Group, Llp | 10 009 | 575 | ||||||
| 2025-08-07 | 13F | Allworth Financial LP | 5 850 | −1,86 | 336 | 3,38 | ||||
| 2025-08-13 | 13F | Dana Investment Advisors, Inc. | 4 712 | 0,00 | 271 | −1,10 | ||||
| 2025-08-07 | 13F | Winthrop Capital Management, LLC | 27 | 0,00 | 0 | |||||
| 2025-07-09 | 13F | Christopher J. Hasenberg, Inc | 0 | −100,00 | 0 | |||||
| 2025-08-05 | 13F | Strategic Financial Concepts, LLC | 8 123 | 2,01 | 466 | 0,87 | ||||
| 2025-08-12 | 13F | Wood Tarver Financial Group, LLC | 600 | 0,00 | 0 | −100,00 | ||||
| 2025-07-28 | 13F | Harbour Investments, Inc. | 8 738 | −0,60 | 502 | −1,57 | ||||
| 2025-08-11 | 13F | Nations Financial Group Inc, /ia/ /adv | 7 165 | 0,07 | 412 | −1,20 | ||||
| 2025-07-28 | 13F | Virtus Wealth Solutions LLC | 6 187 | 0,98 | 356 | 0,00 | ||||
| 2025-08-04 | 13F | Assetmark, Inc | 250 | −66,49 | 14 | −67,44 | ||||
| 2025-08-13 | 13F | EverSource Wealth Advisors, LLC | 0 | −100,00 | 0 | |||||
| 2025-08-14 | 13F | Fmr Llc | 10 167 | 6,26 | 584 | 5,23 | ||||
| 2025-08-12 | 13F | MAI Capital Management | 500 | −20,00 | 29 | −22,22 | ||||
| 2025-08-04 | 13F | Joseph P. Lucia & Associates, LLC | 38 803 | −2,20 | 2 230 | −3,25 | ||||
| 2025-07-08 | 13F | Heartwood Wealth Advisors LLC | 0 | −100,00 | 0 | |||||
| 2025-08-14 | 13F | Wiley Bros.-aintree Capital, Llc | 19 985 | 1 149 | ||||||
| 2025-07-23 | 13F | Tyche Wealth Partners LLC | 5 769 | 0,00 | 332 | −1,19 | ||||
| 2025-08-13 | 13F | Summit Financial, LLC | 20 031 | 7,59 | 1 151 | 6,48 | ||||
| 2025-08-15 | 13F | Morgan Stanley | 1 044 863 | −2,33 | 60 058 | −3,38 | ||||
| 2025-08-14 | 13F | Snowden Capital Advisors LLC | 4 088 | 0,10 | 235 | −1,27 | ||||
| 2025-08-19 | 13F | Advisory Services Network, LLC | 3 930 | −34,01 | 224 | −35,07 | ||||
| 2025-08-14 | 13F/A | Rockefeller Capital Management L.P. | 48 399 | 8,00 | 2 782 | 6,84 | ||||
| 2025-07-14 | 13F | Cathy Pareto & Associates, Inc | 7 068 | 1,19 | 406 | 0,25 | ||||
| 2025-08-13 | 13F | Idaho Trust Bank | 0 | −100,00 | 0 | |||||
| 2025-08-13 | 13F | Baird Financial Group, Inc. | 16 119 | −2,88 | 927 | −3,94 | ||||
| 2025-05-15 | 13F | Guardian Wealth Advisors, Llc / Nc | 0 | −100,00 | 0 | |||||
| 2025-07-18 | 13F | Truist Financial Corp | 10 289 | −15,97 | 591 | −16,88 | ||||
| 2025-04-29 | 13F | Raleigh Capital Management Inc. | 0 | −100,00 | 0 | |||||
| 2025-07-24 | 13F | Costello Asset Management, INC | 26 | 0,00 | 1 | 0,00 | ||||
| 2025-08-08 | 13F | Pnc Financial Services Group, Inc. | 2 972 | 0,00 | 171 | −1,16 | ||||
| 2025-08-01 | 13F | Capital Investment Counsel, LLC | 82 606 | −0,10 | 4 748 | −1,17 | ||||
| 2025-08-14 | 13F | Raymond James Financial Inc | 302 057 | 3,26 | 17 362 | 2,15 | ||||
| 2025-08-11 | 13F | HighTower Advisors, LLC | 16 537 | −1,74 | 951 | −2,76 | ||||
| 2025-08-14 | 13F | Diversify Advisory Services, LLC | 5 282 | 0,00 | 307 | 6,23 | ||||
| 2025-05-09 | 13F | Pathway Financial Advisers, LLC | 0 | −100,00 | 0 | |||||
| 2025-08-14 | 13F | Mml Investors Services, Llc | 19 719 | −6,85 | 1 | 0,00 | ||||
| 2025-07-11 | 13F | Pinnacle Bancorp, Inc. | 6 700 | 0,00 | 385 | −1,03 | ||||
| 2025-07-18 | 13F | SOA Wealth Advisors, LLC. | 155 | 0,00 | 9 | −11,11 | ||||
| 2025-08-04 | 13F | Spire Wealth Management | 0 | −100,00 | 0 | |||||
| 2025-07-24 | 13F | Us Bancorp \de\ | 400 | 0,00 | 23 | −4,35 | ||||
| 2025-07-21 | 13F | Ameritas Advisory Services, LLC | 681 | 39 | ||||||
| 2025-07-07 | 13F | Thurston, Springer, Miller, Herd & Titak, Inc. | 330 | 0,00 | 19 | −5,26 | ||||
| 2025-07-29 | 13F | BKM Wealth Management, LLC | 10 627 | 2,68 | 611 | 1,50 | ||||
| 2025-08-04 | 13F | Integrity Alliance, Llc. | 0 | −100,00 | 0 | |||||
| 2025-07-16 | 13F | MKT Advisors LLC | 4 418 | 0,00 | 259 | 13,16 | ||||
| 2025-08-01 | 13F | Envestnet Asset Management Inc | 7 332 | −24,30 | 421 | −25,09 | ||||
| 2025-07-22 | 13F | Wealthcare Advisory Partners LLC | 8 305 | −5,95 | 477 | −7,02 | ||||
| 2025-08-05 | 13F | GHP Investment Advisors, Inc. | 91 | −37,24 | 5 | −37,50 | ||||
| 2025-08-12 | 13F | Del-Sette Capital Management, LLC | 58 722 | −81,53 | 3 375 | −81,73 | ||||
| 2025-08-13 | 13F | Truvestments Capital Llc | 17 | 0,00 | 1 | |||||
| 2025-07-29 | 13F | Ballast, Inc. | 38 803 | 2 230 | ||||||
| 2025-07-24 | 13F | IFP Advisors, Inc | 500 | 0,00 | 29 | 16,67 | ||||
| 2025-07-25 | 13F | Apollon Wealth Management, LLC | 21 900 | −15,67 | 1 259 | −16,58 | ||||
| 2025-08-14 | 13F | JPL Wealth Management, LLC | 46 820 | 1,39 | 2 691 | 0,30 | ||||
| 2025-07-23 | 13F | Tcfg Wealth Management, Llc | 5 547 | 0,00 | 319 | −1,24 | ||||
| 2025-08-14 | 13F | Citadel Advisors Llc | 8 421 | 102,18 | 484 | 100,83 | ||||
| 2025-08-14 | 13F | UBS Group AG | 312 394 | 1,64 | 17 956 | 0,56 | ||||
| 2025-07-25 | 13F | Stephens Consulting, LLC | 174 | 0,00 | 10 | 0,00 | ||||
| 2025-08-15 | 13F | Captrust Financial Advisors | 7 228 | −0,29 | 415 | −1,43 | ||||
| 2025-08-06 | 13F | Simmons Bank | 3 683 | 0,00 | 212 | −0,94 | ||||
| 2025-08-15 | 13F | First Heartland Consultants, Inc. | 4 655 | 2,53 | 268 | 1,52 | ||||
| 2025-08-12 | 13F | CIBC Private Wealth Group, LLC | 3 760 | 0,00 | 216 | 14,29 | ||||
| 2025-07-17 | 13F | Beacon Capital Management, LLC | 137 | 0,74 | 8 | 0,00 | ||||
| 2025-08-05 | 13F | Key FInancial Inc | 1 098 | 0,00 | 63 | 0,00 | ||||
| 2025-04-15 | 13F | Noble Wealth Management PBC | 156 | 0,00 | 9 | 12,50 | ||||
| 2025-08-13 | 13F | Jones Financial Companies Lllp | 12 378 | 52,66 | 707 | 52,04 | ||||
| 2025-04-16 | 13F | BTS Asset Management, Inc. | 0 | −100,00 | 0 | |||||
| 2025-08-12 | 13F | LPL Financial LLC | 252 140 | 4,15 | 14 493 | 3,04 | ||||
| 2025-06-10 | 13F | Birchbrook, Inc. | 0 | −100,00 | 0 | −100,00 | ||||
| 2025-08-06 | 13F | Golden State Wealth Management, LLC | 143 | 0,70 | 8 | 0,00 | ||||
| 2025-08-07 | 13F | Kestra Private Wealth Services, Llc | 6 854 | −0,22 | 394 | −1,50 | ||||
| 2025-08-13 | 13F | Beacon Pointe Advisors, LLC | 5 518 | −1,55 | 317 | −2,46 | ||||
| 2025-04-21 | 13F | Well Done, LLC | 0 | −100,00 | 0 | |||||
| 2025-08-06 | 13F | Convergence Financial, LLC | 4 889 | 0,00 | 281 | −1,06 | ||||
| 2025-08-12 | 13F | Global Retirement Partners, LLC | 115 | −67,05 | 7 | −68,42 | ||||
| 2025-08-08 | 13F | Cetera Investment Advisers | 46 518 | −3,02 | 2 674 | −4,06 | ||||
| 2025-08-08 | 13F | Meridian Wealth Management, LLC | 48 019 | 1,46 | 2 760 | 0,40 | ||||
| 2025-08-14 | 13F | Money Concepts Capital Corp | 35 299 | −2,93 | 2 029 | −3,98 | ||||
| 2025-07-17 | 13F | Albion Financial Group /ut | 884 | 1,03 | 51 | 0,00 | ||||
| 2025-08-14 | 13F | Warren Averett Asset Management, LLC | 4 602 | 1,32 | 265 | 0,38 | ||||
| 2025-07-09 | 13F | Central Valley Advisors, Llc | 4 792 | 0,00 | 275 | −1,08 | ||||
| 2025-07-21 | 13F | DHJJ Financial Advisors, Ltd. | 11 | 0,00 | 1 | |||||
| 2025-08-06 | 13F | AE Wealth Management LLC | 52 | 0,00 | 3 | 0,00 | ||||
| 2025-08-14 | 13F | Aspen Grove Capital, LLC | 5 750 | 0,00 | 331 | −1,20 | ||||
| 2025-08-08 | 13F | Creative Planning | 8 385 | 0,12 | 482 | −1,03 | ||||
| 2025-07-22 | 13F | Wealthcare Capital Partners, LLC | 8 272 | 0,00 | 475 | −1,04 | ||||
| 2025-08-07 | 13F | Sierra Ocean, Llc | 1 087 | 0,00 | 62 | −1,59 | ||||
| 2025-08-14 | 13F | Stifel Financial Corp | 60 569 | 1,56 | 3 481 | 0,49 | ||||
| 2025-08-08 | 13F | Hudock, Inc. | 4 285 | 0,00 | 246 | −1,20 | ||||
| 2025-08-11 | 13F | Rothschild Investment Llc | 1 750 | 0,00 | 101 | −0,99 | ||||
| 2025-07-16 | 13F | ORG Partners LLC | 750 | 0,00 | 44 | 0,00 | ||||
| 2025-07-31 | 13F/A | Avion Wealth | 248 | −25,75 | 0 | |||||
| 2025-07-25 | 13F | Atria Wealth Solutions, Inc. | 15 562 | −1,31 | 913 | −0,44 | ||||
| 2025-08-13 | 13F | Great Diamond Partners, LLC | 0 | −100,00 | 0 | |||||
| 2025-08-12 | 13F | AlphaCore Capital LLC | 210 | 12 | ||||||
| 2025-05-19 | 13F/A | Jane Street Group, Llc | 0 | −100,00 | 0 | −100,00 | ||||
| 2025-07-18 | 13F | PFG Investments, LLC | 7 998 | −21,50 | 460 | −22,34 | ||||
| 2025-07-31 | 13F | Oppenheimer & Co Inc | 3 573 | 0,48 | 205 | −0,49 | ||||
| 2025-08-12 | 13F | Proequities, Inc. | 0 | 0 | ||||||
| 2025-08-18 | 13F | Geneos Wealth Management Inc. | 2 851 | 38,40 | 164 | 36,97 | ||||
| 2025-08-14 | 13F | Ancora Advisors, LLC | 6 069 | 0,00 | 349 | −1,14 | ||||
| 2025-07-29 | 13F | Private Trust Co Na | 4 165 | 0,00 | 239 | −0,83 | ||||
| 2025-08-06 | 13F | Commonwealth Equity Services, Llc | 222 906 | −8,12 | 13 | −14,29 | ||||
| 2025-08-12 | 13F | Jpmorgan Chase & Co | 819 | −71,17 | 47 | −71,52 | ||||
| 2025-07-14 | 13F | Sweeney & Michel, Llc | 7 820 | 0,89 | 461 | 17,65 | ||||
| 2025-08-07 | 13F | PFG Advisors | 6 130 | −59,27 | 352 | −59,73 | ||||
| 2025-07-28 | 13F | Cypress Wealth Services, LLC | 17 979 | 0,68 | 1 033 | −0,39 | ||||
| 2025-08-05 | 13F | Tiaa Trust, National Association | 4 870 | 3,35 | 280 | 2,20 | ||||
| 2025-05-15 | 13F | Rockport Wealth LLC | 0 | −100,00 | 0 | |||||
| 2025-08-12 | 13F | one8zero8, LLC | 195 | 0,00 | 11 | 0,00 | ||||
| 2025-08-19 | 13F | Asset Dedication, LLC | 0 | −100,00 | 0 | |||||
| 2025-08-26 | 13F/A | Thrivent Financial For Lutherans | 6 794 | 0 | ||||||
| 2025-07-08 | 13F | Parallel Advisors, LLC | 500 | 0,00 | 29 | −3,45 | ||||
| 2025-04-23 | 13F | Creative Financial Designs Inc /adv | 0 | −100,00 | 0 | |||||
| 2025-07-09 | 13F | Dynamic Advisor Solutions LLC | 69 789 | 0,85 | 4 011 | −0,22 | ||||
| 2025-05-14 | 13F | Summit Financial Wealth Advisors, LLC | 10 957 | 14,41 | 637 | 15,22 | ||||
| 2025-05-12 | 13F | Kohmann Bosshard Financial Services, LLC | 0 | −100,00 | 0 | |||||
| 2025-08-05 | 13F | Sage Capital Management, LLC | 28 592 | 0,85 | 1 643 | −0,24 | ||||
| 2025-08-14 | 13F | CoreCap Advisors, LLC | 1 106 | 0,09 | 64 | −1,56 | ||||
| 2025-07-07 | 13F | Investors Research Corp | 17 044 | −5,57 | 980 | −6,58 |