Grundläggande statistik
| Institutionella ägare | 157 total, 154 long only, 2 short only, 1 long/short - change of −0,63% MRQ |
| Genomsnittlig portföljallokering | -0.0670 % - change of 127,66% MRQ |
| Institutionella aktier (lång) | 21 410 781 (ex 13D/G) - change of −0,61MM shares −2,75% MRQ |
| Institutionellt värde (lång) | $ 311 117 USD ($1000) |
Institutionellt ägande och aktieägare
Global X Funds - Global X Russell 2000 Covered Call ETF (US:RYLD) har 157 Institutionella ägare och aktieägare som har lämnat in 13D/G- eller 13F-formulär till Securities Exchange Commission (SEC). Dessa institut innehar totalt 21,969,588 aktier. Största aktieägare inkluderar LPL Financial LLC, Morgan Stanley, Bank Of America Corp /de/, TCG Advisory Services, LLC, Ameriprise Financial Inc, UBS Group AG, Wells Fargo & Company/mn, Raymond James Financial Inc, AlphaStar Capital Management, LLC, and Brookstone Capital Management .
Global X Funds - Global X Russell 2000 Covered Call ETF (ARCA:RYLD) Institutionell ägarstruktur visar institutioners och fonders nuvarande positioner i företaget, samt de senaste förändringarna i positionernas storlek. Större aktieägare kan vara enskilda investerare, fonder, hedgefonder eller institutioner. Bilaga 13D visar att investeraren äger (eller ägde) mer än 5% av företaget och avser (eller avsåg) att aktivt eftersträva en förändring av affärsstrategin. Schedule 13G indikerar en passiv investering på över 5%.
The share price as of September 12, 2025 is 15,26 / share. Previously, on September 16, 2024, the share price was 16,25 / share. This represents a decline of 6,09% over that period.

Fondsentimentets poäng
Fondsentimentet poängen(fka Ägarackumulation-poäng) visar vilka aktier som är mest köpta av fonder. Det är resultatet av en sofistikerad kvantitativ flerfaktormodell som identifierar företag med de högsta nivåerna av institutionell ackumulering. Poängsättningsmodellen använder en kombination av den totala ökningen av redovisade ägare, förändringarna i portföljallokeringarna för dessa ägare och andra mått. Siffran sträcker sig från 0 till 100, där högre siffror indikerar en högre nivå av ackumulering i förhållande till sina konkurrenter, och 50 är genomsnittet.
Uppdateringsfrekvens: Dagligen
Se Ownership Explorer, som innehåller en lista över de högst rankade företagen.
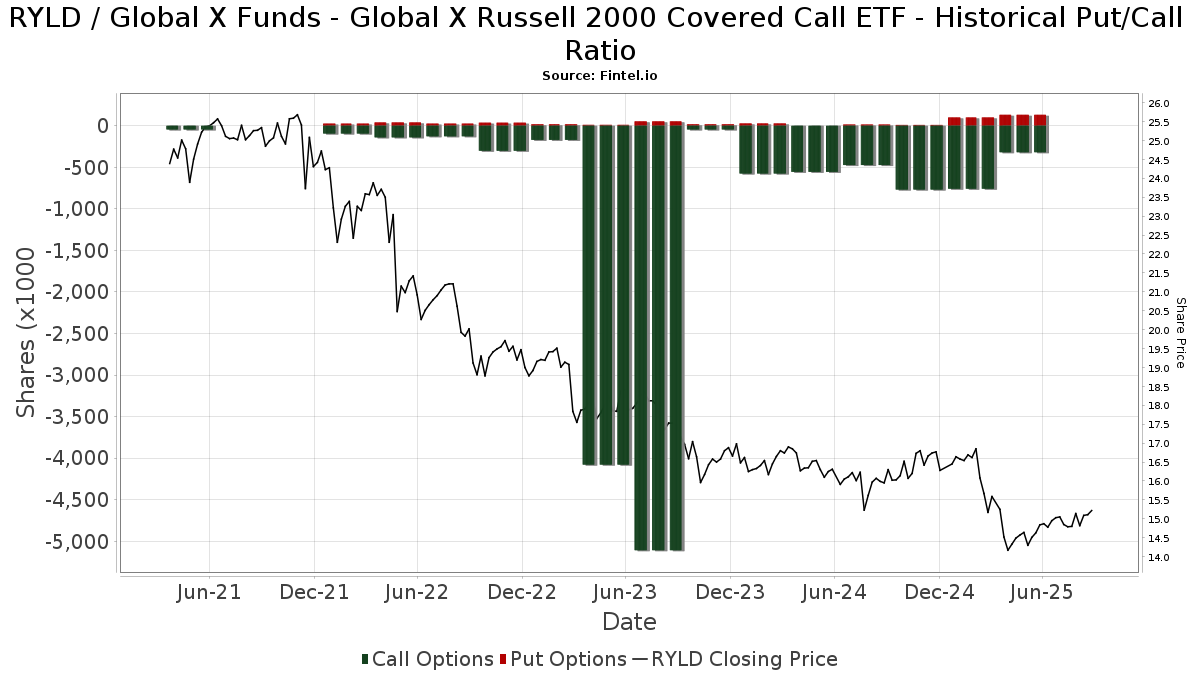
Institutionell sälj/köp-kvot
Förutom att rapportera vanliga eget kapital- och skuldemissioner måste institutioner med mer än 100MM tillgångar under förvaltning också avslöja sina innehav av sälj- och köpoptioner. Eftersom säljoptioner i allmänhet indikerar ett negativt sentiment och köpoptioner indikerar ett positivt sentiment, kan vi få en uppfattning om det övergripande institutionella sentimentet genom att plotta förhållandet mellan säljoptioner och köpoptioner. Diagrammet till höger visar det historiska förhållandet mellan sälj- och köpoptioner för detta instrument.
Genom att använda sälj/köp-kvoten som en indikator på aktieägarnas sentiment undviker man en av de största bristerna med att använda det totala institutionella ägandet, nämligen att en betydande del av de förvaltade tillgångarna investeras passivt för att följa index. Passivt förvaltade fonder köper vanligtvis inte optioner, så indikatorn för sälj/köp-kvoten ger en bättre bild av stämningen i aktivt förvaltade fonder.
13F- och NPORT-arkiveringar
Detaljer om 13F-arkiveringar är gratis. Detaljer om NP-arkiveringar kräver ett premiummedlemskap. Gröna rader indikerar nya positioner. Röda rader indikerar stängda positioner. Klicka på länk symbolen för att se hela transaktionshistoriken.
Uppgradera
för att låsa upp premiumdata och exportera till Excel ![]() .
.
| Fil Datum | Källa | Investerare | Typ | Genomsnittligt pris (beräknat) |
Aktier | Δ Aktier (%) |
Rapporterat värde (1000 USD) |
Δ Värde (%) |
Portföljallokering (%) |
|
|---|---|---|---|---|---|---|---|---|---|---|
| 2025-08-11 | 13F | Private Advisor Group, LLC | 101 598 | 1,04 | 1 515 | −0,26 | ||||
| 2025-08-13 | 13F | Renaissance Technologies Llc | 41 100 | −82,52 | 613 | −82,76 | ||||
| 2025-07-18 | 13F | PFG Investments, LLC | 70 606 | 3,74 | 1 053 | 2,43 | ||||
| 2025-08-12 | 13F | Jpmorgan Chase & Co | 154 | −67,37 | 2 | −71,43 | ||||
| 2025-07-09 | 13F | Dynamic Advisor Solutions LLC | 22 090 | −40,68 | 329 | −41,46 | ||||
| 2025-08-14 | 13F/A | Rockefeller Capital Management L.P. | 73 315 | −17,91 | 1 093 | −18,92 | ||||
| 2025-08-26 | NP | MCTOX - Modern Capital Tactical Opportunities Fund Class A Shares | 0 | −100,00 | 0 | −100,00 | ||||
| 2025-08-14 | 13F | Qube Research & Technologies Ltd | 1 578 | 24 | ||||||
| 2025-08-01 | 13F | Pasadena Private Wealth, LLC | 18 200 | −8,08 | 271 | −9,06 | ||||
| 2025-08-07 | 13F | Kestra Private Wealth Services, Llc | 0 | −100,00 | 0 | −100,00 | ||||
| 2025-08-18 | 13F/A | National Bank Of Canada /fi/ | 5 | 0,00 | 0 | |||||
| 2025-07-31 | 13F | Wealthfront Advisers Llc | 21 412 | 70,68 | 319 | 68,78 | ||||
| 2025-07-25 | 13F | Concurrent Investment Advisors, LLC | 46 912 | 24,77 | 699 | 23,28 | ||||
| 2025-07-14 | 13F | Capital CS Group, LLC | 23 819 | 355 | ||||||
| 2025-08-12 | 13F | RiverFront Investment Group, LLC | 26 571 | −75,31 | 396 | −75,63 | ||||
| 2025-08-12 | 13F | Founders Financial Alliance, LLC | 8 829 | 13,57 | 132 | 11,97 | ||||
| 2025-09-09 | 13F | NWF Advisory Services Inc. | 92 436 | −9,85 | 1 378 | −10,98 | ||||
| 2025-07-31 | 13F | Cambridge Investment Research Advisors, Inc. | 139 716 | −47,10 | 2 | −33,33 | ||||
| 2025-08-14 | 13F | Mml Investors Services, Llc | 30 569 | 92,21 | 0 | |||||
| 2025-07-23 | 13F | Kingswood Wealth Advisors, Llc | 27 424 | 22,06 | 409 | 20,35 | ||||
| 2025-07-21 | 13F | DHJJ Financial Advisors, Ltd. | 79 | 0,00 | 1 | 0,00 | ||||
| 2025-08-06 | 13F | Aspect Partners, LLC | 527 | 2,93 | 8 | 0,00 | ||||
| 2025-07-31 | 13F | Ground Swell Capital, LLC | 0 | −100,00 | 0 | |||||
| 2025-08-15 | 13F | Equitable Holdings, Inc. | 28 770 | 429 | ||||||
| 2025-08-04 | 13F | Mesirow Financial Investment Management, Inc. | 139 803 | −13,42 | 2 084 | −14,52 | ||||
| 2025-08-04 | 13F | AlphaStar Capital Management, LLC | 554 027 | 27,96 | 8 261 | 26,36 | ||||
| 2025-04-17 | 13F | Good Life Advisors, LLC | 0 | −100,00 | 0 | −100,00 | ||||
| 2025-08-05 | 13F | Bank Of Montreal /can/ | 5 646 | −23,64 | 84 | −24,32 | ||||
| 2025-07-10 | 13F | Wealth Enhancement Advisory Services, Llc | 247 862 | 5,22 | 3 718 | 4,50 | ||||
| 2025-08-14 | 13F | Two Sigma Securities, Llc | 17 621 | −8,60 | 263 | −9,97 | ||||
| 2025-07-22 | 13F | MAS Advisors LLC | 27 879 | 3,95 | 416 | 2,72 | ||||
| 2025-08-14 | 13F | IHT Wealth Management, LLC | 0 | −100,00 | 0 | −100,00 | ||||
| 2025-07-28 | 13F | RFG Advisory, LLC | 97 281 | −7,49 | 1 450 | −8,63 | ||||
| 2025-08-04 | 13F | Kovack Advisors, Inc. | 33 798 | −2,71 | 504 | −4,01 | ||||
| 2025-08-08 | 13F | Cetera Investment Advisers | 367 863 | 4,04 | 5 485 | 2,74 | ||||
| 2025-07-28 | 13F | Harbour Investments, Inc. | 12 155 | −0,61 | 181 | −1,63 | ||||
| 2025-07-17 | 13F | Sound Income Strategies, LLC | 61 | 0,00 | 1 | |||||
| 2025-07-09 | 13F | Triumph Capital Management | 67 118 | 105,27 | 1 001 | 102,84 | ||||
| 2025-08-14 | 13F | Old Mission Capital Llc | 28 558 | 426 | ||||||
| 2025-08-15 | 13F | First Heartland Consultants, Inc. | 20 314 | 3,06 | 303 | 1,68 | ||||
| 2025-08-11 | 13F | Perennial Investment Advisors, LLC | 20 039 | 3,03 | 299 | 1,71 | ||||
| 2025-08-12 | 13F | Retirement Planning Co of New England, Inc. | 27 351 | 12,89 | 408 | 11,51 | ||||
| 2025-08-14 | 13F | Citadel Advisors Llc | Call | 62 900 | 222,56 | 938 | 218,71 | |||
| 2025-05-13 | 13F | SFI Advisors, LLC | 0 | −100,00 | 0 | −100,00 | ||||
| 2025-08-14 | 13F | Citadel Advisors Llc | 42 550 | 101,74 | 634 | 99,37 | ||||
| 2025-08-13 | 13F | Colonial Trust Co / SC | 3 558 | 21,77 | 53 | 18,18 | ||||
| 2025-04-22 | 13F | TrueMark Investments, LLC | 0 | −100,00 | 0 | |||||
| 2025-07-24 | 13F | IFP Advisors, Inc | 13 663 | 34,98 | 204 | 33,55 | ||||
| 2025-08-08 | 13F | SBI Securities Co., Ltd. | 45 225 | −7,18 | 674 | −8,30 | ||||
| 2025-08-12 | 13F | PSI Advisors, LLC | 0 | −100,00 | 0 | |||||
| 2025-08-13 | 13F | Baird Financial Group, Inc. | 143 828 | −36,18 | 2 144 | −36,98 | ||||
| 2025-07-24 | 13F | Us Bancorp \de\ | 1 051 | 0,00 | 16 | 0,00 | ||||
| 2025-08-14 | 13F | Citadel Advisors Llc | Put | 35 400 | 8,59 | 528 | 7,11 | |||
| 2025-08-14 | 13F | Murphy & Mullick Capital Management Corp | 5 153 | 2,08 | 77 | 0,00 | ||||
| 2025-08-05 | 13F | Simplex Trading, Llc | 5 501 | −73,74 | 0 | |||||
| 2025-08-05 | 13F | Astra Wealth Partners LLC | Put | 97 300 | 43,72 | 1 451 | 41,88 | |||
| 2025-07-14 | 13F | AdvisorNet Financial, Inc | 33 | 3,12 | 0 | |||||
| 2025-09-04 | 13F/A | Advisor Group Holdings, Inc. | 475 978 | −0,42 | 7 097 | −1,66 | ||||
| 2025-07-29 | NP | EBI - Longview Advantage ETF | 0 | −100,00 | 0 | −100,00 | ||||
| 2025-08-08 | 13F | Capital Investment Advisory Services, LLC | 1 875 | 28 | ||||||
| 2025-07-14 | 13F | Caitlin John, LLC | 12 012 | −1,49 | 179 | −2,72 | ||||
| 2025-08-13 | 13F | Northwestern Mutual Wealth Management Co | 11 328 | 1 032,80 | 169 | 1 020,00 | ||||
| 2025-08-14 | 13F | TCG Advisory Services, LLC | 1 163 591 | −1,78 | 17 349 | −3,01 | ||||
| 2025-08-13 | 13F | Luminist Capital LLC | 6 199 | −1,91 | 92 | −3,16 | ||||
| 2025-08-05 | 13F | C2P Capital Advisory Group, LLC d.b.a. Prosperity Capital Advisors | 0 | −100,00 | 0 | −100,00 | ||||
| 2025-08-08 | 13F | Foundations Investment Advisors, LLC | 26 170 | −1,76 | 390 | −2,99 | ||||
| 2025-07-10 | 13F | High Net Worth Advisory Group LLC | 87 058 | −6,32 | 1 298 | −7,48 | ||||
| 2025-08-05 | 13F | Carolinas Wealth Consulting Llc | 0 | −100,00 | 0 | −100,00 | ||||
| 2025-07-11 | 13F | Farther Finance Advisors, LLC | 2 302 | 34 | ||||||
| 2025-07-01 | 13F | Private Client Services, Llc | 13 548 | 8,45 | 202 | 7,45 | ||||
| 2025-07-09 | 13F | Sandbox Financial Partners, LLC | 40 006 | 19,54 | 596 | 18,02 | ||||
| 2025-08-11 | 13F | HighTower Advisors, LLC | Call | 220 000 | −69,16 | 33 | −70,09 | |||
| 2025-08-06 | 13F | Wedbush Securities Inc | 31 745 | 3,59 | 0 | |||||
| 2025-08-18 | 13F | Wolverine Trading, Llc | Call | 17 700 | 263 | |||||
| 2025-05-02 | 13F | Kingsview Wealth Management, LLC | 0 | −100,00 | 0 | |||||
| 2025-07-29 | 13F | Koshinski Asset Management, Inc. | 56 360 | 0,40 | 840 | −0,83 | ||||
| 2025-04-30 | 13F | Axxcess Wealth Management, Llc | 0 | −100,00 | 0 | |||||
| 2025-08-12 | 13F | Proequities, Inc. | 0 | 0 | ||||||
| 2025-08-14 | 13F | Comerica Bank | 9 733 | 66,63 | 145 | 64,77 | ||||
| 2025-07-17 | 13F | Camelot Portfolios, LLC | 0 | −100,00 | 0 | |||||
| 2025-08-15 | 13F | Prevail Innovative Wealth Advisors, Llc | 0 | −100,00 | 0 | −100,00 | ||||
| 2025-08-14 | 13F | Ameriprise Financial Inc | 923 028 | 12,14 | 13 819 | 11,16 | ||||
| 2025-08-11 | 13F | Western Wealth Management, LLC | 10 892 | 0,00 | 162 | −1,22 | ||||
| 2025-08-04 | 13F | Flagship Harbor Advisors, Llc | 12 643 | −6,28 | 189 | −7,39 | ||||
| 2025-07-18 | 13F | Trilogy Capital Inc. | 29 641 | 0,72 | 442 | −0,68 | ||||
| 2025-08-11 | 13F | Rothschild Investment Llc | 2 675 | 0,00 | 40 | −2,50 | ||||
| 2025-07-30 | 13F | Blume Capital Management, Inc. | 15 | 0 | ||||||
| 2025-07-18 | 13F | Truist Financial Corp | 0 | −100,00 | 0 | |||||
| 2025-07-23 | 13F | Abel Hall, LLC | 49 000 | 68,97 | 731 | 67,05 | ||||
| 2025-07-30 | 13F | Brookstone Capital Management | 527 237 | 3,34 | 7 861 | 2,05 | ||||
| 2025-08-14 | 13F | Group One Trading, L.p. | 3 495 | −95,18 | 52 | −95,25 | ||||
| 2025-07-21 | 13F | Patriot Financial Group Insurance Agency, LLC | 15 112 | −7,25 | 225 | −8,54 | ||||
| 2025-07-31 | 13F | Whipplewood Advisors, LLC | 1 053 | −95,63 | 16 | 0,00 | ||||
| 2025-08-08 | 13F | Thrive Capital Management, LLC | 223 632 | 3 334 | ||||||
| 2025-08-14 | 13F | Wells Fargo & Company/mn | 784 172 | 2,33 | 11 692 | 1,04 | ||||
| 2025-08-19 | 13F | Asset Dedication, LLC | 0 | −100,00 | 0 | −100,00 | ||||
| 2025-07-17 | 13F | Janney Montgomery Scott LLC | 246 266 | 0,60 | 4 | 0,00 | ||||
| 2025-07-17 | 13F | XML Financial, LLC | 15 000 | 15,38 | 224 | 13,78 | ||||
| 2025-07-09 | 13F | Lifestyle Asset Management, Inc. | 0 | −100,00 | 0 | |||||
| 2025-08-05 | 13F | Westside Investment Management, Inc. | 0 | −100,00 | 0 | −100,00 | ||||
| 2025-08-15 | 13F | Morgan Stanley | 2 351 967 | −14,42 | 35 068 | −15,50 | ||||
| 2025-08-04 | 13F | MeadowBrook Investment Advisors LLC | 3 398 | 0,00 | 51 | −1,96 | ||||
| 2025-08-14 | 13F | Jane Street Group, Llc | Call | 19 000 | −26,36 | 283 | −27,25 | |||
| 2025-08-14 | 13F | UBS Group AG | 906 629 | −2,22 | 13 518 | −3,46 | ||||
| 2025-07-21 | 13F | Credential Qtrade Securities Inc. | 0 | −100,00 | 0 | −100,00 | ||||
| 2025-08-12 | 13F | Howe & Rusling Inc | 9 860 | −15,88 | 147 | −16,48 | ||||
| 2025-07-10 | 13F | Atticus Wealth Management, Llc | 3 012 | 3,04 | 45 | 0,00 | ||||
| 2025-07-14 | 13F | Palacios Wealth Management, LLC | 243 075 | −2,73 | 3 624 | −3,95 | ||||
| 2025-08-05 | 13F | Sigma Planning Corp | 26 260 | −15,14 | 392 | −16,27 | ||||
| 2025-07-18 | 13F | Institute for Wealth Management, LLC. | 155 872 | −1,60 | 2 324 | −2,80 | ||||
| 2025-08-12 | 13F | AlphaCore Capital LLC | 2 094 | 91,41 | 31 | 93,75 | ||||
| 2025-08-15 | 13F | Tower Research Capital LLC (TRC) | 670 | 10 | ||||||
| 2025-07-22 | 13F | Accel Wealth Management | 21 044 | −3,80 | 314 | −5,15 | ||||
| 2025-07-31 | 13F | Oppenheimer & Co Inc | 21 160 | 25,14 | 315 | 23,53 | ||||
| 2025-08-19 | 13F | National Asset Management, Inc. | 15 833 | 236 | ||||||
| 2025-07-24 | 13F | Ulland Investment Advisors, LLC | 14 000 | 0 | ||||||
| 2025-07-23 | 13F | Castle Rock Wealth Management, LLC | 13 206 | −14,38 | 195 | −16,38 | ||||
| 2025-04-14 | 13F | NewSquare Capital LLC | 0 | −100,00 | 0 | |||||
| 2025-08-14 | 13F | Great Valley Advisor Group, Inc. | 13 736 | 20,47 | 205 | 18,60 | ||||
| 2025-08-19 | 13F | Newbridge Financial Services Group, Inc. | 143 028 | −27,57 | 2 133 | −28,48 | ||||
| 2025-07-16 | 13F | Formidable Asset Management, LLC | 128 506 | 0,00 | 1 940 | 0,00 | ||||
| 2025-08-12 | 13F | BlackRock, Inc. | 3 227 | 156,72 | 48 | 166,67 | ||||
| 2025-07-30 | 13F | D.a. Davidson & Co. | 11 838 | 17,46 | 177 | 15,79 | ||||
| 2025-08-14 | 13F | Raymond James Financial Inc | 572 329 | −21,47 | 8 533 | −22,46 | ||||
| 2025-08-14 | 13F | Jane Street Group, Llc | 200 247 | 35,19 | 2 986 | 33,50 | ||||
| 2025-07-21 | 13F | Ameritas Advisory Services, LLC | 35 623 | 4,88 | 531 | −3,80 | ||||
| 2025-08-14 | 13F | Banque Transatlantique SA | 0 | −100,00 | 0 | |||||
| 2025-08-14 | 13F | Hrt Financial Lp | 16 250 | −62,20 | 0 | |||||
| 2025-08-14 | 13F | Stifel Financial Corp | 83 894 | 32,94 | 1 251 | 31,30 | ||||
| 2025-07-29 | 13F | Stratos Wealth Partners, LTD. | 135 570 | 1 007,69 | 2 021 | 998,37 | ||||
| 2025-07-16 | 13F | Investment Partners Asset Management, Inc. | 67 447 | −0,17 | 1 006 | −1,47 | ||||
| 2025-07-21 | 13F | Ameriflex Group, Inc. | 0 | −100,00 | 0 | |||||
| 2025-07-29 | 13F | Chicago Partners Investment Group LLC | 45 502 | 5,26 | 676 | 7,31 | ||||
| 2025-07-29 | 13F | International Assets Investment Management, Llc | 245 487 | 26,96 | 3 656 | 25,25 | ||||
| 2025-08-14 | 13F | Bank Of America Corp /de/ | 2 107 785 | 3,95 | 31 427 | 2,65 | ||||
| 2025-08-13 | 13F/A | StoneX Group Inc. | 0 | −100,00 | 0 | −100,00 | ||||
| 2025-08-13 | 13F | Garner Asset Management Corp | 40 912 | −15,32 | 610 | −16,46 | ||||
| 2025-08-12 | 13F | SRS Capital Advisors, Inc. | 16 981 | 3,03 | 253 | 2,02 | ||||
| 2025-04-23 | 13F | Bessemer Group Inc | 0 | −100,00 | 0 | |||||
| 2025-08-12 | 13F | Change Path, LLC | 68 202 | 26,06 | 1 017 | 24,51 | ||||
| 2025-08-08 | 13F | Gts Securities Llc | 0 | −100,00 | 0 | −100,00 | ||||
| 2025-08-14 | 13F | Wiley Bros.-aintree Capital, Llc | 17 776 | 12,82 | 265 | 11,34 | ||||
| 2025-08-06 | 13F | AE Wealth Management LLC | 3 125 | 0,64 | 47 | 0,00 | ||||
| 2025-08-11 | 13F | Nations Financial Group Inc, /ia/ /adv | 0 | −100,00 | 0 | −100,00 | ||||
| 2025-08-14 | 13F | Mariner, LLC | 17 263 | 0,61 | 257 | −0,77 | ||||
| 2025-08-11 | 13F | Regal Investment Advisors LLC | 0 | −100,00 | 0 | −100,00 | ||||
| 2025-08-11 | 13F | Anfield Capital Management, LLC | 3 397 | 0,00 | 51 | −1,96 | ||||
| 2025-08-01 | 13F | Brookwood Investment Group LLC | 14 101 | 210 | ||||||
| 2025-07-17 | 13F | Venture Visionary Partners LLC | 256 699 | 1,20 | 3 827 | −0,08 | ||||
| 2025-08-08 | 13F | Hartland & Co., LLC | 20 282 | 63,87 | 302 | 62,37 | ||||
| 2025-08-15 | 13F | Kestra Advisory Services, LLC | 284 562 | −2,78 | 4 243 | −4,01 | ||||
| 2025-08-06 | 13F | ETF Store, Inc. | 10 216 | 2,00 | 152 | 0,66 | ||||
| 2025-08-14 | 13F | Fmr Llc | 1 330 | 164,94 | 20 | 171,43 | ||||
| 2025-04-25 | 13F | Colonial River Wealth Management, LLC | 0 | −100,00 | 0 | |||||
| 2025-05-15 | 13F | Talon Private Wealth, LLC | 0 | −100,00 | 0 | −100,00 | ||||
| 2025-07-15 | 13F | World Equity Group, Inc. | 10 322 | −6,87 | 154 | −10,00 | ||||
| 2025-08-12 | 13F | Archer Investment Corp | 200 | 0,00 | 3 | −33,33 | ||||
| 2025-08-12 | 13F | CIBC Private Wealth Group, LLC | 5 633 | 84 | ||||||
| 2025-04-29 | NP | ORR - Militia Long/Short Equity ETF | Short | −558 807 | −8 969 | |||||
| 2025-08-12 | 13F | Steward Partners Investment Advisory, Llc | 2 800 | −16,72 | 42 | −18,00 | ||||
| 2025-07-24 | 13F | Comprehensive Money Management Services LLC | 41 704 | −12,58 | 622 | −13,75 | ||||
| 2025-08-11 | 13F | Independent Advisor Alliance | 142 306 | 248,77 | 2 122 | 244,32 | ||||
| 2025-08-12 | 13F | Leigh Baldwin & Co., Llc | 0 | −100,00 | 0 | −100,00 | ||||
| 2025-08-06 | 13F | Commonwealth Equity Services, Llc | 56 076 | 5,57 | 1 | |||||
| 2025-08-29 | NP | OneAscent Capital Opportunities Fund | 45 000 | 80,00 | 671 | 77,72 | ||||
| 2025-08-14 | 13F | Smartleaf Asset Management LLC | 145 | −79,14 | 2 | −80,00 | ||||
| 2025-07-08 | 13F | Nbc Securities, Inc. | 3 425 | −35,80 | 0 | |||||
| 2025-08-13 | 13F | Beacon Pointe Advisors, LLC | 14 790 | −23,37 | 221 | −24,40 | ||||
| 2025-07-29 | 13F | Private Trust Co Na | 1 904 | −37,35 | 28 | −37,78 | ||||
| 2025-08-08 | 13F | Avantax Advisory Services, Inc. | 146 111 | 392,65 | 2 179 | 387,25 | ||||
| 2025-08-12 | 13F | J.w. Cole Advisors, Inc. | 128 014 | 33,72 | 1 909 | 32,04 | ||||
| 2025-07-08 | 13F/A | Salem Investment Counselors Inc | 300 | −40,00 | 4 | −42,86 | ||||
| 2025-08-04 | 13F | Spire Wealth Management | 2 026 | 0,00 | 30 | 0,00 | ||||
| 2025-08-12 | 13F | Winnow Wealth Llc | 0 | −100,00 | 0 | −100,00 | ||||
| 2025-07-23 | 13F | Foresight Capital Management Advisors, Inc. | 132 315 | 1 973 | ||||||
| 2025-07-25 | 13F | Cwm, Llc | 1 942 | 0,05 | 0 | |||||
| 2025-08-05 | 13F | Atlas Private Wealth Advisors | 232 901 | −9,36 | 3 473 | −10,49 | ||||
| 2025-09-12 | 13F/A | Valeo Financial Advisors, LLC | 29 544 | 4,86 | 441 | 3,53 | ||||
| 2025-08-14 | 13F | GWM Advisors LLC | 173 573 | 2,42 | 2 588 | 1,13 | ||||
| 2025-05-14 | 13F | Brown Brothers Harriman & Co | 0 | −100,00 | 0 | |||||
| 2025-08-08 | 13F | Emerald Investment Partners, Llc | 9 901 | 148 | ||||||
| 2025-08-13 | 13F | Capital Analysts, Inc. | 651 | 0 | ||||||
| 2025-08-13 | 13F | Level Four Advisory Services, Llc | 11 176 | 4,28 | 167 | 3,11 | ||||
| 2025-08-14 | 13F | Federation des caisses Desjardins du Quebec | 1 333 | 0,00 | 20 | −5,00 | ||||
| 2025-08-12 | 13F | LPL Financial LLC | 3 139 151 | 4,69 | 46 805 | 3,37 | ||||
| 2025-08-14 | 13F | Royal Bank Of Canada | 462 121 | −39,94 | 6 890 | −40,70 | ||||
| 2025-08-13 | 13F | Stablepoint Partners, LLC | 10 384 | 155 | ||||||
| 2025-05-01 | 13F | ADG Wealth Management Group, LLC | 0 | −100,00 | 0 | |||||
| 2025-08-08 | 13F | Larson Financial Group LLC | 1 | 0,00 | 0 | |||||
| 2025-08-14 | 13F | Susquehanna International Group, Llp | 120 870 | −62,37 | 1 802 | −62,85 | ||||
| 2025-07-25 | 13F | Atria Wealth Solutions, Inc. | 49 517 | −27,99 | 738 | −28,90 | ||||
| 2025-08-07 | 13F | Allworth Financial LP | 21 | 61,54 | 0 | |||||
| 2025-08-13 | 13F | Solutions 4 Wealth, Ltd | 56 723 | −12,72 | 846 | −13,86 | ||||
| 2025-04-28 | 13F | Strategic Financial Concepts, LLC | 0 | −100,00 | 0 | −100,00 | ||||
| 2025-08-01 | 13F | Envestnet Asset Management Inc | 425 943 | 22,68 | 6 351 | 21,14 | ||||
| 2025-08-15 | 13F | CI Private Wealth, LLC | 113 149 | 1 687 |