Grundläggande statistik
| Institutionella ägare | 214 total, 210 long only, 2 short only, 2 long/short - change of −2,26% MRQ |
| Genomsnittlig portföljallokering | 0.2287 % - change of −31,05% MRQ |
| Institutionella aktier (lång) | 6 689 339 (ex 13D/G) - change of −1,92MM shares −22,33% MRQ |
| Institutionellt värde (lång) | $ 615 343 USD ($1000) |
Institutionellt ägande och aktieägare
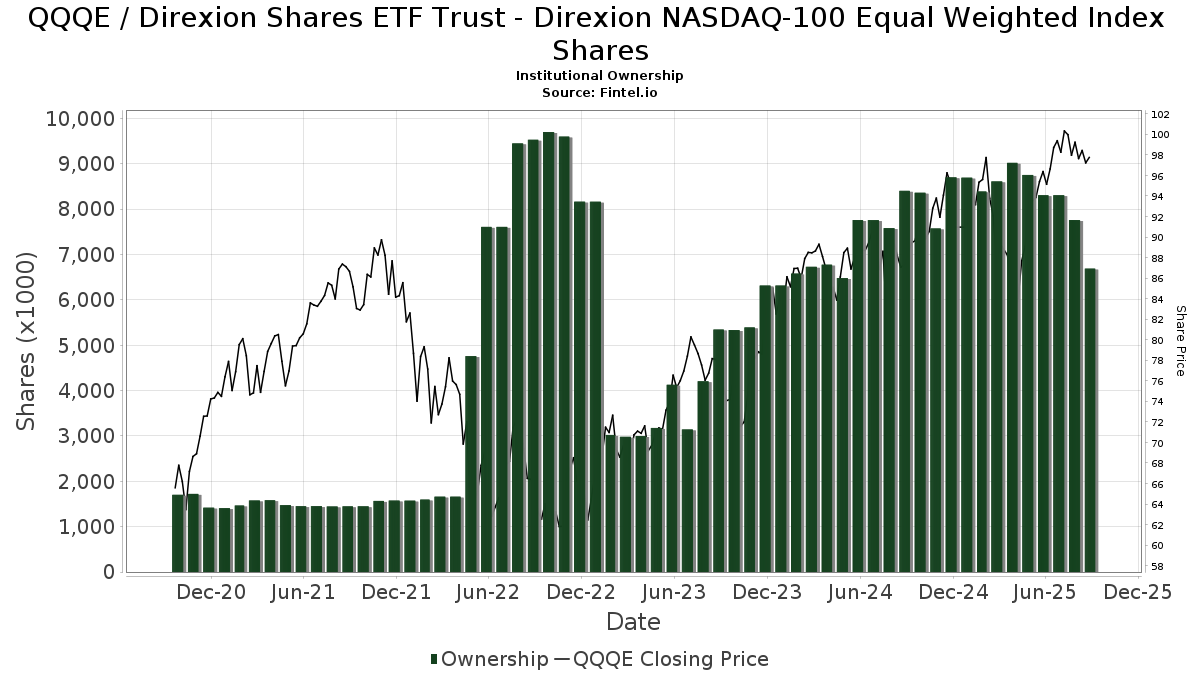
Direxion Shares ETF Trust - Direxion NASDAQ-100 Equal Weighted Index Shares (US:QQQE) har 214 Institutionella ägare och aktieägare som har lämnat in 13D/G- eller 13F-formulär till Securities Exchange Commission (SEC). Dessa institut innehar totalt 7,004,539 aktier. Största aktieägare inkluderar Goldman Sachs Group Inc, Bank Of America Corp /de/, Ameriprise Financial Inc, Morgan Stanley, Waddell & Associates, Llc, Endurance Services Ltd, LPL Financial LLC, Frisch Financial Group, Inc., Bnp Paribas Arbitrage, Sa, and UBS Group AG .
Direxion Shares ETF Trust - Direxion NASDAQ-100 Equal Weighted Index Shares (NasdaqGM:QQQE) Institutionell ägarstruktur visar institutioners och fonders nuvarande positioner i företaget, samt de senaste förändringarna i positionernas storlek. Större aktieägare kan vara enskilda investerare, fonder, hedgefonder eller institutioner. Bilaga 13D visar att investeraren äger (eller ägde) mer än 5% av företaget och avser (eller avsåg) att aktivt eftersträva en förändring av affärsstrategin. Schedule 13G indikerar en passiv investering på över 5%.
The share price as of September 19, 2025 is 100,84 / share. Previously, on September 20, 2024, the share price was 89,48 / share. This represents an increase of 12,70% over that period.
Fondsentimentets poäng
Fondsentimentet poängen(fka Ägarackumulation-poäng) visar vilka aktier som är mest köpta av fonder. Det är resultatet av en sofistikerad kvantitativ flerfaktormodell som identifierar företag med de högsta nivåerna av institutionell ackumulering. Poängsättningsmodellen använder en kombination av den totala ökningen av redovisade ägare, förändringarna i portföljallokeringarna för dessa ägare och andra mått. Siffran sträcker sig från 0 till 100, där högre siffror indikerar en högre nivå av ackumulering i förhållande till sina konkurrenter, och 50 är genomsnittet.
Uppdateringsfrekvens: Dagligen
Se Ownership Explorer, som innehåller en lista över de högst rankade företagen.
AI+ Ask Fintel’s AI assistant about Direxion Shares ETF Trust - Direxion NASDAQ-100 Equal Weighted Index Shares.
Thinking of good questions…
Institutionell sälj/köp-kvot
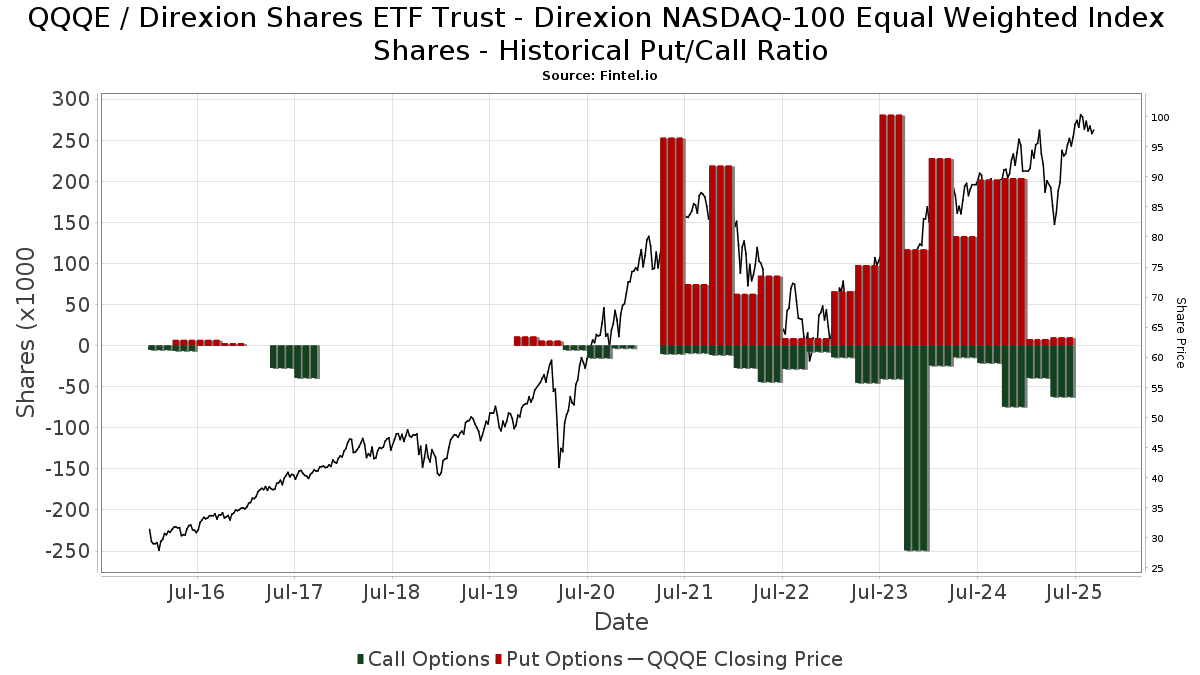
Förutom att rapportera vanliga eget kapital- och skuldemissioner måste institutioner med mer än 100MM tillgångar under förvaltning också avslöja sina innehav av sälj- och köpoptioner. Eftersom säljoptioner i allmänhet indikerar ett negativt sentiment och köpoptioner indikerar ett positivt sentiment, kan vi få en uppfattning om det övergripande institutionella sentimentet genom att plotta förhållandet mellan säljoptioner och köpoptioner. Diagrammet till höger visar det historiska förhållandet mellan sälj- och köpoptioner för detta instrument.
Genom att använda sälj/köp-kvoten som en indikator på aktieägarnas sentiment undviker man en av de största bristerna med att använda det totala institutionella ägandet, nämligen att en betydande del av de förvaltade tillgångarna investeras passivt för att följa index. Passivt förvaltade fonder köper vanligtvis inte optioner, så indikatorn för sälj/köp-kvoten ger en bättre bild av stämningen i aktivt förvaltade fonder.
13F- och NPORT-arkiveringar
Detaljer om 13F-arkiveringar är gratis. Detaljer om NP-arkiveringar kräver ett premiummedlemskap. Gröna rader indikerar nya positioner. Röda rader indikerar stängda positioner. Klicka på länk symbolen för att se hela transaktionshistoriken.
Uppgradera
för att låsa upp premiumdata och exportera till Excel ![]() .
.
| Fil Datum | Källa | Investerare | Typ | Genomsnittligt pris (beräknat) |
Aktier | Δ Aktier (%) |
Rapporterat värde (1000 USD) |
Δ Värde (%) |
Portföljallokering (%) |
|
|---|---|---|---|---|---|---|---|---|---|---|
| 2025-07-22 | 13F | Old National Bancorp /in/ | 3 460 | 1,76 | 340 | 14,86 | ||||
| 2025-05-02 | 13F | Transcendent Capital Group LLC | 0 | −100,00 | 0 | |||||
| 2025-08-12 | 13F | Retirement Planning Co of New England, Inc. | 8 367 | 3,07 | 823 | 16,27 | ||||
| 2025-08-18 | 13F/A | National Bank Of Canada /fi/ | 1 334 | −21,67 | 131 | −12,16 | ||||
| 2025-05-15 | 13F | Vermillion & White Wealth Management Group, LLC | 0 | −100,00 | 0 | |||||
| 2025-07-02 | 13F | Howard Financial Services, Ltd. | 3 553 | 18,24 | 349 | 33,72 | ||||
| 2025-08-13 | 13F | Victory Financial Group, Llc | 2 609 | 4,57 | 256 | 17,97 | ||||
| 2025-08-19 | 13F | Advisory Services Network, LLC | 6 459 | −29,79 | 635 | −20,82 | ||||
| 2025-08-13 | 13F | Virtue Capital Management, LLC | 0 | −100,00 | 0 | |||||
| 2025-07-14 | 13F | Sowell Financial Services LLC | 7 801 | −6,61 | 767 | 5,22 | ||||
| 2025-08-12 | 13F | Proequities, Inc. | 0 | 0 | ||||||
| 2025-08-12 | 13F | Jefferies Financial Group Inc. | 2 330 | 229 | ||||||
| 2025-05-05 | 13F | Private Advisor Group, LLC | 0 | −100,00 | 0 | |||||
| 2025-07-28 | 13F | Mutual Advisors, LLC | 10 888 | 6,18 | 1 093 | 22,70 | ||||
| 2025-07-17 | 13F | Beacon Capital Management, LLC | 660 | −5,04 | 65 | 6,67 | ||||
| 2025-08-14 | 13F | Jane Street Group, Llc | Call | 13 500 | 1 327 | |||||
| 2025-08-13 | 13F | Jones Financial Companies Lllp | 42 836 | 8,87 | 4 177 | 21,75 | ||||
| 2025-08-05 | 13F | Bank of New York Mellon Corp | 5 696 | −25,64 | 560 | −16,19 | ||||
| 2025-08-08 | 13F | Hudock, Inc. | 2 199 | 216 | ||||||
| 2025-08-05 | 13F | Cherry Tree Wealth Management, LLC | 0 | −100,00 | 0 | |||||
| 2025-08-12 | 13F | CIBC Private Wealth Group, LLC | 250 | 0,00 | 25 | 26,32 | ||||
| 2025-07-24 | 13F | Stonebridge Financial Group, LLC | 0 | −100,00 | 0 | |||||
| 2025-08-04 | 13F | Arkadios Wealth Advisors | 4 007 | 394 | ||||||
| 2025-08-14 | 13F | Goldman Sachs Group Inc | 900 000 | 80,00 | 88 479 | 102,96 | ||||
| 2025-07-25 | 13F | Atria Wealth Solutions, Inc. | 0 | −100,00 | 0 | |||||
| 2025-07-29 | 13F | Harbor Asset Planning, Inc. | 629 | 62 | ||||||
| 2025-07-11 | 13F | Farther Finance Advisors, LLC | 56 | 6 | ||||||
| 2025-04-01 | 13F | Modus Advisors, LLC | 0 | −100,00 | 0 | −100,00 | ||||
| 2025-07-10 | 13F | Marshall Financial Group LLC | 11 866 | −9,69 | 1 171 | 2,18 | ||||
| 2025-08-11 | 13F | Cannon Advisors, Inc. | 25 487 | 7,65 | 2 506 | 21,37 | ||||
| 2025-05-15 | 13F | Hbk Investments L P | Put | 0 | −100,00 | 0 | ||||
| 2025-08-13 | 13F | Healthcare Of Ontario Pension Plan Trust Fund | 43 000 | 0,00 | 4 227 | 12,75 | ||||
| 2025-07-08 | 13F | Nbc Securities, Inc. | 87 | 0,00 | 0 | |||||
| 2025-08-11 | 13F | Citigroup Inc | 50 675 | −0,01 | 4 982 | 12,74 | ||||
| 2025-07-22 | 13F | Wealthcare Advisory Partners LLC | 2 251 | 221 | ||||||
| 2025-08-05 | 13F | Welch & Forbes Llc | 0 | −100,00 | 0 | |||||
| 2025-08-05 | 13F | Key FInancial Inc | 4 649 | 0,00 | 457 | 12,84 | ||||
| 2025-07-10 | 13F | Kmg Fiduciary Partners, Llc | 6 205 | −72,27 | 610 | −68,72 | ||||
| 2025-07-31 | 13F | Optimum Investment Advisors | 25 | 0,00 | 2 | 0,00 | ||||
| 2025-08-18 | 13F | Hollencrest Capital Management | 983 | 0,00 | 97 | 12,94 | ||||
| 2025-08-11 | 13F | Regal Investment Advisors LLC | 20 712 | 0,30 | 2 036 | 13,11 | ||||
| 2025-08-13 | 13F | Cerity Partners LLC | 3 601 | 0,00 | 354 | 13,10 | ||||
| 2025-07-14 | 13F | AdvisorNet Financial, Inc | 724 | 0,00 | 71 | 12,70 | ||||
| 2025-07-24 | 13F | Galvin, Gaustad & Stein, LLC | 2 295 | 0,00 | 226 | 12,50 | ||||
| 2025-07-30 | 13F | D.a. Davidson & Co. | 8 083 | −64,96 | 795 | −60,52 | ||||
| 2025-08-13 | 13F | Wambolt & Associates, LLC | 22 471 | −1,86 | 2 210 | 10,17 | ||||
| 2025-07-22 | 13F | Berkshire Money Management, Inc. | 56 591 | −27,86 | 5 563 | −18,66 | ||||
| 2025-07-30 | 13F | FNY Investment Advisers, LLC | 220 | 0,00 | 0 | |||||
| 2025-08-07 | 13F | Runnymede Capital Advisors, Inc. | 0 | −100,00 | 0 | |||||
| 2025-07-10 | 13F | Focus Financial Network, Inc. | 5 847 | −10,31 | 576 | 1,23 | ||||
| 2025-08-08 | 13F | Thoroughbred Financial Services, Llc | 2 391 | −16,28 | 0 | |||||
| 2025-07-22 | 13F | SOL Capital Management CO | 43 101 | −15,48 | 4 | 0,00 | ||||
| 2025-08-01 | 13F | Envestnet Asset Management Inc | 46 294 | −57,30 | 4 551 | −51,85 | ||||
| 2025-07-30 | 13F | LifeWealth Investments, LLC | 16 246 | 25,34 | 1 597 | 41,33 | ||||
| 2025-08-14 | 13F | Jane Street Group, Llc | 27 473 | 185,70 | 2 701 | 222,20 | ||||
| 2025-08-29 | 13F | Total Investment Management Inc | 4 995 | −99,30 | 491 | −99,22 | ||||
| 2025-08-19 | 13F | Cape Investment Advisory, Inc. | 106 | 0,00 | 10 | 11,11 | ||||
| 2025-08-14 | 13F | Ancora Advisors, LLC | 469 | 0,00 | 46 | 15,00 | ||||
| 2025-08-05 | 13F | Sigma Planning Corp | 2 322 | −33,08 | 228 | −24,50 | ||||
| 2025-07-07 | 13F | Nova Wealth Management, Inc. | 160 | 0,00 | 16 | 15,38 | ||||
| 2025-08-11 | 13F | Pineridge Advisors LLC | 29 | 0,00 | 3 | 0,00 | ||||
| 2025-08-14 | 13F | Bnp Paribas Arbitrage, Sa | 201 400 | 98,62 | 19 800 | 123,95 | ||||
| 2025-08-04 | 13F | Spire Wealth Management | 536 | −39,16 | 53 | −31,58 | ||||
| 2025-08-14 | 13F | Helium Advisors LLC | 4 162 | 0,07 | 409 | 12,98 | ||||
| 2025-08-15 | 13F/A | Florida Financial Advisors, Llc | 3 570 | −5,08 | 351 | 7,03 | ||||
| 2025-07-31 | 13F | CAP Partners, LLC | 13 214 | −59,18 | 1 299 | −53,97 | ||||
| 2025-08-13 | 13F | Quadrant Capital Group Llc | 0 | −100,00 | 0 | |||||
| 2025-07-29 | 13F | International Assets Investment Management, Llc | 2 585 | 0,00 | 254 | 12,89 | ||||
| 2025-04-30 | 13F | Weil Company, Inc. | 0 | −100,00 | 0 | |||||
| 2025-07-18 | 13F | Truist Financial Corp | 47 021 | 16,82 | 4 623 | 31,72 | ||||
| 2025-07-21 | 13F | Tilia Fiduciary Partners, Inc. | 4 314 | −0,58 | 424 | 12,17 | ||||
| 2025-08-08 | 13F | Kingsview Wealth Management, LLC | 2 532 | 249 | ||||||
| 2025-07-29 | 13F | Activest Wealth Management | 0 | 0 | ||||||
| 2025-08-13 | 13F | Avestar Capital, LLC | 88 163 | 21,51 | 8 675 | 37,12 | ||||
| 2025-08-15 | 13F | First Heartland Consultants, Inc. | 2 807 | −14,00 | 276 | −3,17 | ||||
| 2025-07-24 | 13F | Aurora Private Wealth, Inc. | 2 309 | −18,55 | 0 | |||||
| 2025-07-17 | 13F | White Pine Investment CO | 33 658 | −0,05 | 3 | 50,00 | ||||
| 2025-08-08 | 13F | Gts Securities Llc | 4 668 | 459 | ||||||
| 2025-08-11 | 13F | Hexagon Capital Partners LLC | 0 | −100,00 | 0 | |||||
| 2025-08-14 | 13F | Ameriprise Financial Inc | 631 319 | 0,92 | 62 072 | 13,81 | ||||
| 2025-07-23 | 13F | Clear Creek Financial Management, LLC | 3 134 | −24,50 | 308 | −14,68 | ||||
| 2025-08-14 | 13F | Bank Of America Corp /de/ | 655 343 | −34,05 | 64 427 | −25,64 | ||||
| 2025-05-16 | 13F/A | Kestra Investment Management, LLC | 0 | −100,00 | 0 | |||||
| 2025-08-13 | 13F | B&D White Capital Company, LLC | 22 771 | −90,22 | 2 237 | −88,98 | ||||
| 2025-08-14 | 13F | Integrated Wealth Concepts LLC | 3 751 | 0,00 | 369 | 12,54 | ||||
| 2025-05-14 | 13F | Huntington National Bank | 10 | 800,00 | ||||||
| 2025-07-23 | 13F | Prime Capital Investment Advisors, LLC | 0 | −100,00 | 0 | |||||
| 2025-08-12 | 13F | Calton & Associates, Inc. | 2 278 | 224 | ||||||
| 2025-04-15 | 13F | GPS Wealth Strategies Group, LLC | 0 | −100,00 | 0 | −100,00 | ||||
| 2025-07-24 | 13F | Eastern Bank | 253 | −4,53 | 25 | 4,35 | ||||
| 2025-05-13 | 13F | Equitable Holdings, Inc. | 0 | −100,00 | 0 | |||||
| 2025-07-23 | 13F | Sax Wealth Advisors, Llc | 6 854 | −3,38 | 674 | 8,90 | ||||
| 2025-08-13 | 13F | Northwestern Mutual Wealth Management Co | 52 349 | 25,65 | 5 146 | 41,69 | ||||
| 2025-08-14 | 13F | Wells Fargo & Company/mn | 274 | −99,82 | 27 | −99,80 | ||||
| 2025-08-27 | 13F/A | Brinker Capital Investments, LLC | 3 806 | −4,78 | 374 | 7,47 | ||||
| 2025-07-23 | 13F | Element Wealth, LLC | 3 966 | 0,00 | 390 | 12,75 | ||||
| 2025-08-12 | 13F | Jpmorgan Chase & Co | 150 | −1,32 | 15 | 7,69 | ||||
| 2025-08-11 | 13F | Promethium Advisors,llc | 3 807 | −72,54 | 375 | −69,07 | ||||
| 2025-08-13 | 13F | Beacon Pointe Advisors, LLC | 29 959 | 37,06 | 2 945 | 54,59 | ||||
| 2025-07-09 | 13F | Dynamic Advisor Solutions LLC | 0 | −100,00 | 0 | |||||
| 2025-08-08 | 13F | Avantax Advisory Services, Inc. | 11 153 | 0,90 | 1 096 | 13,81 | ||||
| 2025-08-11 | 13F/A | Purus Wealth Management, LLC | 2 918 | −12,63 | 287 | −1,72 | ||||
| 2025-05-28 | NP | TFAGX - TFA AlphaGen Growth Fund Class I | 14 400 | 1 256 | ||||||
| 2025-08-12 | 13F | LPL Financial LLC | 328 793 | 3,67 | 32 324 | 16,89 | ||||
| 2025-08-11 | 13F | Western Wealth Management, LLC | 4 649 | 12,05 | 457 | 26,59 | ||||
| 2025-07-14 | 13F | Signature Securities Group Corporation | 13 082 | 1,47 | 1 288 | 14,50 | ||||
| 2025-08-04 | 13F | Kovack Advisors, Inc. | 0 | −100,00 | 0 | |||||
| 2025-08-11 | 13F | HighTower Advisors, LLC | 84 904 | 2,75 | 8 347 | 15,85 | ||||
| 2025-07-15 | 13F | Armis Advisers, LLC | 3 070 | 0,00 | 302 | 12,27 | ||||
| 2025-08-14 | 13F | Mariner, LLC | 10 435 | 7,36 | 1 026 | 21,02 | ||||
| 2025-08-08 | 13F | TD Capital Management LLC | 340 | 0,00 | 33 | 13,79 | ||||
| 2025-08-12 | 13F | BlackRock, Inc. | 327 | 81,67 | 32 | 113,33 | ||||
| 2025-08-12 | 13F | Mmbg Investment Advisors Co. | 2 280 | 224 | ||||||
| 2025-08-13 | 13F | Renaissance Technologies Llc | 4 376 | 430 | ||||||
| 2025-08-13 | 13F | Dana Investment Advisors, Inc. | 2 879 | −41,27 | 283 | −33,72 | ||||
| 2025-04-09 | 13F | RFG Advisory, LLC | 0 | −100,00 | 0 | |||||
| 2025-08-14 | 13F | Qube Research & Technologies Ltd | 34 | 3 | ||||||
| 2025-08-13 | 13F | Legacy Capital Wealth Partners, LLC | 0 | −100,00 | 0 | |||||
| 2025-08-12 | 13F | Archer Investment Corp | 32 | 0,00 | 3 | 50,00 | ||||
| 2025-05-09 | 13F | Headlands Technologies LLC | 0 | −100,00 | 0 | |||||
| 2025-04-28 | 13F | Strategic Financial Concepts, LLC | 0 | −100,00 | 0 | −100,00 | ||||
| 2025-08-19 | 13F | Anchor Investment Management, LLC | 3 | 0,00 | 0 | |||||
| 2025-08-05 | 13F | Harel Insurance Investments & Financial Services Ltd. | 55 | −81,97 | 0 | |||||
| 2025-05-15 | 13F | Polar Asset Management Partners Inc. | 0 | −100,00 | 0 | −100,00 | ||||
| 2025-07-15 | 13F | Carr Financial Group Corp | 18 518 | −11,05 | 1 821 | 0,28 | ||||
| 2025-07-22 | 13F | Merit Financial Group, LLC | 2 301 | −17,38 | 226 | −6,61 | ||||
| 2025-07-08 | 13F | Parallel Advisors, LLC | 5 126 | 0,00 | 504 | 12,78 | ||||
| 2025-07-21 | 13F | Warner Financial, Inc | 15 534 | 0,02 | 2 | 0,00 | ||||
| 2025-07-22 | 13F | DAVENPORT & Co LLC | 11 146 | −27,15 | 1 096 | −17,85 | ||||
| 2025-08-06 | 13F | First Horizon Advisors, Inc. | 166 | 0,00 | 16 | 14,29 | ||||
| 2025-08-05 | 13F | Bank Of Montreal /can/ | 1 821 | 0,00 | 179 | 13,29 | ||||
| 2025-05-15 | 13F/A | Orion Portfolio Solutions, LLC | 3 997 | −2,65 | 349 | −5,43 | ||||
| 2025-06-10 | 13F | Birchbrook, Inc. | 0 | −100,00 | 0 | |||||
| 2025-08-14 | 13F | Mml Investors Services, Llc | 3 314 | −6,52 | 0 | |||||
| 2025-08-08 | 13F | Kaizen Financial Strategies | 2 467 | −0,32 | 243 | 12,56 | ||||
| 2025-08-15 | 13F | Kestra Advisory Services, LLC | 21 396 | 13,02 | 2 103 | 27,45 | ||||
| 2025-08-15 | 13F | Morgan Stanley | 494 258 | 9,16 | 48 591 | 23,08 | ||||
| 2025-08-18 | 13F | Front Row Advisors LLC | 246 | −40,00 | 24 | −31,43 | ||||
| 2025-08-12 | 13F | Global Retirement Partners, LLC | 2 609 | 52,66 | 257 | 67,32 | ||||
| 2025-08-14 | 13F/A | Rockefeller Capital Management L.P. | 12 858 | −0,35 | 1 264 | 12,36 | ||||
| 2025-08-06 | 13F | Commonwealth Equity Services, Llc | 56 459 | −0,48 | 6 | 25,00 | ||||
| 2025-08-13 | 13F | Colonial Trust Co / SC | 3 181 | 0,00 | 313 | 12,64 | ||||
| 2025-07-02 | 13F | Capital Market Strategies LLC | 6 423 | −1,15 | 631 | 11,48 | ||||
| 2025-07-31 | 13F | Buckingham Strategic Partners | 2 361 | 0,08 | 232 | 13,17 | ||||
| 2025-08-13 | 13F/A | StoneX Group Inc. | 0 | −100,00 | 0 | −100,00 | ||||
| 2025-08-13 | 13F | Quadrature Capital Ltd | 2 872 | 6,02 | 282 | 20,00 | ||||
| 2025-07-17 | 13F | Gleason Group, Inc. | 306 | 0,00 | 30 | 15,38 | ||||
| 2025-04-14 | 13F | BCS Wealth Management | 0 | −100,00 | 0 | |||||
| 2025-08-14 | 13F | Jane Street Group, Llc | Put | 0 | −100,00 | 0 | ||||
| 2025-08-04 | 13F | Amplius Wealth Advisors, LLC | 3 630 | 0,64 | 357 | 13,38 | ||||
| 2025-08-07 | 13F | Curtis Advisory Group, LLC | 0 | −100,00 | 0 | |||||
| 2025-08-12 | 13F | Gladstone Institutional Advisory LLC | 4 422 | 0,00 | 435 | 12,73 | ||||
| 2025-08-14 | 13F | GWM Advisors LLC | 239 | 25,13 | 24 | 43,75 | ||||
| 2025-07-10 | 13F | Wealth Enhancement Advisory Services, Llc | 2 826 | −32,87 | 281 | −23,43 | ||||
| 2025-07-24 | 13F | Ronald Blue Trust, Inc. | 59 | 0,00 | 6 | 0,00 | ||||
| 2025-08-13 | 13F | Baird Financial Group, Inc. | 2 140 | −53,12 | 210 | −47,24 | ||||
| 2025-07-11 | 13F | Seacrest Wealth Management, Llc | 6 676 | −0,83 | 656 | 11,95 | ||||
| 2025-08-11 | 13F | Shoker Investment Counsel, Inc. | 17 212 | −10,12 | 1 692 | 1,38 | ||||
| 2025-08-18 | 13F | Wolverine Trading, Llc | 22 797 | 162,55 | 2 223 | 193,53 | ||||
| 2025-07-09 | 13F | Presidio Capital Management, LLC | 2 829 | −4,68 | 278 | 7,75 | ||||
| 2025-07-17 | 13F | Raleigh Capital Management Inc. | 0 | −100,00 | 0 | |||||
| 2025-05-14 | 13F | Smartleaf Asset Management LLC | 0 | −100,00 | 0 | |||||
| 2025-08-12 | 13F | Ameritas Investment Partners, Inc. | 10 633 | 11,71 | 1 045 | 26,06 | ||||
| 2025-08-12 | 13F | Change Path, LLC | 14 742 | 203,27 | 1 449 | 242,55 | ||||
| 2025-07-08 | 13F | Morris Retirement Advisors, LLC | 120 418 | 21,23 | 11 838 | 36,70 | ||||
| 2025-08-11 | 13F | Principal Securities, Inc. | 136 | −18,07 | 13 | −7,14 | ||||
| 2025-08-04 | 13F | Atria Investments Llc | 0 | −100,00 | 0 | |||||
| 2025-08-11 | 13F | Cascade Wealth Advisors, Inc | 2 555 | −20,28 | 249 | −7,09 | ||||
| 2025-06-26 | NP | SPECX - Alger Spectra Fund Class A | Short | −226 281 | −0,00 | −19 843 | −6,89 | |||
| 2025-07-23 | 13F | Sachetta, LLC | 115 | 0,00 | 11 | 10,00 | ||||
| 2025-07-22 | 13F | Diligent Investors, LLC | 0 | −100,00 | 0 | |||||
| 2025-08-14 | 13F | Warren Averett Asset Management, LLC | 11 756 | −1,01 | 1 156 | 11,59 | ||||
| 2025-07-15 | 13F | LeConte Wealth Management, LLC | 95 828 | −17,78 | 9 421 | −7,30 | ||||
| 2025-07-25 | 13F | Envestnet Portfolio Solutions, Inc. | 0 | −100,00 | 0 | |||||
| 2025-08-14 | 13F | Royal Bank Of Canada | 107 896 | −65,22 | 10 607 | −60,79 | ||||
| 2025-08-14 | 13F | Comerica Bank | 13 884 | 2,87 | 1 365 | 15,99 | ||||
| 2025-08-14 | 13F | Evergreen Capital Management Llc | 3 542 | 0,00 | 349 | 12,62 | ||||
| 2025-05-01 | 13F | Steel Peak Wealth Management LLC | 0 | −100,00 | 0 | |||||
| 2025-08-14 | 13F | Cascades Capital Asset Management, LLC | 4 794 | 471 | ||||||
| 2025-08-13 | 13F | First Trust Advisors Lp | 4 197 | 413 | ||||||
| 2025-05-12 | 13F | Meitav Dash Investments Ltd | 0 | −100,00 | 0 | |||||
| 2025-08-06 | 13F | North Capital, Inc. | 50 | 0,00 | 5 | 0,00 | ||||
| 2025-08-14 | 13F | Raymond James Financial Inc | 31 196 | −0,25 | 3 067 | 12,47 | ||||
| 2025-07-15 | 13F | Oxinas Partners Wealth Management LLC | 7 729 | −8,65 | 760 | 2,99 | ||||
| 2025-07-30 | 13F | Crewe Advisors LLC | 1 380 | 0,00 | 136 | 12,50 | ||||
| 2025-07-21 | 13F | DHJJ Financial Advisors, Ltd. | 3 911 | 5,67 | 384 | 19,25 | ||||
| 2025-08-14 | 13F | Raymond James Financial Inc | Put | 200 | 19 | |||||
| 2025-07-14 | 13F | Abound Wealth Management | 92 | 0,00 | 9 | 12,50 | ||||
| 2025-08-12 | 13F | Tradition Wealth Management, LLC | 16 545 | −12,62 | 1 627 | −1,45 | ||||
| 2025-08-14 | 13F | STAR Financial Bank | 4 336 | 426 | ||||||
| 2025-08-14 | 13F | Riggs Asset Managment Co. Inc. | 36 | 0,00 | 4 | 0,00 | ||||
| 2025-07-10 | 13F | Fulton Bank, N.a. | 8 902 | 2,85 | 875 | 16,05 | ||||
| 2025-04-25 | 13F | New Wave Wealth Advisors Llc | 0 | −100,00 | 0 | |||||
| 2025-08-18 | 13F | Geneos Wealth Management Inc. | 429 | 0,00 | 42 | 13,51 | ||||
| 2025-07-08 | 13F | Prism Advisors, Inc. | 12 799 | 1 258 | ||||||
| 2025-08-12 | 13F | Mystic Asset Management, Inc. | 13 565 | 0,74 | 1 334 | 13,54 | ||||
| 2025-08-12 | 13F | Steward Partners Investment Advisory, Llc | 92 | 0,00 | 9 | 12,50 | ||||
| 2025-07-21 | 13F | Ameritas Advisory Services, LLC | 23 072 | 4,86 | 2 268 | 17,63 | ||||
| 2025-08-14 | 13F | Beaird Harris Wealth Management, LLC | 624 | 0,00 | 61 | 12,96 | ||||
| 2025-08-08 | 13F | MTM Investment Management, LLC | 6 060 | 8,16 | 596 | 21,18 | ||||
| 2025-08-11 | 13F | Blue Bell Private Wealth Management, Llc | 454 | 1,11 | 45 | 12,82 | ||||
| 2025-06-30 | NP | ASTIX - Astor Dynamic Allocation Fund Class I shares | 30 322 | 0,00 | 2 659 | −6,90 | ||||
| 2025-08-18 | 13F | Wolverine Trading, Llc | Call | 0 | −100,00 | 0 | −100,00 | |||
| 2025-08-14 | 13F | Susquehanna International Group, Llp | Put | 10 600 | 1 042 | |||||
| 2025-05-07 | 13F | Allen Investment Management LLC | 0 | −100,00 | 0 | −100,00 | ||||
| 2025-08-14 | 13F | Susquehanna International Group, Llp | 19 378 | −8,06 | 1 905 | 3,70 | ||||
| 2025-05-06 | 13F | Rothschild & Co Wealth Management UK Ltd | 0 | −100,00 | 0 | |||||
| 2025-08-14 | 13F | Susquehanna International Group, Llp | Call | 15 200 | 52,00 | 1 494 | 71,53 | |||
| 2025-08-06 | 13F | Paulson Wealth Management Inc. | 4 827 | −8,72 | 475 | 2,82 | ||||
| 2025-09-15 | 13F/A | Migdal Insurance & Financial Holdings Ltd. | 8 174 | −9,06 | 1 | |||||
| 2025-08-14 | 13F | Fmr Llc | 2 198 | −13,23 | 216 | −1,82 | ||||
| 2025-08-07 | 13F | Allworth Financial LP | 0 | 0 | ||||||
| 2025-08-14 | 13F | Beck Capital Management, Llc | 14 685 | −21,12 | 1 444 | −11,09 | ||||
| 2025-04-22 | 13F | RFP Financial Group LLC | 0 | −100,00 | 0 | |||||
| 2025-08-11 | 13F | TD Waterhouse Canada Inc. | 4 800 | 86,05 | 472 | 109,33 | ||||
| 2025-08-12 | 13F | Waddell & Associates, Llc | 395 063 | 2,13 | 38 839 | 15,15 | ||||
| 2025-08-05 | 13F | Simplex Trading, Llc | 256 | 0 | ||||||
| 2025-08-14 | 13F | IHT Wealth Management, LLC | 4 829 | 475 | ||||||
| 2025-08-08 | 13F | Cetera Investment Advisers | 27 739 | −4,10 | 2 727 | 8,13 | ||||
| 2025-08-08 | 13F | Calamos Advisors LLC | Call | 33 400 | 75,79 | 2 912 | 70,79 | |||
| 2025-08-14 | 13F | Capstone Investment Advisors, Llc | 9 045 | −47,43 | 889 | −40,73 | ||||
| 2025-05-13 | 13F | Heck Capital Advisors, LLC | 0 | −100,00 | 0 | −100,00 | ||||
| 2025-08-14 | 13F | Citadel Advisors Llc | Put | 0 | −100,00 | 0 | ||||
| 2025-08-14 | 13F | Citadel Advisors Llc | Call | 0 | −100,00 | 0 | ||||
| 2025-07-31 | 13F | LJI Wealth Management, LLC | 2 321 | 0,00 | 228 | 12,87 | ||||
| 2025-06-10 | 13F/A | Militia Capital Partners, LP | 0 | −100,00 | 0 | −100,00 | ||||
| 2025-08-14 | 13F | Private Capital Management, LLC | 9 966 | 6,32 | 980 | 19,83 | ||||
| 2025-07-28 | 13F | Triton Wealth Management, PLLC | 0 | −100,00 | 0 | |||||
| 2025-07-30 | 13F | St. Johns Investment Management Company, LLC | 30 | 0,00 | 3 | 0,00 | ||||
| 2025-05-12 | 13F | Waterloo Capital, L.P. | 0 | −100,00 | 0 | |||||
| 2025-07-31 | 13F | PKO Investment Management Joint-Stock Co | 100 000 | −76,19 | 9 831 | −73,15 | ||||
| 2025-07-29 | NP | EBI - Longview Advantage ETF | 0 | −100,00 | 0 | −100,00 | ||||
| 2025-07-17 | 13F | Janney Montgomery Scott LLC | 2 091 | 0 | ||||||
| 2025-08-14 | 13F | UBS Group AG | 190 843 | −10,16 | 18 762 | 1,30 | ||||
| 2025-07-22 | 13F | Hickory Asset Management, Inc. | 0 | −100,00 | 0 | |||||
| 2025-07-01 | 13F | Burkett Financial Services, Llc | 0 | −100,00 | 0 | |||||
| 2025-08-01 | 13F | Anson Capital, Inc. | 2 858 | 281 | ||||||
| 2025-07-25 | 13F | Astoria Portfolio Advisors LLC. | 2 692 | −1,97 | 269 | 16,96 | ||||
| 2025-08-14 | 13F | Citadel Advisors Llc | 0 | −100,00 | 0 | |||||
| 2025-07-17 | 13F | HB Wealth Management, LLC | 16 440 | 0,00 | 1 616 | 12,77 | ||||
| 2025-08-11 | 13F | Mill Creek Capital Advisors, LLC | 4 522 | 0,00 | 445 | 12,69 | ||||
| 2025-08-14 | 13F | Frisch Financial Group, Inc. | 225 817 | −6,12 | 22 | 10,00 | ||||
| 2025-08-07 | 13F | Parkside Financial Bank & Trust | 434 | 43 | ||||||
| 2025-08-14 | 13F | Stifel Financial Corp | 4 059 | −0,59 | 399 | 12,39 | ||||
| 2025-08-28 | NP | TFAFX - Tactical Growth Allocation Fund Class I | 430 | −86,56 | 42 | −84,95 | ||||
| 2025-08-06 | 13F | Kcm Investment Advisors Llc | 2 210 | 217 | ||||||
| 2025-07-23 | 13F | Traphagen Investment Advisors Llc | 4 515 | 2,80 | 444 | 15,97 | ||||
| 2025-08-13 | 13F | GeoWealth Management, LLC | 0 | −100,00 | 0 | |||||
| 2025-06-02 | 13F/A | Deutsche Bank Ag\ | 0 | −100,00 | 0 | |||||
| 2025-08-14 | 13F | D. E. Shaw & Co., Inc. | 6 483 | 0,00 | 637 | 12,74 | ||||
| 2025-08-08 | 13F | SBI Securities Co., Ltd. | 54 | −80,65 | 5 | −79,17 | ||||
| 2025-05-01 | 13F | Quest 10 Wealth Builders, Inc. | 224 | 0,00 | 20 | −5,00 | ||||
| 2025-07-24 | 13F | IFP Advisors, Inc | 2 227 | 7,69 | 219 | 21,11 | ||||
| 2025-07-28 | 13F | Axxcess Wealth Management, Llc | 0 | −100,00 | 0 | |||||
| 2025-08-05 | 13F | American Capital Advisory, LLC | 792 | 49,15 | 78 | 67,39 | ||||
| 2025-08-12 | 13F | Integrated Advisors Network LLC | 2 653 | −8,49 | 261 | 3,17 | ||||
| 2025-05-08 | 13F | Us Bancorp \de\ | 0 | −100,00 | 0 | |||||
| 2025-07-25 | 13F | Cwm, Llc | 13 349 | 138,55 | 1 | |||||
| 2025-05-29 | NP | TFAQX - TFA Quantitative Fund Class I | 13 500 | 3,05 | 1 177 | 1,29 | ||||
| 2025-07-25 | 13F | Total Clarity Wealth Management, Inc. | 2 037 | 200 | ||||||
| 2025-07-22 | 13F | BridgePort Financial Solutions, LLC | 2 255 | 222 | ||||||
| 2025-05-14 | 13F | Monterey Private Wealth, Inc. | 3 700 | −3,57 | 323 | −6,40 | ||||
| 2025-07-18 | 13F | QTR Family Wealth, LLC | 14 685 | −0,13 | 1 444 | 12,56 | ||||
| 2025-08-08 | 13F | Creative Planning | 43 504 | −12,07 | 4 277 | −0,86 | ||||
| 2025-07-17 | 13F | Global Trust Asset Management, LLC | 423 | 0,00 | 42 | 13,89 | ||||
| 2025-05-15 | 13F | Hilltop Holdings Inc. | 0 | −100,00 | 0 | |||||
| 2025-08-08 | 13F | IMA Wealth, Inc. | 63 | 0,00 | 6 | 20,00 | ||||
| 2025-08-11 | 13F | Nations Financial Group Inc, /ia/ /adv | 48 286 | −5,61 | 4 747 | 6,43 | ||||
| 2025-07-11 | 13F | Kaydan Wealth Management, Inc. | 2 397 | 0,00 | 236 | 12,98 | ||||
| 2025-06-26 | NP | KCEVX - Knights of Columbus Long/Short Equity Fund Investor Shares | Short | −88 919 | −7 797 | |||||
| 2025-07-14 | 13F | Legacy Capital Group California, Inc. | 0 | −100,00 | 0 | |||||
| 2025-07-07 | 13F | Investors Research Corp | 57 | 0,00 | 6 | 25,00 | ||||
| 2025-08-14 | 13F | Endurance Services Ltd | 347 500 | 0,00 | 34 163 | 12,75 | ||||
| 2025-08-15 | 13F | Tower Research Capital LLC (TRC) | 31 263 | 468,73 | 3 073 | 541,54 | ||||
| 2025-08-13 | 13F | Gateway Wealth Partners, LLC | 25 940 | −0,49 | 2 550 | 12,24 | ||||
| 2025-09-04 | 13F/A | Advisor Group Holdings, Inc. | 39 139 | 27,82 | 3 850 | 44,25 | ||||
| 2025-07-14 | 13F | Brady Martz Wealth Solutions, LLC | 2 361 | 0,04 | 232 | 13,17 | ||||
| 2025-08-18 | 13F | Goodman Advisory Group, LLC | 300 | −25,74 | 29 | −17,14 | ||||
| 2025-07-31 | 13F | Cambridge Investment Research Advisors, Inc. | 15 420 | 16,77 | 2 | 0,00 | ||||
| 2025-08-06 | 13F | AE Wealth Management LLC | 0 | −100,00 | 0 | |||||
| 2025-07-22 | 13F | DT Investment Partners, LLC | 1 051 | 0,00 | 103 | 13,19 | ||||
| 2025-07-18 | 13F | Astor Investment Management LLC | 0 | −100,00 | 0 |