Grundläggande statistik
| Institutionella ägare | 212 total, 212 long only, 0 short only, 0 long/short - change of 1,44% MRQ |
| Genomsnittlig portföljallokering | 0.9632 % - change of 2,25% MRQ |
| Institutionella aktier (lång) | 36 112 159 (ex 13D/G) - change of 1,46MM shares 4,21% MRQ |
| Institutionellt värde (lång) | $ 2 280 544 USD ($1000) |
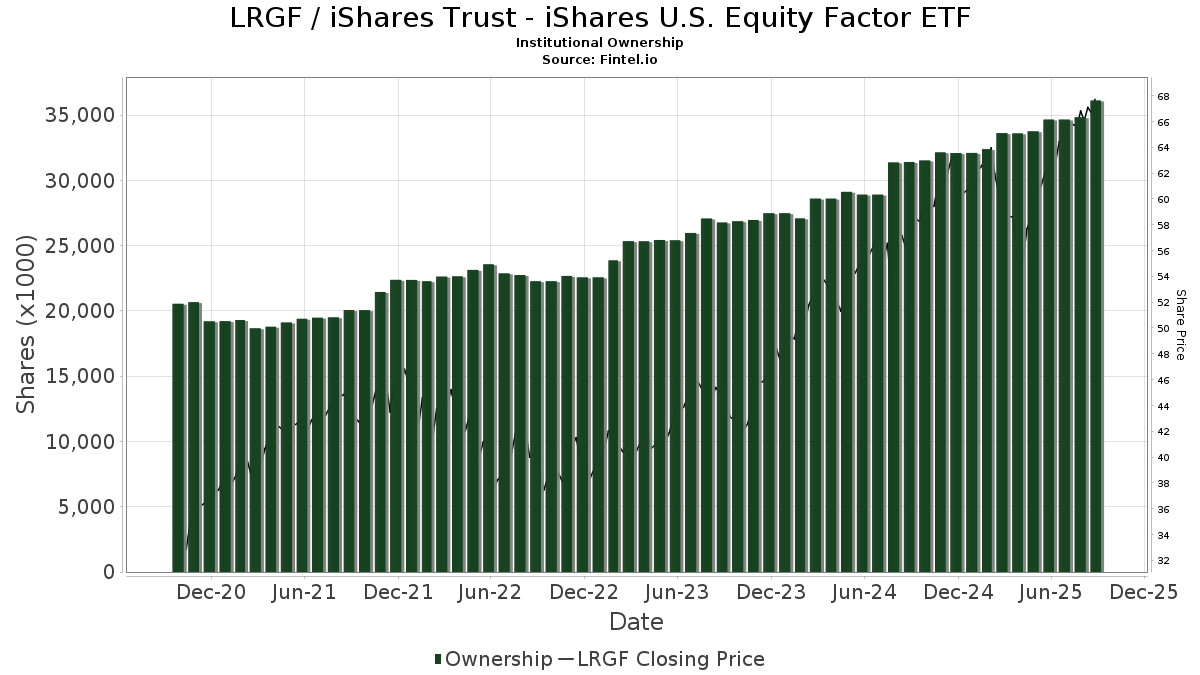
Institutionellt ägande och aktieägare
iShares Trust - iShares U.S. Equity Factor ETF (US:LRGF) har 212 Institutionella ägare och aktieägare som har lämnat in 13D/G- eller 13F-formulär till Securities Exchange Commission (SEC). Dessa institut innehar totalt 36,112,159 aktier. Största aktieägare inkluderar Strategic Financial Services, Inc,, Halbert Hargrove Global Advisors, Llc, Tolleson Wealth Management, Inc., Wells Fargo & Company/mn, SigFig Wealth Management, LLC, Plancorp, LLC, Ullmann Financial Group, Inc., Jpmorgan Chase & Co, Integrated Wealth Concepts LLC, and Clearwater Capital Advisors, LLC .
iShares Trust - iShares U.S. Equity Factor ETF (ARCA:LRGF) Institutionell ägarstruktur visar institutioners och fonders nuvarande positioner i företaget, samt de senaste förändringarna i positionernas storlek. Större aktieägare kan vara enskilda investerare, fonder, hedgefonder eller institutioner. Bilaga 13D visar att investeraren äger (eller ägde) mer än 5% av företaget och avser (eller avsåg) att aktivt eftersträva en förändring av affärsstrategin. Schedule 13G indikerar en passiv investering på över 5%.
The share price as of September 12, 2025 is 68,23 / share. Previously, on September 16, 2024, the share price was 57,63 / share. This represents an increase of 18,39% over that period.
Fondsentimentets poäng
Fondsentimentet poängen(fka Ägarackumulation-poäng) visar vilka aktier som är mest köpta av fonder. Det är resultatet av en sofistikerad kvantitativ flerfaktormodell som identifierar företag med de högsta nivåerna av institutionell ackumulering. Poängsättningsmodellen använder en kombination av den totala ökningen av redovisade ägare, förändringarna i portföljallokeringarna för dessa ägare och andra mått. Siffran sträcker sig från 0 till 100, där högre siffror indikerar en högre nivå av ackumulering i förhållande till sina konkurrenter, och 50 är genomsnittet.
Uppdateringsfrekvens: Dagligen
Se Ownership Explorer, som innehåller en lista över de högst rankade företagen.
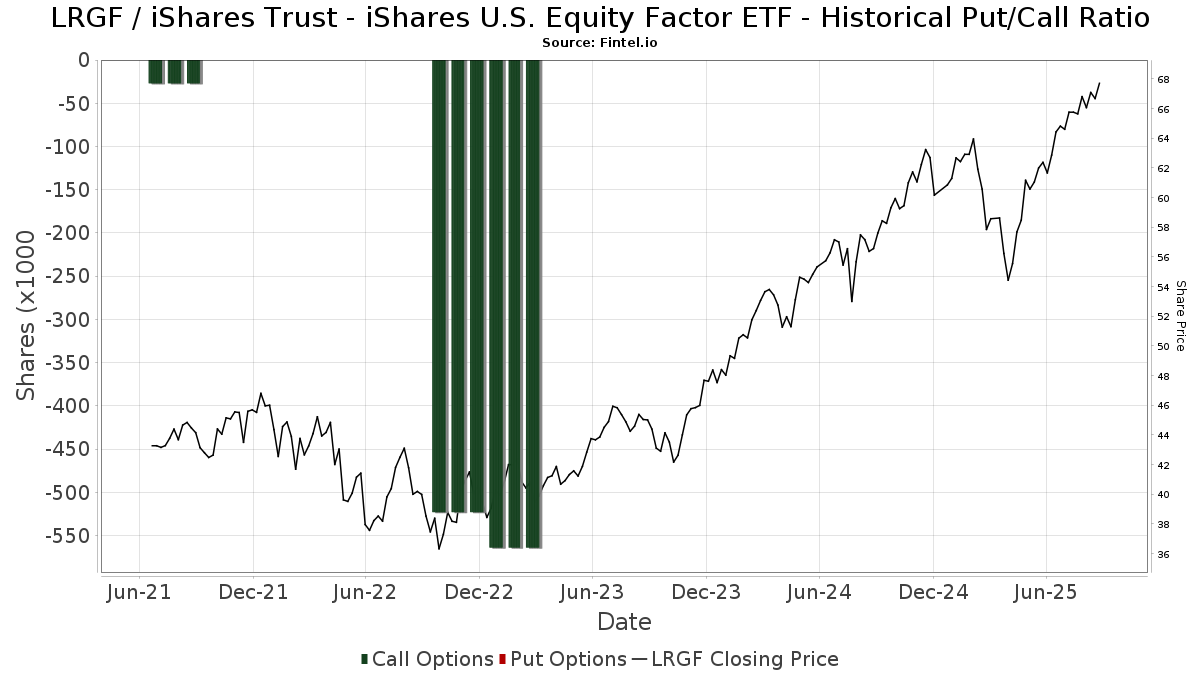
Institutionell sälj/köp-kvot
Förutom att rapportera vanliga eget kapital- och skuldemissioner måste institutioner med mer än 100MM tillgångar under förvaltning också avslöja sina innehav av sälj- och köpoptioner. Eftersom säljoptioner i allmänhet indikerar ett negativt sentiment och köpoptioner indikerar ett positivt sentiment, kan vi få en uppfattning om det övergripande institutionella sentimentet genom att plotta förhållandet mellan säljoptioner och köpoptioner. Diagrammet till höger visar det historiska förhållandet mellan sälj- och köpoptioner för detta instrument.
Genom att använda sälj/köp-kvoten som en indikator på aktieägarnas sentiment undviker man en av de största bristerna med att använda det totala institutionella ägandet, nämligen att en betydande del av de förvaltade tillgångarna investeras passivt för att följa index. Passivt förvaltade fonder köper vanligtvis inte optioner, så indikatorn för sälj/köp-kvoten ger en bättre bild av stämningen i aktivt förvaltade fonder.
13F- och NPORT-arkiveringar
Detaljer om 13F-arkiveringar är gratis. Detaljer om NP-arkiveringar kräver ett premiummedlemskap. Gröna rader indikerar nya positioner. Röda rader indikerar stängda positioner. Klicka på länk symbolen för att se hela transaktionshistoriken.
Uppgradera
för att låsa upp premiumdata och exportera till Excel ![]() .
.
| Fil Datum | Källa | Investerare | Typ | Genomsnittligt pris (beräknat) |
Aktier | Δ Aktier (%) |
Rapporterat värde (1000 USD) |
Δ Värde (%) |
Portföljallokering (%) |
|
|---|---|---|---|---|---|---|---|---|---|---|
| 2025-08-11 | 13F | Brown Brothers Harriman & Co | 342 | 0,00 | 22 | 10,53 | ||||
| 2025-08-14 | 13F | Susquehanna International Group, Llp | 0 | −100,00 | 0 | |||||
| 2025-07-18 | 13F | SigFig Wealth Management, LLC | 1 978 894 | 0,10 | 126 035 | 10,82 | ||||
| 2025-08-07 | 13F | Addison Advisors LLC | 68 370 | −1,34 | 4 385 | 9,33 | ||||
| 2025-07-15 | 13F | Cora Capital Advisors Llc | 485 100 | 0,48 | 31 109 | 11,33 | ||||
| 2025-07-18 | 13F | Bartlett & Co. Wealth Management Llc | 0 | −100,00 | 0 | |||||
| 2025-08-14 | 13F | GWM Advisors LLC | 16 384 | 6,72 | 1 051 | 18,24 | ||||
| 2025-07-22 | 13F | Ergawealth Advisors, Inc. | 5 082 | −22,71 | 326 | −14,47 | ||||
| 2025-07-16 | 13F | Plancorp, LLC | 1 742 913 | 9,35 | 111 773 | 21,16 | ||||
| 2025-07-16 | 13F | Signaturefd, Llc | 23 | 1 | ||||||
| 2025-08-14 | 13F | Wells Fargo & Company/mn | 1 990 663 | 5,92 | 127 661 | 17,36 | ||||
| 2025-07-24 | 13F | Capital Advisors, Ltd. LLC | 4 911 | −3,78 | 0 | |||||
| 2025-08-13 | 13F | Cheviot Value Management, LLC | 40 | 0,00 | 3 | 0,00 | ||||
| 2025-08-14 | 13F | Diversify Advisory Services, LLC | 49 016 | −2,95 | 3 263 | 12,33 | ||||
| 2025-07-14 | 13F | Sowell Financial Services LLC | 8 968 | −0,09 | 575 | 10,79 | ||||
| 2025-07-08 | 13F | RMR Wealth Builders | 13 550 | 869 | ||||||
| 2025-08-04 | 13F | Assetmark, Inc | 941 | −80,42 | 60 | −78,42 | ||||
| 2025-08-11 | 13F | Private Advisor Group, LLC | 12 573 | −0,05 | 806 | 10,71 | ||||
| 2025-08-13 | 13F | Cerity Partners LLC | 51 042 | 0,34 | 3 273 | 11,18 | ||||
| 2025-09-04 | 13F/A | Advisor Group Holdings, Inc. | 582 939 | 258,47 | 37 369 | 297,04 | ||||
| 2025-08-12 | 13F | BlackRock, Inc. | 141 058 | −0,03 | 9 046 | 10,78 | ||||
| 2025-08-08 | 13F | Kingsview Wealth Management, LLC | 67 197 | −1,14 | 4 309 | 9,53 | ||||
| 2025-08-14 | 13F | Goldman Sachs Group Inc | 32 633 | −26,44 | 2 093 | −18,50 | ||||
| 2025-08-15 | 13F | Kestra Advisory Services, LLC | 8 663 | 43,81 | 556 | 59,48 | ||||
| 2025-08-13 | 13F | EverSource Wealth Advisors, LLC | 2 359 | 0,30 | 151 | 11,03 | ||||
| 2025-08-07 | 13F | Weil Company, Inc. | 8 322 | −52,23 | 534 | −47,12 | ||||
| 2025-07-07 | 13F | Versant Capital Management, Inc | 12 962 | 0,00 | 831 | 10,80 | ||||
| 2025-08-06 | 13F | Rialto Wealth Management, LLC | 359 | 0,00 | 23 | 15,00 | ||||
| 2025-08-14 | 13F | Strategic Wealth Designers | 0 | 0 | ||||||
| 2025-07-15 | 13F | Mather Group, Llc. | 0 | −100,00 | 0 | |||||
| 2025-08-13 | 13F | Cary Street Partners Financial Llc | 7 959 | −1,96 | 510 | 8,74 | ||||
| 2025-08-01 | 13F | Strategic Financial Services, Inc, | 3 821 219 | 2,55 | 245 055 | 13,62 | ||||
| 2025-08-14 | 13F | Qube Research & Technologies Ltd | 5 864 | 376 | ||||||
| 2025-08-28 | 13F/A | Tolleson Wealth Management, Inc. | 2 099 726 | 11,45 | 134 655 | 23,48 | ||||
| 2025-07-23 | 13F | Bellevue Asset Management, Llc | 648 | 0,15 | 42 | 10,81 | ||||
| 2025-07-30 | 13F | Family Capital Trust Co | 161 174 | −0,41 | 10 336 | 10,34 | ||||
| 2025-08-14 | 13F | Jane Street Group, Llc | 7 367 | −79,11 | 472 | −76,87 | ||||
| 2025-08-14 | 13F | Royal Bank Of Canada | 102 633 | 14,67 | 6 582 | 27,07 | ||||
| 2025-08-14 | 13F | Guardian Wealth Advisors, Llc / Nc | 452 | 0,00 | 29 | 7,69 | ||||
| 2025-07-07 | 13F | Investors Research Corp | 86 | 0,00 | 6 | 25,00 | ||||
| 2025-07-08 | 13F | Parallel Advisors, LLC | 121 446 | 21,75 | 7 788 | 34,90 | ||||
| 2025-08-08 | 13F | Avalon Trust Co | 580 | 0,00 | 37 | 12,12 | ||||
| 2025-08-13 | 13F | MONECO Advisors, LLC | 26 909 | −1,85 | 1 726 | 8,76 | ||||
| 2025-08-01 | 13F | Bank of Jackson Hole Trust | 0 | −100,00 | 0 | |||||
| 2025-07-09 | 13F | Market Street Wealth Management Advisors Llc | 34 301 | −11,81 | 2 200 | −2,31 | ||||
| 2025-07-25 | 13F | Tranquility Partners, LLC | 12 615 | 0,00 | 809 | 10,82 | ||||
| 2025-08-14 | 13F | Mml Investors Services, Llc | 11 758 | −24,39 | 1 | |||||
| 2025-07-17 | 13F | HB Wealth Management, LLC | 122 769 | −17,06 | 7 873 | −8,10 | ||||
| 2025-08-15 | 13F | Morgan Stanley | 622 359 | −9,35 | 39 912 | 0,43 | ||||
| 2025-08-04 | 13F | Creative Financial Designs Inc /adv | 477 | 0,00 | 31 | 11,11 | ||||
| 2025-05-07 | 13F | Wincap Financial Llc | 0 | −100,00 | 0 | −100,00 | ||||
| 2025-08-14 | 13F | Aqr Capital Management Llc | 60 423 | −12,01 | 3 875 | −2,52 | ||||
| 2025-07-31 | 13F | AlTi Global, Inc. | 92 851 | −35,92 | 5 955 | −29,00 | ||||
| 2025-08-12 | 13F | Steward Partners Investment Advisory, Llc | 4 522 | 0,00 | 290 | 10,73 | ||||
| 2025-07-25 | 13F | Envestnet Portfolio Solutions, Inc. | 5 328 | 0,00 | 342 | 10,71 | ||||
| 2025-08-14 | 13F | Atomi Financial Group, Inc. | 731 834 | 4,95 | 46 932 | 16,28 | ||||
| 2025-07-10 | 13F | Anderson Hoagland & Co | 4 197 | 0,00 | 269 | 25,12 | ||||
| 2025-08-12 | 13F | Park Square Financial Group, LLC | 7 | 0,00 | 0 | |||||
| 2025-05-13 | 13F | Keystone Financial Group | 0 | −100,00 | 0 | |||||
| 2025-07-25 | 13F | NorthRock Partners, LLC | 5 618 | 0,00 | 360 | 10,77 | ||||
| 2025-05-13 | 13F | Northern Trust Corp | 0 | −100,00 | 0 | −100,00 | ||||
| 2025-07-18 | 13F | Ewa, Llc | 508 281 | 3,81 | 32 596 | 15,02 | ||||
| 2025-08-14 | 13F | Ieq Capital, Llc | 5 395 | 346 | ||||||
| 2025-07-23 | 13F | Prime Capital Investment Advisors, LLC | 4 158 | 0,17 | 267 | 10,83 | ||||
| 2025-08-07 | 13F | Allworth Financial LP | 44 580 | −5,43 | 2 859 | 6,96 | ||||
| 2025-08-14 | 13F | Betterment LLC | 24 567 | −0,85 | 2 | 0,00 | ||||
| 2025-08-19 | 13F | Advisory Services Network, LLC | 16 798 | −12,24 | 1 101 | −0,63 | ||||
| 2025-08-14 | 13F | Fmr Llc | 11 868 | 11,21 | 761 | 23,34 | ||||
| 2025-08-06 | 13F | Commonwealth Equity Services, Llc | 129 193 | −26,58 | 8 | −20,00 | ||||
| 2025-08-12 | 13F | GDS Wealth Management | 3 127 | 201 | ||||||
| 2025-08-14 | 13F | Wiley Bros.-aintree Capital, Llc | 7 568 | −3,53 | 481 | 6,65 | ||||
| 2025-07-14 | 13F | UMA Financial Services, Inc. | 39 249 | 2,41 | 2 517 | 13,48 | ||||
| 2025-08-15 | 13F | CI Private Wealth, LLC | 133 226 | 1,26 | 8 544 | 12,20 | ||||
| 2025-08-15 | 13F | Captrust Financial Advisors | 115 469 | 205,77 | 7 405 | 238,90 | ||||
| 2025-07-31 | 13F | Cambridge Investment Research Advisors, Inc. | 28 335 | −0,88 | 2 | 0,00 | ||||
| 2025-08-06 | 13F | DDFG, Inc | 218 849 | 2,25 | 14 035 | 13,29 | ||||
| 2025-08-05 | 13F | Bank Of Montreal /can/ | 95 | 0,00 | 6 | 20,00 | ||||
| 2025-07-24 | 13F | Jfs Wealth Advisors, Llc | 22 084 | −7,52 | 1 416 | 2,46 | ||||
| 2025-08-14 | 13F | Ameriprise Financial Inc | 776 204 | 2,98 | 49 777 | 14,10 | ||||
| 2025-08-18 | 13F | Hershey Financial Advisers, LLC | 25 141 | −9,78 | 1 612 | −4,10 | ||||
| 2025-07-24 | 13F | Us Bancorp \de\ | 193 | 0,00 | 12 | 9,09 | ||||
| 2025-07-28 | 13F | Boston Trust Walden Corp | 5 045 | 0,00 | 324 | 10,62 | ||||
| 2025-08-14 | 13F | Win Advisors, Inc | 63 421 | 99,04 | 4 067 | 120,55 | ||||
| 2025-08-13 | 13F | Continuum Advisory, LLC | 0 | −100,00 | 0 | |||||
| 2025-08-07 | 13F | Vise Technologies, Inc. | 56 094 | 3 597 | ||||||
| 2025-08-13 | 13F | Colonial Trust Advisors | 3 494 | −9,90 | 224 | 0,00 | ||||
| 2025-08-12 | 13F | Change Path, LLC | 8 177 | −4,74 | 524 | 5,65 | ||||
| 2025-07-23 | 13F | L.K. Benson & Company, P.C. | 4 958 | 0,14 | 318 | 10,84 | ||||
| 2025-07-17 | 13F | LifeGoal Wealth Advisors | 155 356 | 34,14 | 9 963 | 48,66 | ||||
| 2025-08-06 | 13F | Wsfs Capital Management, Llc | 3 747 | 240 | ||||||
| 2025-08-14 | 13F | Sunbelt Securities, Inc. | 1 164 | 2,37 | 70 | 7,69 | ||||
| 2025-04-22 | 13F | Synergy Financial Management, LLC | 0 | −100,00 | 0 | |||||
| 2025-07-16 | 13F | Brown, Lisle/cummings, Inc. | 210 | 0,00 | 13 | 8,33 | ||||
| 2025-08-11 | 13F | Aptus Capital Advisors, LLC | 4 140 | 0,00 | 266 | 10,88 | ||||
| 2025-08-12 | 13F | MAI Capital Management | 4 483 | −1,86 | 288 | 8,71 | ||||
| 2025-08-14 | 13F | First Foundation Advisors | 17 632 | 0,00 | 1 131 | 10,78 | ||||
| 2025-07-17 | 13F | Halbert Hargrove Global Advisors, Llc | 3 401 663 | 0,32 | 218 149 | 11,16 | ||||
| 2025-07-25 | 13F | Cwm, Llc | 93 533 | 0,27 | 6 | 0,00 | ||||
| 2025-08-05 | 13F | Integrity Financial Corp /WA | 591 | 0,00 | 38 | 8,82 | ||||
| 2025-07-17 | 13F | Janney Montgomery Scott LLC | 8 055 | −1,52 | 1 | |||||
| 2025-07-14 | 13F | Conrad Siegel Investment Advisors, Inc. | 369 031 | −10,23 | 23 666 | −0,54 | ||||
| 2025-08-06 | 13F | AE Wealth Management LLC | 325 | 0,00 | 21 | 11,11 | ||||
| 2025-07-29 | 13F | Commons Capital, Llc | 0 | −100,00 | 0 | |||||
| 2025-07-22 | 13F | Merit Financial Group, LLC | 14 316 | 3,02 | 918 | 14,18 | ||||
| 2025-08-05 | 13F | Carolinas Wealth Consulting Llc | 0 | −100,00 | 0 | −100,00 | ||||
| 2025-08-06 | 13F | Stokes Family Office, LLC | 41 682 | −85,49 | 2 673 | −83,92 | ||||
| 2025-07-31 | 13F | Wealthfront Advisers Llc | 6 934 | 445 | ||||||
| 2025-07-24 | 13F | Blair William & Co/il | 891 | 0,00 | 57 | 11,76 | ||||
| 2025-08-08 | 13F | Hartland & Co., LLC | 1 527 | 0,00 | 98 | 10,23 | ||||
| 2025-07-25 | 13F | Hemington Wealth Management | 2 117 | 0,00 | 0 | |||||
| 2025-08-18 | 13F/A | Kestra Investment Management, LLC | 478 100 | 9,49 | 30 661 | 21,31 | ||||
| 2025-07-09 | 13F | GSG Advisors LLC | 25 992 | −11,78 | 1 667 | 0,60 | ||||
| 2025-07-28 | 13F | Pettinga Financial Advisors, LLC | 442 817 | −2,58 | 28 398 | 7,94 | ||||
| 2025-07-21 | 13F | Sterling Investment Counsel, LLC | 0 | −100,00 | 0 | |||||
| 2025-08-14 | 13F | Stifel Financial Corp | 21 382 | −6,47 | 1 371 | 3,63 | ||||
| 2025-07-29 | 13F | Foster & Motley Inc | 206 060 | −1,69 | 13 | 8,33 | ||||
| 2025-08-13 | 13F | Capital Analysts, Inc. | 5 576 | 0,00 | 0 | |||||
| 2025-08-04 | 13F | Hantz Financial Services, Inc. | 150 | 0 | ||||||
| 2025-08-14 | 13F | Obsido Oy | 140 452 | 4,57 | 9 007 | 15,86 | ||||
| 2025-08-11 | 13F | Wealthspire Advisors, LLC | 52 092 | −0,34 | 3 341 | 10,41 | ||||
| 2025-08-12 | 13F | O'shaughnessy Asset Management, Llc | 4 526 | −22,58 | 290 | −14,20 | ||||
| 2025-08-14 | 13F | UBS Group AG | 33 970 | −7,76 | 2 178 | 2,21 | ||||
| 2025-08-14 | 13F | Smartleaf Asset Management LLC | 323 | −59,68 | 21 | −56,52 | ||||
| 2025-08-12 | 13F | Clearwater Capital Advisors, LLC | 1 067 110 | 0,59 | 68 434 | 11,45 | ||||
| 2025-07-29 | 13F | Signature Estate & Investment Advisors Llc | 107 992 | −3,72 | 6 926 | 6,69 | ||||
| 2025-07-17 | 13F | Wolff Wiese Magana Llc | 420 | 0,00 | 27 | 8,33 | ||||
| 2025-07-17 | 13F | Nova R Wealth, Inc. | 100 637 | 0,26 | 6 454 | 11,09 | ||||
| 2025-07-07 | 13F | Nova Wealth Management, Inc. | 148 | 9,63 | 9 | 28,57 | ||||
| 2025-08-06 | 13F | Quadrant Private Wealth Management, LLC | 10 196 | −29,94 | 654 | −22,45 | ||||
| 2025-05-15 | 13F | Two Sigma Securities, Llc | 0 | −100,00 | 0 | |||||
| 2025-08-14 | 13F | Raymond James Financial Inc | 119 819 | 2,18 | 7 684 | 13,22 | ||||
| 2025-08-18 | 13F | Geneos Wealth Management Inc. | 1 677 | 0,00 | 108 | 10,31 | ||||
| 2025-08-11 | 13F | Wescott Financial Advisory Group, LLC | 79 263 | −5,40 | 5 083 | 4,83 | ||||
| 2025-08-14 | 13F | Colony Group, LLC | 541 548 | 4,24 | 34 730 | 15,50 | ||||
| 2025-08-14 | 13F | Money Concepts Capital Corp | 0 | −100,00 | 0 | |||||
| 2025-08-01 | 13F | Envestnet Asset Management Inc | 496 049 | 9,90 | 31 812 | 21,77 | ||||
| 2025-07-23 | 13F | Columbus Macro, LLC | 4 143 | 266 | ||||||
| 2025-07-29 | 13F | ShoreHaven Wealth Partners, LLC | 78 573 | −2,95 | 5 039 | 7,53 | ||||
| 2025-08-14 | 13F | Quantinno Capital Management LP | 86 236 | 4,18 | 5 530 | 15,45 | ||||
| 2025-07-16 | 13F | ORG Partners LLC | 317 | 0,32 | 20 | 11,11 | ||||
| 2025-07-09 | 13F | Intelligence Driven Advisers, LLC | 23 381 | 34,79 | 1 499 | 49,45 | ||||
| 2025-08-20 | NP | NATIONWIDE VARIABLE INSURANCE TRUST - NVIT iShares Global Equity ETF Fund II | 141 058 | 0,41 | 9 046 | 11,25 | ||||
| 2025-07-29 | 13F | Kanawha Capital Management Llc | 3 995 | 0,00 | 256 | 10,82 | ||||
| 2025-08-12 | 13F | Proequities, Inc. | 0 | 0 | ||||||
| 2025-04-21 | 13F | Nelson, Van Denburg & Campbell Wealth Management Group, LLC | 0 | −100,00 | 0 | |||||
| 2025-08-08 | 13F | Pnc Financial Services Group, Inc. | 1 529 | −96,64 | 98 | −96,28 | ||||
| 2025-08-11 | 13F | Citigroup Inc | 147 701 | 7,42 | 9 472 | 19,02 | ||||
| 2025-07-22 | 13F | Grimes & Company, Inc. | 42 585 | −1,93 | 2 731 | 8,64 | ||||
| 2025-07-25 | 13F | Ruedi Wealth Management, Inc. | 0 | −100,00 | 0 | |||||
| 2025-08-12 | 13F | LPL Financial LLC | 296 021 | 35,29 | 18 984 | 49,90 | ||||
| 2025-05-14 | 13F | Van Hulzen Asset Management, LLC | 0 | −100,00 | 0 | |||||
| 2025-07-24 | 13F | JNBA Financial Advisors | 1 615 | 104 | ||||||
| 2025-07-31 | 13F | Forte Asset Management Llc | 113 322 | 3,76 | 7 267 | 14,97 | ||||
| 2025-08-06 | 13F | Atlas Legacy Advisors, LLC | 10 503 | 0,00 | 674 | 7,68 | ||||
| 2025-08-08 | 13F | Cetera Investment Advisers | 20 866 | −6,60 | 1 338 | 3,48 | ||||
| 2025-07-24 | 13F | IFP Advisors, Inc | 142 | 0,00 | 9 | 12,50 | ||||
| 2025-07-31 | 13F | Briaud Financial Planning, Inc | 51 | 0 | ||||||
| 2025-08-08 | 13F | Foundations Investment Advisors, LLC | 8 393 | 538 | ||||||
| 2025-08-04 | 13F | Ledyard National Bank | 5 862 | −3,81 | 376 | 6,53 | ||||
| 2025-08-07 | 13F | SFE Investment Counsel | 5 475 | −4,96 | 351 | 5,41 | ||||
| 2025-07-17 | 13F | Sterneck Capital Management, LLC | 93 636 | −0,19 | 6 005 | 10,59 | ||||
| 2025-08-08 | 13F | Larson Financial Group LLC | 0 | −100,00 | 0 | |||||
| 2025-07-30 | 13F | Retirement Planning Group | 9 895 | −0,37 | 635 | 10,45 | ||||
| 2025-08-11 | 13F | HighTower Advisors, LLC | 166 162 | −1,76 | 10 656 | 8,84 | ||||
| 2025-08-13 | 13F | Baird Financial Group, Inc. | 3 607 | −27,10 | 231 | −19,23 | ||||
| 2025-07-21 | 13F | Barrett & Company, Inc. | 1 496 | 0,00 | 96 | 10,47 | ||||
| 2025-07-29 | 13F | Planned Solutions, Inc. | 19 185 | 1,23 | 1 230 | 12,23 | ||||
| 2025-08-13 | 13F | Northwestern Mutual Wealth Management Co | 219 049 | 68,66 | 14 048 | 86,87 | ||||
| 2025-05-09 | 13F | Wade Financial Advisory, Inc | 257 225 | 7,58 | 14 888 | 3,17 | ||||
| 2025-08-19 | 13F | Asset Dedication, LLC | 26 | 2 | ||||||
| 2025-08-14 | 13F | IHT Wealth Management, LLC | 3 484 | −1,41 | 223 | 9,31 | ||||
| 2025-08-06 | 13F/A | Flagship Private Wealth, LLC | 4 537 | 0,27 | 291 | 11,11 | ||||
| 2025-08-08 | 13F | KM Capital Management Ltd. | 91 986 | 74,79 | 5 899 | 93,66 | ||||
| 2025-07-17 | 13F | Baron Silver Stevens Financial Advisors, Llc | 11 218 | 81,17 | 719 | 100,84 | ||||
| 2025-08-13 | 13F | Flow Traders U.s. Llc | 0 | −100,00 | 0 | |||||
| 2025-08-04 | 13F | Spire Wealth Management | 0 | −100,00 | 0 | |||||
| 2025-08-13 | 13F | Summit Wealth Group Llc / Co | 32 885 | 2 109 | ||||||
| 2025-07-18 | 13F | Parsons Capital Management Inc/ri | 5 835 | 3,06 | 374 | 14,37 | ||||
| 2025-08-13 | 13F | StoneX Group Inc. | 67 877 | 0,18 | 4 353 | 10,99 | ||||
| 2025-08-11 | 13F | TAGStone Capital, Inc. | 8 878 | 0,60 | 586 | |||||
| 2025-07-22 | 13F | Coastal Investment Advisors, Inc. | 91 | −36,36 | 6 | −37,50 | ||||
| 2025-08-19 | 13F | Newbridge Financial Services Group, Inc. | 12 800 | 821 | ||||||
| 2025-04-29 | 13F | Callan Capital, LLC | 6 480 | 0,03 | 375 | −3,85 | ||||
| 2025-08-04 | 13F | Savvy Advisors, Inc. | 5 447 | 0,00 | 349 | 10,79 | ||||
| 2025-05-15 | 13F | Alexis Investment Partners, LLC | 0 | −100,00 | 0 | |||||
| 2025-07-24 | 13F | Stonebridge Financial Group, LLC | 189 150 | −13,24 | 12 130 | −3,88 | ||||
| 2025-07-09 | 13F | Graves-Light Private Wealth Management, Inc. | 3 239 | 208 | ||||||
| 2025-07-16 | 13F | Signature Resources Capital Management, LLC | 4 682 | 0,00 | 300 | 11,11 | ||||
| 2025-07-11 | 13F | Farther Finance Advisors, LLC | 85 928 | 1,04 | 5 511 | 11,54 | ||||
| 2025-08-12 | 13F | Jpmorgan Chase & Co | 1 131 417 | −8,83 | 72 558 | 1,01 | ||||
| 2025-08-18 | 13F | Goodman Advisory Group, LLC | 2 625 | −87,09 | 168 | −85,71 | ||||
| 2025-07-10 | 13F | Wealth Enhancement Advisory Services, Llc | 212 946 | 2,24 | 13 833 | 14,74 | ||||
| 2025-05-06 | 13F | SYM FINANCIAL Corp | 0 | −100,00 | 0 | |||||
| 2025-07-25 | 13F | Hobbs Group Advisors, LLC | 36 563 | 0,00 | 2 345 | 10,78 | ||||
| 2025-08-13 | 13F | Renaissance Technologies Llc | 0 | −100,00 | 0 | |||||
| 2025-08-13 | 13F | Townsquare Capital Llc | 0 | −100,00 | 0 | |||||
| 2025-05-16 | 13F | Coppell Advisory Solutions LLC | 0 | −100,00 | 0 | |||||
| 2025-08-11 | 13F | Brass Tax Wealth Management, Inc | 4 246 | 0,00 | 272 | 11,02 | ||||
| 2025-07-23 | 13F | Heck Capital Advisors, LLC | 79 122 | 5 074 | ||||||
| 2025-08-14 | 13F | Two Sigma Investments, Lp | 151 700 | 9 729 | ||||||
| 2025-07-15 | 13F | Affinity Wealth Management Llc | 650 407 | −0,50 | 41 711 | 10,24 | ||||
| 2025-08-05 | 13F | Magnolia Capital Advisors Llc | 27 856 | 30,53 | 1 786 | 44,62 | ||||
| 2025-08-04 | 13F | Partners in Financial Planning | 19 449 | −2,82 | 1 247 | 7,69 | ||||
| 2025-08-04 | 13F | Pensionmark Financial Group, Llc | 184 701 | 14,24 | 11 845 | 26,58 | ||||
| 2025-07-25 | 13F | RHS Financial, LLC | 64 957 | 25,34 | 4 166 | 38,88 | ||||
| 2025-07-25 | 13F | Hazlett, Burt & Watson, Inc. | 344 | 11,69 | 0 | |||||
| 2025-08-08 | 13F | Gts Securities Llc | 0 | −100,00 | 0 | |||||
| 2025-07-30 | 13F | Phillips Financial Management, Llc | 378 734 | −2,65 | 24 288 | 7,86 | ||||
| 2025-07-28 | 13F | JGP Wealth Management, LLC | 5 840 | 7,45 | 375 | 19,11 | ||||
| 2025-07-15 | 13F | RVW Wealth, LLC | 45 015 | −0,80 | 2 887 | 9,90 | ||||
| 2025-08-04 | 13F | Atria Investments Llc | 10 134 | 0,00 | 650 | 10,75 | ||||
| 2025-08-11 | 13F | Principal Securities, Inc. | 376 | −75,91 | 24 | −74,47 | ||||
| 2025-07-23 | 13F | West Paces Advisors Inc. | 0 | −100,00 | 0 | |||||
| 2025-07-14 | 13F | AdvisorNet Financial, Inc | 2 303 | 0,30 | 148 | 11,36 | ||||
| 2025-08-07 | 13F | Parkside Financial Bank & Trust | 7 661 | −0,78 | 491 | 10,09 | ||||
| 2025-08-14 | 13F | Modern Wealth Management, LLC | 287 401 | 19,04 | 18 431 | 31,89 | ||||
| 2025-07-16 | 13F | Twelve Points Wealth Management LLC | 10 471 | −1,51 | 672 | 9,11 | ||||
| 2025-08-14 | 13F | Comerica Bank | 264 | 0,00 | 17 | 6,67 | ||||
| 2025-08-04 | 13F | Beirne Wealth Consulting Services, LLC | 305 510 | −9,21 | 19 594 | 0,60 | ||||
| 2025-08-15 | 13F | Morse Asset Management, Inc | 2 500 | 0,00 | 160 | 11,11 | ||||
| 2025-07-18 | 13F | Marino, Stram & Associates Llc | 6 333 | −2,18 | 406 | 8,56 | ||||
| 2025-07-11 | 13F | Ullmann Financial Group, Inc. | 1 463 380 | −3,81 | 93 847 | 6,57 | ||||
| 2025-08-14 | 13F | Bank Of America Corp /de/ | 770 165 | 146,78 | 49 391 | 173,43 | ||||
| 2025-08-13 | 13F | Jones Financial Companies Lllp | 109 882 | 3,56 | 6 998 | 14,65 | ||||
| 2025-08-15 | 13F | Equitable Holdings, Inc. | 9 793 | 53,93 | 628 | 70,65 | ||||
| 2025-07-24 | 13F | Edge Financial Advisors LLC | 24 380 | 1 564 | ||||||
| 2025-07-11 | 13F | Kaydan Wealth Management, Inc. | 12 950 | −7,10 | 830 | 2,98 | ||||
| 2025-08-07 | 13F | BOK Financial Private Wealth, Inc. | 4 257 | 0,00 | 273 | 10,98 | ||||
| 2025-08-04 | 13F | Clear Investment Research, Llc | 2 571 | 0,00 | 165 | 10,81 | ||||
| 2025-08-08 | 13F | Creative Planning | 21 104 | −1,55 | 1 353 | 9,11 | ||||
| 2025-08-08 | 13F | Bouchey Financial Group Ltd | 3 745 | 0,00 | 240 | 11,11 | ||||
| 2025-08-14 | 13F | Moneta Group Investment Advisors Llc | 5 588 | 5,14 | 358 | 16,61 | ||||
| 2025-07-07 | 13F | Thurston, Springer, Miller, Herd & Titak, Inc. | 443 | 22,38 | 28 | 40,00 | ||||
| 2025-07-14 | 13F | Acropolis Investment Management, LLC | 229 860 | 10,58 | 14 741 | 22,52 | ||||
| 2025-08-11 | 13F | Bellwether Advisors, LLC | 10 240 | 0,18 | 657 | 11,56 | ||||
| 2025-07-17 | 13F | Smith, Salley & Associates | 24 552 | 0,00 | 1 575 | 10,77 | ||||
| 2025-08-14 | 13F | Integrated Wealth Concepts LLC | 1 112 784 | −0,02 | 71 363 | 10,78 | ||||
| 2025-08-14 | 13F | Fort Point Capital Partners LLC | 4 170 | 267 | ||||||
| 2025-08-14 | 13F | Snowden Capital Advisors LLC | 9 399 | 0,00 | 603 | 10,87 | ||||
| 2025-07-31 | 13F | Cardinal Point Capital Management, ULC | 697 614 | 2,44 | 44 738 | 13,50 | ||||
| 2025-08-14 | 13F/A | Skopos Labs, Inc. | 150 | 10 |
Other Listings
| MX:LRGF | |
| CL:LRGF CL |