Grundläggande statistik
| Institutionella ägare | 258 total, 258 long only, 0 short only, 0 long/short - change of 3,60% MRQ |
| Genomsnittlig portföljallokering | 0.2684 % - change of 50,27% MRQ |
| Institutionella aktier (lång) | 10 858 895 (ex 13D/G) - change of 1,20MM shares 12,43% MRQ |
| Institutionellt värde (lång) | $ 865 418 USD ($1000) |
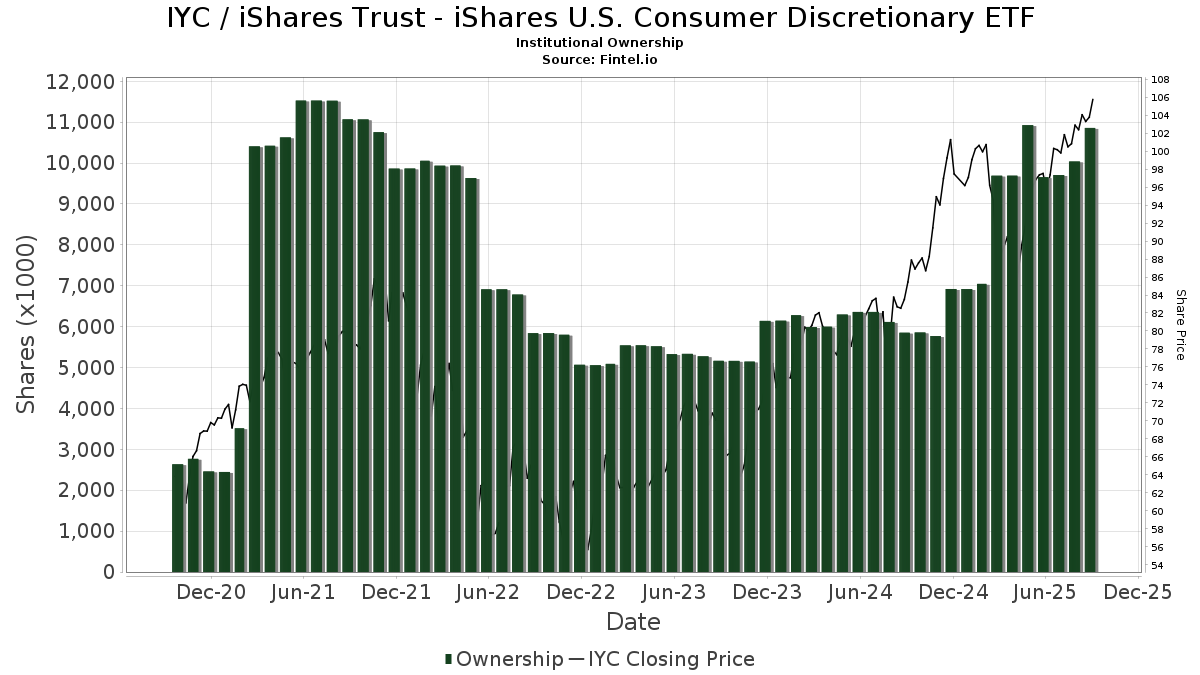
Institutionellt ägande och aktieägare
iShares Trust - iShares U.S. Consumer Discretionary ETF (US:IYC) har 258 Institutionella ägare och aktieägare som har lämnat in 13D/G- eller 13F-formulär till Securities Exchange Commission (SEC). Dessa institut innehar totalt 10,858,895 aktier. Största aktieägare inkluderar Harel Insurance Investments & Financial Services Ltd., Morgan Stanley, Green Harvest Asset Management LLC, Bank Of America Corp /de/, UBS Group AG, Pinkerton Retirement Specialists, LLC, Mml Investors Services, Llc, Wells Fargo & Company/mn, Royal Bank Of Canada, and Raymond James Financial Inc .
iShares Trust - iShares U.S. Consumer Discretionary ETF (ARCA:IYC) Institutionell ägarstruktur visar institutioners och fonders nuvarande positioner i företaget, samt de senaste förändringarna i positionernas storlek. Större aktieägare kan vara enskilda investerare, fonder, hedgefonder eller institutioner. Bilaga 13D visar att investeraren äger (eller ägde) mer än 5% av företaget och avser (eller avsåg) att aktivt eftersträva en förändring av affärsstrategin. Schedule 13G indikerar en passiv investering på över 5%.
The share price as of September 9, 2025 is 105,09 / share. Previously, on September 10, 2024, the share price was 82,75 / share. This represents an increase of 27,00% over that period.
Fondsentimentets poäng
Fondsentimentet poängen(fka Ägarackumulation-poäng) visar vilka aktier som är mest köpta av fonder. Det är resultatet av en sofistikerad kvantitativ flerfaktormodell som identifierar företag med de högsta nivåerna av institutionell ackumulering. Poängsättningsmodellen använder en kombination av den totala ökningen av redovisade ägare, förändringarna i portföljallokeringarna för dessa ägare och andra mått. Siffran sträcker sig från 0 till 100, där högre siffror indikerar en högre nivå av ackumulering i förhållande till sina konkurrenter, och 50 är genomsnittet.
Uppdateringsfrekvens: Dagligen
Se Ownership Explorer, som innehåller en lista över de högst rankade företagen.
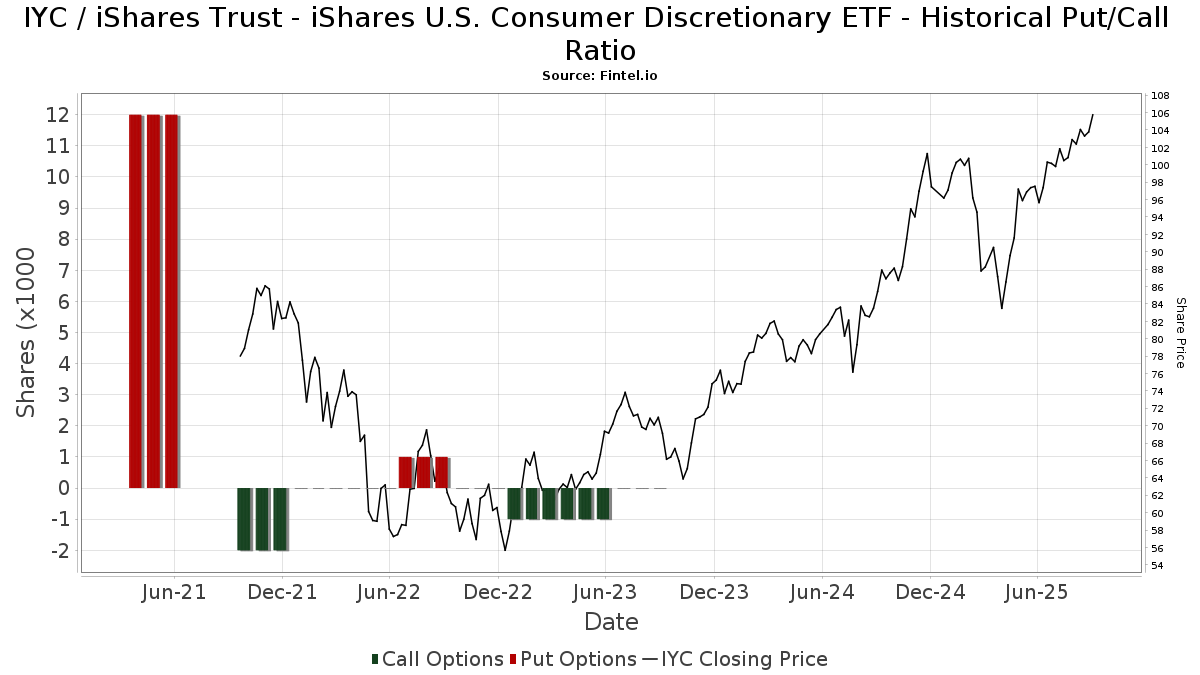
Institutionell sälj/köp-kvot
Förutom att rapportera vanliga eget kapital- och skuldemissioner måste institutioner med mer än 100MM tillgångar under förvaltning också avslöja sina innehav av sälj- och köpoptioner. Eftersom säljoptioner i allmänhet indikerar ett negativt sentiment och köpoptioner indikerar ett positivt sentiment, kan vi få en uppfattning om det övergripande institutionella sentimentet genom att plotta förhållandet mellan säljoptioner och köpoptioner. Diagrammet till höger visar det historiska förhållandet mellan sälj- och köpoptioner för detta instrument.
Genom att använda sälj/köp-kvoten som en indikator på aktieägarnas sentiment undviker man en av de största bristerna med att använda det totala institutionella ägandet, nämligen att en betydande del av de förvaltade tillgångarna investeras passivt för att följa index. Passivt förvaltade fonder köper vanligtvis inte optioner, så indikatorn för sälj/köp-kvoten ger en bättre bild av stämningen i aktivt förvaltade fonder.
13D/G-Arkiveringar
Vi presenterar 13D/G-arkiveringar separat från 13F-arkiveringar på grund av att de behandlas olika av SEC. 13D/G-arkiveringar kan lämnas in av grupper av investerare (med en ledare), medan 13F-arkiveringar inte kan det. Detta leder till situationer där en investerare kan lämna in en 13D/G-ansökan med ett värde för de totala aktierna (vilket motsvarar alla aktier som ägs av investerargruppen), men sedan lämna in en 13F-ansökan med ett annat värde för de totala aktierna (vilket motsvarar enbart deras eget ägande). Detta innebär att aktieägandet i 13D/G-arkiveringar och 13F-arkiveringar ofta inte är direkt jämförbara, så vi presenterar dem separat.
Notera: Från och med den 16 maj 2021 visar vi inte längre ägare som inte har lämnat in en 13D/G under det senaste året. Tidigare visade vi hela historiken för 13D/G-arkiveringar. I allmänhet måste enheter som är skyldiga att lämna in 13D/G-arkiveringar lämna in minst en gång per år innan de lämnar in en stängningsarkivering. Fonder avslutar dock ibland positioner utan att lämna in en avslutande arkivering (dvs. de avvecklar), så att visa hela historiken resulterade ibland i förvirring om det nuvarande ägandet. För att förhindra förvirring visar vi nu endast "nuvarande" ägare - det vill säga ägare som har lämnat in en ansökan under det senaste året.
Upgrade to unlock premium data.
13F- och NPORT-arkiveringar
Detaljer om 13F-arkiveringar är gratis. Detaljer om NP-arkiveringar kräver ett premiummedlemskap. Gröna rader indikerar nya positioner. Röda rader indikerar stängda positioner. Klicka på länk symbolen för att se hela transaktionshistoriken.
Uppgradera
för att låsa upp premiumdata och exportera till Excel ![]() .
.
| Fil Datum | Källa | Investerare | Typ | Genomsnittligt pris (beräknat) |
Aktier | Δ Aktier (%) |
Rapporterat värde (1000 USD) |
Δ Värde (%) |
Portföljallokering (%) |
|
|---|---|---|---|---|---|---|---|---|---|---|
| 2025-08-13 | 13F | Haverford Trust Co | 8 370 | 0,00 | 834 | 12,72 | ||||
| 2025-08-14 | 13F | EP Wealth Advisors, Inc. | 5 563 | 3,61 | 554 | 16,88 | ||||
| 2025-07-25 | 13F | Second Half Financial Partners, LLC | 0 | −100,00 | 0 | |||||
| 2025-07-16 | 13F | Advisors Management Group Inc /adv | 2 912 | 4,34 | 0 | |||||
| 2025-08-14 | 13F | D. E. Shaw & Co., Inc. | 4 658 | 68,89 | 464 | 90,95 | ||||
| 2025-08-18 | 13F/A | National Bank Of Canada /fi/ | 2 164 | −35,52 | 215 | −27,36 | ||||
| 2025-08-14 | 13F | Citadel Advisors Llc | 0 | −100,00 | 0 | |||||
| 2025-07-18 | 13F | USA Financial Portformulas Corp | 35 895 | 3 577 | ||||||
| 2025-07-30 | 13F | IMG Wealth Management, Inc. | 88 | 0,00 | 9 | 14,29 | ||||
| 2025-08-07 | 13F | Fountainhead AM, LLC | 2 193 | −62,79 | 219 | −58,08 | ||||
| 2025-07-28 | 13F | Patten & Patten Inc/tn | 7 732 | −1,65 | 770 | 10,95 | ||||
| 2025-07-30 | 13F | Canvas Wealth Advisors, LLC | 5 584 | 0,00 | 568 | 19,37 | ||||
| 2025-08-05 | 13F | Tiaa Trust, National Association | 4 260 | 0,00 | 424 | 12,77 | ||||
| 2025-04-22 | 13F | Synergy Financial Management, LLC | 0 | −100,00 | 0 | |||||
| 2025-08-06 | 13F | Simmons Bank | 12 050 | −1,95 | 1 201 | 10,60 | ||||
| 2025-07-22 | 13F | Beacon Financial Advisory LLC | 2 926 | 0,03 | 292 | 12,79 | ||||
| 2025-08-05 | 13F | Bank Of Montreal /can/ | 10 598 | 20,13 | 1 056 | 35,43 | ||||
| 2025-05-01 | 13F | WESPAC Advisors, LLC | 0 | −100,00 | 0 | |||||
| 2025-04-11 | 13F | Davis Capital Management | 348 | 0,00 | 31 | −9,09 | ||||
| 2025-08-04 | 13F | Spinnaker Trust | 13 928 | 0,00 | 1 388 | 12,76 | ||||
| 2025-08-12 | 13F | Pathstone Holdings, LLC | 0 | −100,00 | 0 | |||||
| 2025-05-12 | 13F | Americana Partners, LLC | 0 | −100,00 | 0 | |||||
| 2025-07-31 | 13F | Oppenheimer & Co Inc | 2 956 | 0,00 | 295 | 12,64 | ||||
| 2025-08-06 | 13F | Golden State Wealth Management, LLC | 143 | 0,00 | 14 | 16,67 | ||||
| 2025-08-11 | 13F | Private Advisor Group, LLC | 29 278 | 14,11 | 2 917 | 28,73 | ||||
| 2025-08-06 | 13F | Maltin Wealth Management, Inc. | 3 260 | 0,12 | 325 | 12,89 | ||||
| 2025-07-31 | 13F | Cambridge Investment Research Advisors, Inc. | 84 666 | 31,13 | 8 | 60,00 | ||||
| 2025-08-07 | 13F | Ibex Wealth Advisors | 8 957 | −14,79 | 892 | −3,88 | ||||
| 2025-08-14 | 13F | Ameriprise Financial Inc | 47 934 | −1,11 | 4 776 | 11,56 | ||||
| 2025-07-28 | 13F | Duncker Streett & Co Inc | 70 | 0,00 | 7 | 0,00 | ||||
| 2025-08-06 | 13F | Garrison Point Advisors, Llc | 13 870 | −2,05 | 1 382 | 10,56 | ||||
| 2025-07-22 | 13F | DAVENPORT & Co LLC | 14 426 | 18,94 | 1 437 | 34,17 | ||||
| 2025-08-13 | 13F | M&t Bank Corp | 6 001 | −30,89 | 598 | −22,06 | ||||
| 2025-05-14 | 13F | Hsbc Holdings Plc | 0 | −100,00 | 0 | |||||
| 2025-08-11 | 13F | GKV Capital Management Co., Inc. | 0 | −100,00 | 0 | |||||
| 2025-07-14 | 13F | U.S. Capital Wealth Advisors, LLC | 8 565 | −21,07 | 853 | −10,96 | ||||
| 2025-07-09 | 13F | Lifestyle Asset Management, Inc. | 10 004 | 997 | ||||||
| 2025-07-22 | 13F | Mascoma Wealth Management LLC | 1 000 | 0,00 | 100 | 12,50 | ||||
| 2025-05-14 | 13F | Snowden Capital Advisors LLC | 0 | −100,00 | 0 | |||||
| 2025-07-07 | 13F | Greenfield Savings Bank | 3 512 | 0,00 | 350 | 12,58 | ||||
| 2025-08-19 | 13F | Anchor Investment Management, LLC | 8 951 | −4,94 | 892 | 7,22 | ||||
| 2025-08-01 | 13F | Financial Counselors Inc | 0 | −100,00 | 0 | |||||
| 2025-08-05 | 13F | NewSquare Capital LLC | 36 | 4 | ||||||
| 2025-04-29 | 13F | Bank of New York Mellon Corp | 0 | −100,00 | 0 | −100,00 | ||||
| 2025-08-13 | 13F | Russell Investments Group, Ltd. | 28 | 3 | ||||||
| 2025-07-25 | 13F | Muirfield Wealth Advisors Llc | 6 307 | −12,15 | 628 | −0,95 | ||||
| 2025-08-06 | 13F | AE Wealth Management LLC | 49 247 | 32,41 | 4 907 | 49,35 | ||||
| 2025-08-12 | 13F | Holderness Investments Co | 2 632 | 0,04 | 262 | 12,93 | ||||
| 2025-07-10 | 13F | Wealth Enhancement Advisory Services, Llc | 2 801 | −7,89 | 282 | 5,22 | ||||
| 2025-07-24 | 13F | Ronald Blue Trust, Inc. | 375 | 0,00 | 37 | 12,12 | ||||
| 2025-08-12 | 13F | Park Square Financial Group, LLC | 72 | 0,00 | 7 | 16,67 | ||||
| 2025-08-12 | 13F | Founders Financial Alliance, LLC | 158 | −71,43 | 16 | −68,75 | ||||
| 2025-08-12 | 13F | O'shaughnessy Asset Management, Llc | 170 | 17 | ||||||
| 2025-08-15 | 13F | Morgan Stanley | 1 070 505 | 12,94 | 106 665 | 27,41 | ||||
| 2025-07-30 | 13F | Financial Perspectives, Inc | 760 | 0,00 | 76 | 11,94 | ||||
| 2025-08-14 | 13F | Susquehanna International Group, Llp | 0 | −100,00 | 0 | |||||
| 2025-07-10 | 13F | Global Financial Private Client, LLC | 0 | −100,00 | 0 | |||||
| 2025-07-17 | 13F | LexAurum Advisors, LLC | 2 899 | 2,22 | 289 | 15,20 | ||||
| 2025-07-30 | 13F | WESPAC Advisors SoCal, LLC | 9 904 | −65,57 | 987 | −61,18 | ||||
| 2025-07-23 | 13F | Prime Capital Investment Advisors, LLC | 5 580 | −35,28 | 556 | −26,94 | ||||
| 2025-08-07 | 13F | Samalin Investment Counsel, LLC | 3 883 | 1,86 | 387 | 14,88 | ||||
| 2025-08-12 | 13F | Pettyjohn, Wood & White, Inc | 5 500 | 0,00 | 548 | 12,99 | ||||
| 2025-08-19 | 13F | National Asset Management, Inc. | 3 264 | −36,01 | 325 | −33,67 | ||||
| 2025-08-14 | 13F | Goldman Sachs Group Inc | 112 178 | 26,12 | 11 177 | 42,27 | ||||
| 2025-08-08 | 13F | MTM Investment Management, LLC | 884 | 0,00 | 88 | 12,82 | ||||
| 2025-07-25 | 13F | Cwm, Llc | 6 812 | −0,80 | 1 | |||||
| 2025-07-16 | 13F | Minichmacgregor Wealth Management, Llc | 191 409 | 12,11 | 19 072 | 26,47 | ||||
| 2025-08-04 | 13F | Pinnacle Associates Ltd | 2 600 | 0,00 | 259 | 13,10 | ||||
| 2025-08-14 | 13F | Aqr Capital Management Llc | 2 688 | 268 | ||||||
| 2025-07-17 | 13F | Janney Montgomery Scott LLC | 5 717 | 0,32 | 1 | |||||
| 2025-08-05 | 13F | Huntington National Bank | 1 340 | 43,67 | ||||||
| 2025-08-14 | 13F | Stifel Financial Corp | 159 492 | 8,70 | 15 894 | 22,62 | ||||
| 2025-08-14 | 13F | Mariner, LLC | 33 137 | 166,72 | 3 302 | 200,91 | ||||
| 2025-07-28 | 13F | Hudson Capital Management LLC | 2 665 | 266 | ||||||
| 2025-05-12 | 13F | Simplex Trading, Llc | 0 | −100,00 | 0 | |||||
| 2025-08-12 | 13F | Proequities, Inc. | 0 | 0 | ||||||
| 2025-08-08 | 13F | Citizens Financial Group Inc/ri | 4 909 | 0,00 | 489 | 12,93 | ||||
| 2025-08-12 | 13F | Gladstone Institutional Advisory LLC | 4 492 | 73,64 | 448 | 96,05 | ||||
| 2025-07-15 | 13F | Well Done, LLC | 58 871 | 5 866 | ||||||
| 2025-08-07 | 13F | Allworth Financial LP | 1 180 | 0,00 | 118 | 12,50 | ||||
| 2025-07-24 | 13F | Blair William & Co/il | 5 433 | −0,80 | 541 | 12,01 | ||||
| 2025-08-06 | 13F | Moors & Cabot, Inc. | 6 408 | −81,69 | 638 | 1 578,95 | ||||
| 2025-08-06 | 13F | Commonwealth Equity Services, Llc | 70 143 | −2,10 | 7 | 0,00 | ||||
| 2025-08-14 | 13F | Sunbelt Securities, Inc. | 15 589 | −6,53 | 1 499 | 1,70 | ||||
| 2025-08-14 | 13F | UBS Group AG | 537 662 | −3,68 | 53 573 | 8,66 | ||||
| 2025-08-14 | 13F | Tudor Financial Inc. | 0 | −100,00 | 0 | |||||
| 2025-07-29 | 13F | Balboa Wealth Partners | 26 599 | 2 650 | ||||||
| 2025-07-17 | 13F/A | Capital Investment Advisors, LLC | 9 408 | 0,01 | 937 | 12,89 | ||||
| 2025-08-08 | 13F | Family Firm, Inc. | 0 | −100,00 | 0 | |||||
| 2025-08-15 | 13F | SkyView Investment Advisors, LLC | 0 | −100,00 | 0 | |||||
| 2025-07-16 | 13F | Dakota Wealth Management | 3 604 | 0,00 | 359 | 12,89 | ||||
| 2025-08-11 | 13F | TD Waterhouse Canada Inc. | 300 | 0,00 | 30 | 11,54 | ||||
| 2025-05-02 | 13F | Apollon Wealth Management, LLC | 0 | −100,00 | 0 | |||||
| 2025-07-16 | 13F | Southern Capital Advisors, Llc | 41 887 | 1,16 | 4 174 | 14,11 | ||||
| 2025-08-15 | 13F | CI Private Wealth, LLC | 20 814 | −23,49 | 2 074 | −13,70 | ||||
| 2025-08-19 | 13F | Advisory Services Network, LLC | 119 013 | −6,78 | 11 899 | 5,52 | ||||
| 2025-05-06 | 13F | Navellier & Associates Inc | 0 | −100,00 | 0 | |||||
| 2025-08-15 | 13F | Captrust Financial Advisors | 2 429 | −98,34 | 242 | −98,13 | ||||
| 2025-07-16 | 13F | West Branch Capital LLC | 68 | 0,00 | 7 | 0,00 | ||||
| 2025-08-01 | 13F | Gwn Securities Inc. | 0 | −100,00 | 0 | |||||
| 2025-08-13 | 13F | Marshall Wace, Llp | 2 594 | 258 | ||||||
| 2025-08-14 | 13F | Betterment LLC | 2 171 | 0 | ||||||
| 2025-08-14 | 13F | Wells Fargo & Company/mn | 334 853 | −10,23 | 33 365 | 1,27 | ||||
| 2025-05-07 | 13F | Norden Group Llc | 0 | −100,00 | 0 | |||||
| 2025-07-23 | 13F | West Paces Advisors Inc. | 422 | 100,95 | 42 | 133,33 | ||||
| 2025-07-28 | 13F | Harbour Investments, Inc. | 3 907 | 593,96 | 389 | 693,88 | ||||
| 2025-08-14 | 13F | Fmr Llc | 12 681 | 10,98 | 1 264 | 25,17 | ||||
| 2025-08-01 | 13F | Advisory Alpha, LLC | 2 187 | 218 | ||||||
| 2025-04-24 | 13F | Wright Fund Managment, LLC | 0 | −100,00 | 0 | |||||
| 2025-08-14 | 13F | Smartleaf Asset Management LLC | 18 989 | 22,22 | 1 891 | 38,26 | ||||
| 2025-04-28 | 13F | Clear Creek Financial Management, LLC | 0 | −100,00 | 0 | |||||
| 2025-07-17 | 13F | Patton Albertson Miller Group, Llc | 12 112 | 0,00 | 1 207 | 12,82 | ||||
| 2025-08-07 | 13F | Kestra Private Wealth Services, Llc | 2 350 | −35,86 | 234 | −27,55 | ||||
| 2025-08-14 | 13F | Bank Of America Corp /de/ | 853 831 | 9,09 | 85 076 | 23,06 | ||||
| 2025-08-04 | 13F | Spire Wealth Management | 0 | −100,00 | 0 | |||||
| 2025-07-23 | 13F | 1 North Wealth Services Llc | 615 | −34,22 | 61 | −25,61 | ||||
| 2025-08-14 | 13F | Wiley Bros.-aintree Capital, Llc | 10 066 | −3,92 | 1 003 | 8,68 | ||||
| 2025-05-09 | 13F | L & S Advisors Inc | 0 | −100,00 | 0 | |||||
| 2025-08-11 | 13F | Greykasell Wealth Strategies, Inc. | 2 896 | 0,00 | 289 | 12,94 | ||||
| 2025-08-14 | 13F | Mercer Global Advisors Inc /adv | 2 750 | 2,61 | 274 | 16,10 | ||||
| 2025-08-14 | 13F | Vivaldi Capital Management, LLC | 5 377 | 7,82 | 536 | 21,59 | ||||
| 2025-05-12 | 13F | Sandy Spring Bank | 1 660 | 0,00 | 147 | −8,18 | ||||
| 2025-08-13 | 13F | Continuum Advisory, LLC | 0 | −100,00 | 0 | |||||
| 2025-08-29 | 13F | Centaurus Financial, Inc. | 8 705 | 127,34 | 1 | |||||
| 2025-07-08 | 13F | Nbc Securities, Inc. | 200 | 0,00 | 0 | |||||
| 2025-08-12 | 13F | MAI Capital Management | 2 961 | −14,96 | 295 | −3,91 | ||||
| 2025-08-07 | 13F | Summit X, LLC | 4 821 | −3,70 | 480 | 8,60 | ||||
| 2025-08-14 | 13F | Essential Planning, LLC. | 2 160 | −10,00 | 215 | 1,90 | ||||
| 2025-04-29 | 13F | Resources Investment Advisors, LLC. | 0 | −100,00 | 0 | −100,00 | ||||
| 2025-07-24 | 13F | IFP Advisors, Inc | 2 216 | 0,82 | 221 | 13,40 | ||||
| 2025-08-08 | 13F | Hartland & Co., LLC | 655 | 0,00 | 65 | 14,04 | ||||
| 2025-08-15 | 13F | Kestra Advisory Services, LLC | 18 711 | 403,12 | 1 864 | 468,29 | ||||
| 2025-08-06 | 13F | Prospera Financial Services Inc | 127 384 | −38,06 | 12 693 | −30,12 | ||||
| 2025-08-13 | 13F | Virtue Capital Management, LLC | 11 688 | 24,34 | 1 165 | 40,24 | ||||
| 2025-07-29 | 13F | Koshinski Asset Management, Inc. | 11 145 | 0,01 | 1 111 | 12,80 | ||||
| 2025-08-18 | 13F | Front Row Advisors LLC | 1 390 | −24,86 | 138 | −15,34 | ||||
| 2025-05-02 | 13F | Fortis Group Advisors, LLC | 0 | −100,00 | 0 | |||||
| 2025-04-04 | 13F | Three Seasons Wealth, LLC | 0 | −100,00 | 0 | −100,00 | ||||
| 2025-08-14 | 13F | Mml Investors Services, Llc | 343 195 | 35,15 | 34 | 54,55 | ||||
| 2025-08-04 | 13F | AMG National Trust Bank | 12 452 | −0,40 | 1 241 | 12,32 | ||||
| 2025-08-14 | 13F | Glenview Trust Co | 3 158 | −40,59 | 315 | −33,05 | ||||
| 2025-07-29 | 13F | Signature Estate & Investment Advisors Llc | 6 317 | 0,14 | 629 | 12,93 | ||||
| 2025-07-30 | 13F | Clifford Swan Investment Counsel Llc | 4 000 | 0,00 | 399 | 12,75 | ||||
| 2025-07-25 | 13F | Genesee Capital Advisors, LLC | 14 396 | 65,03 | 1 434 | 86,23 | ||||
| 2025-07-29 | 13F | Stephens Inc /ar/ | 2 868 | 0,00 | 286 | 12,65 | ||||
| 2025-07-23 | 13F | Sax Wealth Advisors, Llc | 2 124 | 212 | ||||||
| 2025-07-30 | 13F | Cookson Peirce & Co Inc | 6 146 | −4,24 | 612 | 8,13 | ||||
| 2025-07-21 | 13F | Ameritas Advisory Services, LLC | 684 | 68 | ||||||
| 2025-07-24 | 13F | Wealthstar Advisors, Llc | 19 219 | 1 915 | ||||||
| 2025-08-01 | 13F | Zhang Financial LLC | 2 734 | 272 | ||||||
| 2025-07-02 | 13F | Central Pacific Bank - Trust Division | 81 | 0,00 | 8 | 14,29 | ||||
| 2025-04-30 | 13F | Moloney Securities Asset Management, LLC | 0 | −100,00 | 0 | |||||
| 2025-08-13 | 13F | VestGen Advisors, LLC | 23 124 | 10,61 | 2 304 | 24,81 | ||||
| 2025-06-30 | NP | Two Roads Shared Trust - Anfield U.S. Equity Sector Rotation ETF | 49 467 | 4 430 | ||||||
| 2025-08-14 | 13F | CoreCap Advisors, LLC | 5 843 | 15,63 | 582 | 30,49 | ||||
| 2025-05-12 | 13F | Townsquare Capital Llc | 0 | −100,00 | 0 | |||||
| 2025-09-04 | 13F/A | Advisor Group Holdings, Inc. | 150 149 | 1,39 | 14 961 | 14,38 | ||||
| 2025-07-08 | 13F | Arlington Trust Co LLC | 175 | 0,00 | 17 | 13,33 | ||||
| 2025-07-16 | 13F | Cadent Capital Advisors, LLC | 49 157 | 1,04 | 4 898 | 13,99 | ||||
| 2025-08-01 | 13F | Planning Directions Inc | 4 233 | 0,14 | 422 | 12,87 | ||||
| 2025-08-14 | 13F | Hrt Financial Lp | 0 | −100,00 | 0 | |||||
| 2025-08-14 | 13F | Zurich Insurance Group Ltd/FI | 40 500 | 4 059 | ||||||
| 2025-07-21 | 13F | Pflug Koory, LLC | 136 | 0,00 | 14 | 8,33 | ||||
| 2025-08-11 | 13F | Rothschild Investment Llc | 150 | 0,00 | 15 | 7,69 | ||||
| 2025-08-14 | 13F | Fwl Investment Management, Llc | 400 | 0,00 | 40 | 11,43 | ||||
| 2025-08-12 | 13F | Global Retirement Partners, LLC | 2 710 | 284,94 | 270 | 302,99 | ||||
| 2025-08-27 | 13F/A | Brinker Capital Investments, LLC | 4 595 | 458 | ||||||
| 2025-07-17 | 13F | Global Trust Asset Management, LLC | 0 | −100,00 | 0 | |||||
| 2025-08-12 | 13F | Jpmorgan Chase & Co | 28 568 | −64,00 | 2 847 | −59,40 | ||||
| 2025-08-14 | 13F | KKM Financial LLC | 9 693 | −8,20 | 966 | 3,54 | ||||
| 2025-05-01 | 13F | Coastal Investment Advisors, Inc. | 0 | −100,00 | 0 | |||||
| 2025-08-04 | 13F | Adell Harriman & Carpenter Inc | 5 560 | 0,00 | 554 | 12,63 | ||||
| 2025-08-14 | 13F | MGB Wealth Management, LLC | 1 936 | 0,00 | 193 | 12,94 | ||||
| 2025-07-14 | 13F | AdvisorNet Financial, Inc | 12 337 | −1,41 | 1 229 | 11,22 | ||||
| 2025-05-09 | 13F | J. Safra Sarasin Holding AG | 0 | −100,00 | 0 | |||||
| 2025-08-14 | 13F | Raymond James Financial Inc | 229 648 | 10,40 | 22 882 | 24,55 | ||||
| 2025-07-28 | 13F | Chesapeake Wealth Management | 3 220 | −6,12 | 321 | 5,96 | ||||
| 2025-08-01 | 13F | Envestnet Asset Management Inc | 54 465 | 41,27 | 5 427 | 59,35 | ||||
| 2025-08-15 | 13F | Cooksen Wealth, LLC | 21 | −93,84 | 2 | −92,59 | ||||
| 2025-07-23 | 13F | Independent Solutions Wealth Management, LLC | 2 786 | 9,77 | 278 | 23,66 | ||||
| 2025-08-05 | 13F | Optivise Advisory Services LLC | 13 034 | 0,00 | 1 299 | 12,77 | ||||
| 2025-08-08 | 13F | Pnc Financial Services Group, Inc. | 3 714 | −4,25 | 370 | 8,19 | ||||
| 2025-08-11 | 13F | Citigroup Inc | 6 505 | −42,13 | 648 | −34,68 | ||||
| 2025-07-29 | 13F | Private Trust Co Na | 352 | 0,00 | 35 | 12,90 | ||||
| 2025-07-15 | 13F | Eaton Financial Holdings Company, LLC | 30 083 | 0,00 | 2 997 | 12,80 | ||||
| 2025-08-18 | 13F | Geneos Wealth Management Inc. | 4 680 | 200,00 | 466 | 240,15 | ||||
| 2025-07-25 | 13F | Concurrent Investment Advisors, LLC | 5 723 | 29,57 | 570 | 46,15 | ||||
| 2025-08-12 | 13F | CIBC Private Wealth Group, LLC | 928 | −53,32 | 92 | −41,40 | ||||
| 2025-07-29 | 13F | Cottonwood Capital Advisors, Llc | 24 815 | −1,07 | 2 473 | 11,60 | ||||
| 2025-08-11 | 13F | Principal Securities, Inc. | 38 049 | 393,31 | 3 791 | 411,61 | ||||
| 2025-05-05 | 13F | Diversify Advisory Services, LLC | 0 | −100,00 | 0 | |||||
| 2025-08-04 | 13F | Eubel Brady & Suttman Asset Management Inc | 4 000 | 0,00 | 0 | |||||
| 2025-08-14 | 13F | Bnp Paribas Arbitrage, Sa | 51 400 | −48,96 | 5 121 | −42,42 | ||||
| 2025-08-14 | 13F | Royal Bank Of Canada | 261 507 | 1,20 | 26 056 | 14,16 | ||||
| 2025-08-06 | 13F | Csenge Advisory Group | 3 886 | 7,38 | 376 | 22,95 | ||||
| 2025-08-08 | 13F | Cetera Investment Advisers | 44 848 | 230,96 | 4 469 | 273,58 | ||||
| 2025-08-08 | 13F | Capital Investment Advisory Services, LLC | 1 260 | 0,16 | 126 | 12,61 | ||||
| 2025-05-07 | 13F | Vista Private Wealth Partners. LLC | 0 | −100,00 | 0 | |||||
| 2025-07-18 | 13F | TruNorth Capital Management, LLC | 0 | −100,00 | 0 | |||||
| 2025-07-14 | 13F | Whitener Capital Management, Inc. | 11 508 | −3,74 | 1 147 | 8,63 | ||||
| 2025-08-06 | 13F | Rps Advisory Solutions Llc | 2 062 | 205 | ||||||
| 2025-07-09 | 13F | Summit Financial Consulting LLC | 58 273 | −3,42 | 5 806 | 8,95 | ||||
| 2025-08-14 | 13F | Quantinno Capital Management LP | 7 794 | 23,24 | 777 | 39,07 | ||||
| 2025-07-17 | 13F | Tritonpoint Wealth, Llc | 21 301 | −4,36 | 2 122 | 7,88 | ||||
| 2025-07-10 | 13F | Focus Financial Network, Inc. | 2 942 | 4,62 | 293 | 18,15 | ||||
| 2025-07-10 | 13F | Ferguson Wellman Capital Management, Inc | 57 089 | −2,67 | 5 688 | 9,81 | ||||
| 2025-07-17 | 13F | Sound Income Strategies, LLC | 50 | −86,23 | 5 | −84,37 | ||||
| 2025-08-15 | 13F | Equitable Holdings, Inc. | 30 551 | 161,88 | 3 044 | 195,53 | ||||
| 2025-08-08 | 13F | Foundations Investment Advisors, LLC | 199 897 | 5,40 | 19 918 | 18,91 | ||||
| 2025-07-28 | 13F | Harbour Trust & Investment Management Co | 2 056 | 205 | ||||||
| 2025-05-15 | 13F | Lido Advisors, LLC | 0 | −100,00 | 0 | −100,00 | ||||
| 2025-08-12 | 13F | Wealthbridge Capital Management, Llc | 4 980 | −14,43 | 496 | −3,50 | ||||
| 2025-07-18 | 13F | Truist Financial Corp | 13 358 | −10,04 | 1 331 | 1,45 | ||||
| 2025-08-11 | 13F | HighTower Advisors, LLC | 14 012 | 2,11 | 1 396 | 15,18 | ||||
| 2025-07-18 | 13F | SOA Wealth Advisors, LLC. | 497 | 0,20 | 50 | 13,95 | ||||
| 2025-07-10 | 13F | Piscataqua Savings Bank | 40 | 0,00 | 4 | 0,00 | ||||
| 2025-08-13 | 13F | Pinkerton Retirement Specialists, LLC | 344 097 | 34 286 | ||||||
| 2025-08-26 | 13F/A | Thrivent Financial For Lutherans | 23 202 | 37,46 | 2 | 100,00 | ||||
| 2025-08-05 | 13F | Harel Insurance Investments & Financial Services Ltd. | 1 593 101 | 21,02 | 159 | 36,21 | ||||
| 2025-08-13 | 13F | Baird Financial Group, Inc. | 2 864 | −17,77 | 285 | −7,17 | ||||
| 2025-08-13 | 13F | Jones Financial Companies Lllp | 14 949 | 25,38 | 1 488 | 41,85 | ||||
| 2025-08-13 | 13F | Northwestern Mutual Wealth Management Co | 39 641 | 4,27 | 3 950 | 17,60 | ||||
| 2025-08-13 | 13F | Colonial Trust Advisors | 255 | 0,00 | 25 | 13,64 | ||||
| 2025-07-25 | 13F | SPC Financial, Inc. | 184 343 | 0,70 | 18 368 | 13,60 | ||||
| 2025-07-18 | 13F | Trust Co Of Vermont | 0 | −100,00 | 0 | |||||
| 2025-08-06 | 13F | Atlantic Union Bankshares Corp | 1 660 | 165 | ||||||
| 2025-08-11 | 13F | Ritter Daniher Financial Advisory LLC / DE | 190 | 0,00 | 19 | 12,50 | ||||
| 2025-08-14 | 13F | Jane Street Group, Llc | 28 030 | 71,83 | 2 793 | 93,89 | ||||
| 2025-08-07 | 13F | Midwest Trust Co | 3 560 | 355 | ||||||
| 2025-04-08 | 13F | Parallel Advisors, LLC | 0 | −100,00 | 0 | |||||
| 2025-07-30 | 13F | Gimbal Financial | 156 124 | 15 556 | ||||||
| 2025-08-08 | 13F | Gts Securities Llc | 4 083 | −73,21 | 407 | −69,84 | ||||
| 2025-07-30 | 13F | Whittier Trust Co Of Nevada Inc | 5 520 | 0,00 | 550 | 12,94 | ||||
| 2025-07-11 | 13F | Farther Finance Advisors, LLC | 1 796 | −19,82 | 179 | −10,55 | ||||
| 2025-07-30 | 13F | Brookstone Capital Management | 3 919 | −33,64 | 390 | −25,14 | ||||
| 2025-08-14 | 13F | Camarda Financial Advisors, LLC | 137 272 | 13 678 | ||||||
| 2025-04-30 | 13F | Sofos Investments, Inc. | 204 | −29,17 | 18 | −21,74 | ||||
| 2025-08-08 | 13F | Creative Planning | 9 261 | 3,95 | 923 | 17,30 | ||||
| 2025-08-13 | 13F | Flow Traders U.s. Llc | 0 | −100,00 | 0 | |||||
| 2025-07-30 | 13F | Sonata Capital Group Inc | 6 596 | 0,00 | 1 | |||||
| 2025-08-12 | 13F | BlackRock, Inc. | 27 606 | −41,23 | 2 751 | −33,70 | ||||
| 2025-08-13 | 13F | AMJ Financial Wealth Management | 3 443 | 7,39 | 343 | 21,20 | ||||
| 2025-08-04 | 13F | Buck Wealth Strategies, LLC | 10 163 | 52,92 | 1 013 | 72,40 | ||||
| 2025-08-05 | 13F | Transatlantique Private Wealth Llc | 32 653 | 7,08 | 3 254 | 20,79 | ||||
| 2025-07-18 | 13F | Bartlett & Co. Wealth Management Llc | 6 680 | 0,00 | 666 | 12,71 | ||||
| 2025-08-12 | 13F | AlphaCore Capital LLC | 11 | 0,00 | 1 | |||||
| 2025-08-15 | 13F | Tower Research Capital LLC (TRC) | 0 | −100,00 | 0 | |||||
| 2025-07-11 | 13F | Spence Asset Management | 11 879 | 10,25 | 1 | |||||
| 2025-07-30 | 13F | Wbh Advisory Inc | 0 | −100,00 | 0 | |||||
| 2025-08-06 | 13F | SOUTH STATE Corp | 320 | 0,00 | 32 | 10,71 | ||||
| 2025-08-14 | 13F | Quartz Partners, LLC | 2 228 | 222 | ||||||
| 2025-08-05 | 13F | Allstate Corp | 3 850 | 384 | ||||||
| 2025-08-07 | 13F | CENTRAL TRUST Co | 200 | 0,00 | 20 | 11,76 | ||||
| 2025-05-12 | 13F | FIL Ltd | 0 | −100,00 | 0 | |||||
| 2025-05-16 | 13F | Laidlaw Wealth Management LLC | 0 | −100,00 | 0 | |||||
| 2025-08-13 | 13F | Cresset Asset Management, LLC | 3 584 | 0,00 | 357 | 12,97 | ||||
| 2025-08-14 | 13F | Federation des caisses Desjardins du Quebec | 0 | −100,00 | 0 | |||||
| 2025-08-04 | 13F | Migdal Insurance & Financial Holdings Ltd. | 2 331 | −11,70 | 0 | |||||
| 2025-08-15 | 13F | Blue Chip Partners, Inc. | 2 205 | 220 | ||||||
| 2025-07-14 | 13F | Argentarii, LLC | 2 400 | 0,00 | 239 | 13,27 | ||||
| 2025-07-23 | 13F | Tyche Wealth Partners LLC | 2 321 | 0,04 | 231 | 13,24 | ||||
| 2025-08-13 | 13F | Quadrature Capital Ltd | 0 | −100,00 | 0 | |||||
| 2025-08-11 | 13F | Strategic Wealth Partners, Ltd. | 4 878 | 16,78 | 486 | 15,44 | ||||
| 2025-08-12 | 13F | LPL Financial LLC | 215 011 | 16,13 | 21 424 | 31,01 | ||||
| 2025-07-21 | 13F | Yeomans Consulting Group, Inc. | 10 240 | 1 023 | ||||||
| 2025-04-24 | 13F | First Merchants Corp | 0 | −100,00 | 0 | |||||
| 2025-08-13 | 13F | Renaissance Technologies Llc | 2 600 | 259 | ||||||
| 2025-08-12 | 13F | One Charles Private Wealth Services, LLC | 4 836 | −0,66 | 482 | 12,12 | ||||
| 2025-07-29 | 13F | Chevy Chase Trust Holdings, Inc. | 6 924 | 0,00 | 690 | 12,77 | ||||
| 2025-05-16 | 13F | Great Lakes Advisors, Llc | 0 | −100,00 | 0 | |||||
| 2025-08-12 | 13F | Sierra Summit Advisors Llc | 2 235 | 223 | ||||||
| 2025-07-29 | 13F | Chicago Partners Investment Group LLC | 3 001 | 0,13 | 306 | 11,31 | ||||
| 2025-07-16 | 13F | Stillwater Capital Advisors, LLC | 27 663 | −0,23 | 2 756 | 12,58 | ||||
| 2025-08-07 | 13F | Parkside Financial Bank & Trust | 661 | 535,58 | 66 | 622,22 | ||||
| 2025-08-14 | 13F | GWM Advisors LLC | 13 057 | −5,64 | 1 301 | 6,38 | ||||
| 2025-08-08 | 13F | Financial Gravity Companies, Inc. | 68 | −66,67 | 7 | −68,42 | ||||
| 2025-07-08 | 13F | Atlas Brown,Inc. | 2 515 | 0,16 | 251 | 13,12 | ||||
| 2025-08-05 | 13F | GPS Wealth Strategies Group, LLC | 1 931 | 0,10 | 192 | 12,94 | ||||
| 2025-08-13 | 13F | StoneX Group Inc. | 0 | −100,00 | 0 | −100,00 | ||||
| 2025-08-07 | 13F | Apeiron RIA LLC | 8 098 | 116,00 | 807 | 143,50 | ||||
| 2025-07-16 | 13F/A | CX Institutional | 165 | 243,75 | 0 | |||||
| 2025-08-06 | 13F | Stonebridge Financial Planning Group, LLC | 26 438 | −5,52 | 2 634 | 6,60 | ||||
| 2025-08-11 | 13F | Anfield Capital Management, LLC | 49 789 | −1,28 | 4 961 | 11,36 | ||||
| 2025-07-23 | 13F | Ameliora Wealth Management Ltd. | 11 000 | 0,00 | 1 096 | 12,87 | ||||
| 2025-07-28 | 13F | Private Wealth Asset Management, LLC | 2 400 | 0,00 | 239 | 13,27 | ||||
| 2025-07-15 | 13F | Patriot Investment Management Inc. | 4 853 | −7,08 | 484 | 4,77 | ||||
| 2025-07-07 | 13F | First Citizens Financial Corp | 51 740 | −13,28 | 5 155 | −2,16 | ||||
| 2025-08-14 | 13F | Comerica Bank | 7 607 | 0,11 | 758 | 12,82 | ||||
| 2025-07-17 | 13F | Lee Johnson Capital Management, Llc | 17 077 | 1 702 | ||||||
| 2025-08-08 | 13F | Symphony Financial Services, Inc. | 2 321 | 0,00 | 231 | 12,68 | ||||
| 2025-08-14 | 13F | Financial Engines Advisors L.L.C. | 3 331 | 332 | ||||||
| 2025-07-30 | 13F | Atlantic Edge Private Wealth Management, LLC | 580 | 0,00 | 58 | 11,76 | ||||
| 2025-08-04 | 13F | Atria Investments Llc | 8 765 | −1,73 | 873 | 10,93 | ||||
| 2025-04-02 | 13F/A | Picton Mahoney Asset Management | 0 | −100,00 | 0 | |||||
| 2025-07-28 | 13F | WJ Wealth Management, LLC | 3 880 | 0,00 | 387 | 12,87 | ||||
| 2025-04-25 | 13F | Westfuller Advisors, LLC | 0 | −100,00 | 0 | −100,00 | ||||
| 2025-07-15 | 13F | North Star Investment Management Corp. | 4 307 | 0,05 | 429 | 12,89 | ||||
| 2025-05-09 | 13F | Atria Wealth Solutions, Inc. | 0 | −100,00 | 0 | |||||
| 2025-08-11 | 13F | Bellwether Advisors, LLC | 1 | 0 | ||||||
| 2025-08-12 | 13F | Coldstream Capital Management Inc | 4 932 | 0,00 | 491 | 12,87 | ||||
| 2025-07-14 | 13F | Armstrong Advisory Group, Inc | 114 | 11 | ||||||
| 2025-07-23 | 13F | Lakeshore Capital Group, Inc. | 11 466 | −9,04 | 1 143 | 2,61 | ||||
| 2025-08-07 | 13F | Commerce Bank | 5 285 | 1,93 | 527 | 15,10 | ||||
| 2025-08-07 | 13F | Montag A & Associates Inc | 696 | 0,00 | 69 | 13,11 | ||||
| 2025-07-22 | 13F | Gsa Capital Partners Llp | 3 796 | 38,79 | 0 | |||||
| 2025-08-14 | 13F | Qube Research & Technologies Ltd | 58 146 | −15,58 | 5 794 | −4,77 | ||||
| 2025-07-28 | 13F | Mutual Advisors, LLC | 18 129 | 15,75 | 1 839 | 31,57 | ||||
| 2025-08-12 | 13F | Steward Partners Investment Advisory, Llc | 24 482 | 183,13 | 2 439 | 219,66 | ||||
| 2025-08-11 | 13F | United Capital Financial Advisers, Llc | 53 429 | 0,22 | 5 324 | 13,06 | ||||
| 2025-08-13 | 13F | Green Harvest Asset Management LLC | 1 027 290 | 5,45 | 102 359 | 18,96 | ||||
| 2025-08-26 | NP | Forethought Variable Insurance Trust - Global Atlantic BlackRock Selects Managed Risk Portfolio (formerly Global Atlantic BlackRock Global Allocation Managed Risk Portfolio) Global Atlantic BlackRock Global Allocation Managed Risk Portfolio | 27 286 | −38,39 | 2 719 | −30,50 | ||||
| 2025-08-19 | 13F | Newbridge Financial Services Group, Inc. | 155 | 15 | ||||||
| 2025-07-14 | 13F | Farmers & Merchants Investments Inc | 864 | 0,00 | 86 | 13,16 |