Grundläggande statistik
| Institutionella ägare | 131 total, 131 long only, 0 short only, 0 long/short - change of 6,45% MRQ |
| Genomsnittlig portföljallokering | 0.2408 % - change of −13,01% MRQ |
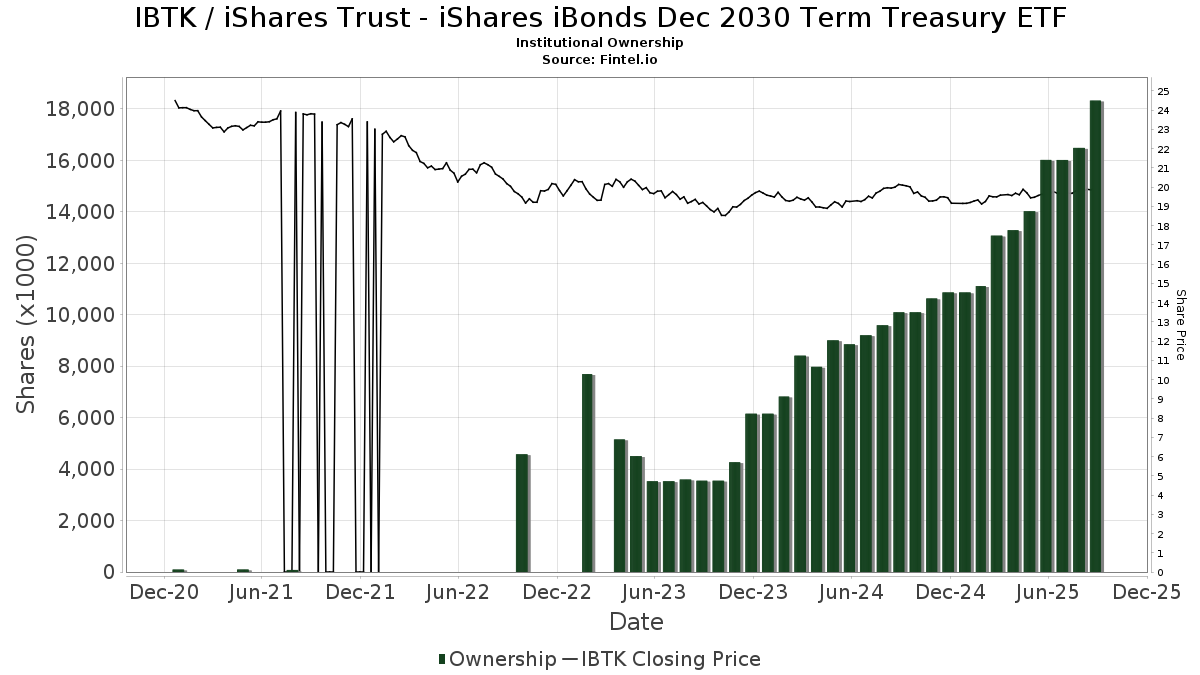
| Institutionella aktier (lång) | 18 321 871 (ex 13D/G) - change of 2,34MM shares 14,63% MRQ |
| Institutionellt värde (lång) | $ 350 101 USD ($1000) |
Institutionellt ägande och aktieägare
iShares Trust - iShares iBonds Dec 2030 Term Treasury ETF (US:IBTK) har 131 Institutionella ägare och aktieägare som har lämnat in 13D/G- eller 13F-formulär till Securities Exchange Commission (SEC). Dessa institut innehar totalt 18,321,871 aktier. Största aktieägare inkluderar Wells Fargo & Company/mn, Bank Of America Corp /de/, Envestnet Asset Management Inc, Titleist Asset Management, Llc, D.a. Davidson & Co., Mercer Global Advisors Inc /adv, Royal Bank Of Canada, Waycross Investment Management Co, Legacy Private Trust Co., and Probity Advisors, Inc. .
iShares Trust - iShares iBonds Dec 2030 Term Treasury ETF (NasdaqGM:IBTK) Institutionell ägarstruktur visar institutioners och fonders nuvarande positioner i företaget, samt de senaste förändringarna i positionernas storlek. Större aktieägare kan vara enskilda investerare, fonder, hedgefonder eller institutioner. Bilaga 13D visar att investeraren äger (eller ägde) mer än 5% av företaget och avser (eller avsåg) att aktivt eftersträva en förändring av affärsstrategin. Schedule 13G indikerar en passiv investering på över 5%.
The share price as of September 8, 2025 is 19,98 / share. Previously, on September 9, 2024, the share price was 20,08 / share. This represents a decline of 0,52% over that period.
Fondsentimentets poäng
Fondsentimentet poängen(fka Ägarackumulation-poäng) visar vilka aktier som är mest köpta av fonder. Det är resultatet av en sofistikerad kvantitativ flerfaktormodell som identifierar företag med de högsta nivåerna av institutionell ackumulering. Poängsättningsmodellen använder en kombination av den totala ökningen av redovisade ägare, förändringarna i portföljallokeringarna för dessa ägare och andra mått. Siffran sträcker sig från 0 till 100, där högre siffror indikerar en högre nivå av ackumulering i förhållande till sina konkurrenter, och 50 är genomsnittet.
Uppdateringsfrekvens: Dagligen
Se Ownership Explorer, som innehåller en lista över de högst rankade företagen.
Institutionell sälj/köp-kvot
Förutom att rapportera vanliga eget kapital- och skuldemissioner måste institutioner med mer än 100MM tillgångar under förvaltning också avslöja sina innehav av sälj- och köpoptioner. Eftersom säljoptioner i allmänhet indikerar ett negativt sentiment och köpoptioner indikerar ett positivt sentiment, kan vi få en uppfattning om det övergripande institutionella sentimentet genom att plotta förhållandet mellan säljoptioner och köpoptioner. Diagrammet till höger visar det historiska förhållandet mellan sälj- och köpoptioner för detta instrument.
Genom att använda sälj/köp-kvoten som en indikator på aktieägarnas sentiment undviker man en av de största bristerna med att använda det totala institutionella ägandet, nämligen att en betydande del av de förvaltade tillgångarna investeras passivt för att följa index. Passivt förvaltade fonder köper vanligtvis inte optioner, så indikatorn för sälj/köp-kvoten ger en bättre bild av stämningen i aktivt förvaltade fonder.
13F- och NPORT-arkiveringar
Detaljer om 13F-arkiveringar är gratis. Detaljer om NP-arkiveringar kräver ett premiummedlemskap. Gröna rader indikerar nya positioner. Röda rader indikerar stängda positioner. Klicka på länk symbolen för att se hela transaktionshistoriken.
Uppgradera
för att låsa upp premiumdata och exportera till Excel ![]() .
.
| Fil Datum | Källa | Investerare | Typ | Genomsnittligt pris (beräknat) |
Aktier | Δ Aktier (%) |
Rapporterat värde (1000 USD) |
Δ Värde (%) |
Portföljallokering (%) |
|
|---|---|---|---|---|---|---|---|---|---|---|
| 2025-08-12 | 13F | Reliant Wealth Planning | 17 629 | 44,98 | 350 | 46,03 | ||||
| 2025-04-22 | 13F | Mendota Financial Group, LLC | 0 | −100,00 | 0 | |||||
| 2025-07-16 | 13F | Old Port Advisors | 40 959 | 813 | ||||||
| 2025-08-14 | 13F | Susquehanna International Group, Llp | 0 | −100,00 | 0 | |||||
| 2025-07-08 | 13F | FF Advisors,LLC | 81 087 | 4,12 | 1 609 | 4,82 | ||||
| 2025-08-07 | 13F | Allworth Financial LP | 57 294 | 5 341,03 | 1 137 | 5 580,00 | ||||
| 2025-07-14 | 13F | UMA Financial Services, Inc. | 7 935 | 0,00 | 157 | 0,64 | ||||
| 2025-07-24 | 13F/A | TFR Capital, LLC. | 10 162 | −12,48 | 202 | −11,84 | ||||
| 2025-07-08 | 13F | Apella Capital, LLC | 20 845 | 0,11 | 409 | 0,49 | ||||
| 2025-07-30 | 13F | Granite Harbor Advisors, Inc. | 18 721 | 0,00 | 371 | 0,82 | ||||
| 2025-08-06 | 13F | Commonwealth Equity Services, Llc | 133 536 | 1,01 | 3 | 0,00 | ||||
| 2025-08-14 | 13F | Jane Street Group, Llc | 86 295 | 200,15 | 1 712 | 203,01 | ||||
| 2025-08-11 | 13F | United Capital Financial Advisers, Llc | 141 633 | 98,76 | 2 810 | 100,64 | ||||
| 2025-05-12 | 13F | Fmr Llc | 0 | −100,00 | 0 | |||||
| 2025-07-28 | 13F | Harbour Investments, Inc. | 12 940 | 564,61 | 257 | 573,68 | ||||
| 2025-07-08 | 13F | Parallel Advisors, LLC | 139 395 | 12,02 | 2 766 | 13,04 | ||||
| 2025-07-11 | 13F | Compass Ion Advisors, LLC | 26 997 | 0,00 | 536 | 0,94 | ||||
| 2025-08-13 | 13F | Flow Traders U.s. Llc | 0 | −100,00 | 0 | |||||
| 2025-08-01 | 13F | Logan Capital Management Inc | 330 | 7 | ||||||
| 2025-07-17 | 13F | Stockman Wealth Management, Inc. | 208 753 | 6,86 | 4 142 | 7,84 | ||||
| 2025-09-04 | 13F/A | Advisor Group Holdings, Inc. | 21 130 | −50,76 | 419 | −50,30 | ||||
| 2025-08-15 | 13F | Howland Capital Management Llc | 125 243 | 0,44 | 2 485 | 1,35 | ||||
| 2025-08-15 | 13F | Captrust Financial Advisors | 30 499 | 20,11 | 605 | 21,24 | ||||
| 2025-07-15 | 13F | BCS Wealth Management | 0 | −100,00 | 0 | |||||
| 2025-05-07 | 13F | Spectrum Wealth Counsel, LLC | 2 542 | 0,00 | 50 | 2,08 | ||||
| 2025-08-11 | 13F | Principal Securities, Inc. | 1 095 | 0,00 | 22 | 0,00 | ||||
| 2025-08-14 | 13F | Eight 31 Financial Llc | 81 485 | −25,32 | 1 617 | −24,66 | ||||
| 2025-08-14 | 13F | Smartleaf Asset Management LLC | 84 418 | −1,60 | 1 671 | −0,83 | ||||
| 2025-08-12 | 13F | Jpmorgan Chase & Co | 0 | −100,00 | 0 | |||||
| 2025-08-15 | 13F | Kestra Advisory Services, LLC | 74 067 | 17,82 | 1 469 | 18,95 | ||||
| 2025-08-11 | 13F | Guidance Point Advisors, LLC | 15 391 | 5,79 | 305 | 6,64 | ||||
| 2025-07-23 | 13F | Country Club Bank /gfn | 101 284 | −5,89 | 2 004 | −5,11 | ||||
| 2025-07-23 | 13F | Waycross Investment Management Co | 543 723 | 0,18 | 10 787 | 1,10 | ||||
| 2025-08-01 | 13F | Bank of Jackson Hole Trust | 3 745 | 0,00 | 74 | 1,37 | ||||
| 2025-08-14 | 13F | Financial Engines Advisors L.L.C. | 58 608 | 0,44 | 1 163 | 1,39 | ||||
| 2025-08-01 | 13F | Liberty Wealth Management Llc | 14 017 | 278 | ||||||
| 2025-07-08 | 13F | Lowe Wealth Advisors, LLC | 4 937 | −19,50 | 98 | −19,17 | ||||
| 2025-08-04 | 13F | Creative Financial Designs Inc /adv | 196 | 0,00 | 4 | 0,00 | ||||
| 2025-08-11 | 13F | Atlantic Private Wealth, LLC | 39 594 | −54,01 | 786 | −53,61 | ||||
| 2025-07-14 | 13F | U.S. Capital Wealth Advisors, LLC | 45 454 | 5,53 | 902 | 6,50 | ||||
| 2025-07-30 | 13F | Journey Advisory Group, LLC | 165 083 | 186,62 | 3 275 | 189,31 | ||||
| 2025-07-30 | 13F | Bogart Wealth, LLC | 3 560 | 0,00 | 71 | 1,45 | ||||
| 2025-08-12 | 13F | Proequities, Inc. | 0 | 0 | ||||||
| 2025-07-07 | 13F | Trust Co | 409 469 | −0,21 | 8 124 | 0,71 | ||||
| 2025-08-14 | 13F | Comerica Bank | 8 216 | −24,38 | 163 | −23,47 | ||||
| 2025-08-14 | 13F | Hilltop Holdings Inc. | 11 706 | 232 | ||||||
| 2025-08-14 | 13F | UBS Group AG | 280 525 | 0,19 | 5 566 | 1,11 | ||||
| 2025-07-23 | 13F | Valmark Advisers, Inc. | 51 049 | 15,80 | 1 013 | 16,86 | ||||
| 2025-08-12 | 13F | Waterloo Capital, L.P. | 11 900 | 0,00 | 236 | 1,29 | ||||
| 2025-07-08 | 13F | Legacy Private Trust Co. | 514 453 | 0,49 | 10 207 | 1,40 | ||||
| 2025-07-29 | 13F | Accretive Wealth Partners, LLC | 163 473 | 4,81 | 3 243 | 5,74 | ||||
| 2025-08-14 | 13F | Ameriprise Financial Inc | 116 555 | 4,46 | 2 312 | 5,43 | ||||
| 2025-08-13 | 13F | Hamel Associates, Inc. | 12 044 | 239 | ||||||
| 2025-07-30 | 13F | Strategic Blueprint, LLC | 38 443 | 763 | ||||||
| 2025-07-11 | 13F | First PREMIER Bank | 849 | −5,88 | 0 | |||||
| 2025-07-08 | 13F | Nbc Securities, Inc. | 41 632 | −3,81 | 1 | |||||
| 2025-08-13 | 13F | Holos Integrated Wealth LLC | 2 078 | 0,00 | 41 | 2,50 | ||||
| 2025-08-12 | 13F | Passive Capital Management, LLC. | 15 941 | 0,00 | 314 | 0,32 | ||||
| 2025-07-25 | 13F | Cwm, Llc | 17 570 | 28,84 | 0 | |||||
| 2025-07-14 | 13F | Mechanics Bank Trust Department | 94 500 | 5,29 | 1 875 | 6,24 | ||||
| 2025-07-24 | 13F | Leo Wealth, LLC | 25 096 | 1,76 | 498 | 2,69 | ||||
| 2025-08-12 | 13F | BlackRock, Inc. | 214 153 | 4 249 | ||||||
| 2025-08-07 | 13F | CENTRAL TRUST Co | 255 197 | 8,93 | 5 063 | 9,95 | ||||
| 2025-08-14 | 13F | Citadel Advisors Llc | 30 726 | −52,34 | 610 | −51,93 | ||||
| 2025-08-14 | 13F | Mml Investors Services, Llc | 24 934 | 137,15 | 0 | |||||
| 2025-08-05 | 13F | Cherry Tree Wealth Management, LLC | 4 963 | 14,12 | 98 | 15,29 | ||||
| 2025-08-14 | 13F | STAR Financial Bank | 106 985 | 10,92 | 2 123 | 11,92 | ||||
| 2025-08-18 | 13F/A | National Bank Of Canada /fi/ | 735 | 15 | ||||||
| 2025-07-09 | 13F | Krilogy Financial LLC | 372 535 | −0,08 | 7 391 | 0,83 | ||||
| 2025-07-14 | 13F | Park Avenue Securities Llc | 82 109 | 2 | ||||||
| 2025-08-15 | 13F | Morgan Stanley | 114 256 | 123,27 | 2 267 | 125,25 | ||||
| 2025-07-22 | 13F | Yoder Wealth Management, Inc. | 40 302 | 3,20 | 800 | 4,17 | ||||
| 2025-04-21 | 13F | Community Bank, N.A. | 0 | −100,00 | 0 | |||||
| 2025-07-24 | 13F | IFP Advisors, Inc | 125 270 | −3,11 | 2 485 | −2,20 | ||||
| 2025-08-01 | 13F | Envestnet Asset Management Inc | 1 152 213 | 83,76 | 22 860 | 85,44 | ||||
| 2025-08-07 | 13F | PFG Advisors | 47 524 | 943 | ||||||
| 2025-08-14 | 13F | Royal Bank Of Canada | 583 163 | 79,32 | 11 571 | 80,97 | ||||
| 2025-08-13 | 13F | Capital Analysts, Inc. | 2 354 | 0,00 | 0 | |||||
| 2025-05-06 | 13F | Venturi Wealth Management, LLC | 0 | −100,00 | 0 | |||||
| 2025-08-14 | 13F | GWM Advisors LLC | 7 352 | −83,09 | 146 | −83,02 | ||||
| 2025-08-18 | 13F/A | Kestra Investment Management, LLC | 17 745 | −49,58 | 352 | −49,06 | ||||
| 2025-07-29 | 13F | Mb, Levis & Associates, Llc | 848 | 0,95 | 17 | 0,00 | ||||
| 2025-04-29 | 13F | Element Wealth, LLC | 0 | −100,00 | 0 | |||||
| 2025-08-14 | 13F | Mercer Global Advisors Inc /adv | 639 493 | 886,29 | 12 688 | 895,84 | ||||
| 2025-08-14 | 13F | Integrated Wealth Concepts LLC | 62 996 | 0,24 | 1 250 | 1,13 | ||||
| 2025-08-13 | 13F | Cary Street Partners Financial Llc | 36 551 | 0,00 | 725 | 0,97 | ||||
| 2025-07-17 | 13F/A | Capital Investment Advisors, LLC | 14 720 | 25,03 | 292 | 26,41 | ||||
| 2025-08-14 | 13F | Stifel Financial Corp | 60 955 | 56,90 | 1 209 | 58,45 | ||||
| 2025-07-31 | 13F | Keeler THomas Management LLC | 79 894 | 28,12 | 1 585 | 29,39 | ||||
| 2025-08-07 | 13F | Parkside Financial Bank & Trust | 524 | 0,96 | 10 | 0,00 | ||||
| 2025-08-12 | 13F | Titleist Asset Management, Llc | 1 029 829 | 139,22 | 20 432 | 141,42 | ||||
| 2025-07-21 | 13F | Barrett & Company, Inc. | 4 163 | 125,03 | 83 | 127,78 | ||||
| 2025-08-11 | 13F | Private Advisor Group, LLC | 84 418 | −1,60 | 1 675 | −0,71 | ||||
| 2025-08-08 | 13F | Pnc Financial Services Group, Inc. | 71 | 0,00 | 1 | 0,00 | ||||
| 2025-07-16 | 13F | Rebalance, Llc | 11 274 | 224 | ||||||
| 2025-07-23 | 13F | Evexia Wealth Llc | 71 419 | 58,71 | 1 404 | 59,43 | ||||
| 2025-08-14 | 13F | Bank Of America Corp /de/ | 1 379 043 | 15,69 | 27 360 | 16,75 | ||||
| 2025-07-10 | 13F | Wealth Enhancement Advisory Services, Llc | 185 263 | 5,95 | 3 640 | 5,91 | ||||
| 2025-08-14 | 13F | AllSquare Wealth Management LLC | 22 266 | 0,69 | 442 | 1,61 | ||||
| 2025-07-17 | 13F | Chatham Capital Group, Inc. | 95 395 | 18,30 | 1 893 | 19,37 | ||||
| 2025-08-12 | 13F | Richmond Investment Services, LLC | 39 152 | 97,76 | 777 | 99,49 | ||||
| 2025-08-13 | 13F | Cerity Partners LLC | 23 884 | −0,37 | 474 | 0,42 | ||||
| 2025-08-08 | 13F | TD Capital Management LLC | 2 220 | 1,00 | 44 | 2,33 | ||||
| 2025-08-13 | 13F | Boston Family Office Llc | 99 546 | 24,46 | 2 | 0,00 | ||||
| 2025-08-14 | 13F | Goldman Sachs Group Inc | 0 | −100,00 | 0 | |||||
| 2025-08-19 | 13F | Asset Dedication, LLC | 3 384 | 13,63 | 67 | 15,52 | ||||
| 2025-07-21 | 13F | Crews Bank & Trust | 1 200 | 0,00 | 24 | 0,00 | ||||
| 2025-08-14 | 13F | Wells Fargo & Company/mn | 2 689 736 | 2,50 | 53 364 | 3,44 | ||||
| 2025-07-31 | 13F | Leavell Investment Management, Inc. | 13 725 | 272 | ||||||
| 2025-08-12 | 13F | Steward Partners Investment Advisory, Llc | 1 470 | 55,72 | 29 | 61,11 | ||||
| 2025-07-24 | 13F | Ronald Blue Trust, Inc. | 408 | 0,00 | 8 | 0,00 | ||||
| 2025-08-05 | 13F | Fullcircle Wealth Llc | 13 813 | 0,00 | 274 | 0,00 | ||||
| 2025-08-14 | 13F | Snowden Capital Advisors LLC | 427 386 | −0,25 | 8 479 | 0,66 | ||||
| 2025-05-02 | 13F | Whittier Trust Co | 0 | −100,00 | 0 | |||||
| 2025-08-12 | 13F | Associated Banc-corp | 50 546 | 15,98 | 1 003 | 17,06 | ||||
| 2025-07-01 | 13F | Confluence Investment Management Llc | 393 507 | −0,49 | 7 807 | 0,42 | ||||
| 2025-07-11 | 13F | Prosperity Planning, Inc. | 308 | 5,14 | ||||||
| 2025-05-12 | 13F | C2P Capital Advisory Group, LLC d.b.a. Prosperity Capital Advisors | 0 | −100,00 | 0 | −100,00 | ||||
| 2025-04-14 | 13F | Farther Finance Advisors, LLC | 0 | −100,00 | 0 | |||||
| 2025-07-08 | 13F | Atwood & Palmer Inc | 99 110 | −91,22 | 1 966 | −91,14 | ||||
| 2025-08-01 | 13F | James Investment Research Inc | 14 350 | 0,00 | 285 | 0,71 | ||||
| 2025-08-12 | 13F | LPL Financial LLC | 203 772 | −16,83 | 4 043 | −16,07 | ||||
| 2025-08-06 | 13F | AE Wealth Management LLC | 8 | 0 | ||||||
| 2025-08-08 | 13F | Cetera Investment Advisers | 253 494 | 4,51 | 5 029 | 5,47 | ||||
| 2025-07-30 | 13F | D.a. Davidson & Co. | 745 879 | 146,59 | 14 798 | 148,87 | ||||
| 2025-08-08 | 13F | Mv Capital Management, Inc. | 43 300 | 13,42 | 859 | 14,53 | ||||
| 2025-07-30 | 13F | Probity Advisors, Inc. | 435 300 | 4,57 | 8 636 | 5,54 | ||||
| 2025-07-21 | 13F | Cliftonlarsonallen Wealth Advisors, Llc | 82 180 | 111,74 | 1 630 | 113,63 | ||||
| 2025-08-08 | 13F | Thoroughbred Financial Services, Llc | 121 018 | −8,59 | 2 | 0,00 | ||||
| 2025-05-12 | 13F | Kohmann Bosshard Financial Services, LLC | 0 | −100,00 | 0 | |||||
| 2025-08-12 | 13F | Jaffetilchin Investment Partners, LLC | 13 369 | 0,98 | 265 | 1,92 | ||||
| 2025-08-08 | 13F | WASHINGTON TRUST Co | 0 | −100,00 | 0 | |||||
| 2025-08-12 | 13F | Coldstream Capital Management Inc | 14 739 | 0,00 | 292 | 1,04 | ||||
| 2025-07-17 | 13F | Janney Montgomery Scott LLC | 134 320 | 0,54 | 3 | 0,00 | ||||
| 2025-08-15 | 13F | Equitable Holdings, Inc. | 19 878 | 1,04 | 394 | 2,07 | ||||
| 2025-08-11 | 13F | HighTower Advisors, LLC | 145 363 | 1,79 | 2 884 | 2,74 | ||||
| 2025-07-16 | 13F | Signaturefd, Llc | 39 619 | 106,01 | 786 | 107,94 | ||||
| 2025-07-21 | 13F | Exchange Capital Management, Inc. | 16 239 | 2,26 | 322 | 3,21 | ||||
| 2025-07-24 | 13F | Us Bancorp \de\ | 3 360 | 61,54 | 67 | 65,00 | ||||
| 2025-08-14 | 13F | Raymond James Financial Inc | 402 086 | −19,20 | 7 977 | −18,46 | ||||
| 2025-08-14 | 13F | Colony Group, LLC | 32 307 | 10,15 | 641 | 11,11 | ||||
| 2025-08-12 | 13F | Jacobi Capital Management LLC | 19 219 | 6,30 | 381 | 7,32 | ||||
| 2025-07-31 | 13F | United Community Bank | 13 060 | 0,00 | 259 | 1,17 | ||||
| 2025-07-11 | 13F | Shelton Wealth Management, Llc | 385 684 | 4,88 | 7 652 | 5,84 | ||||
| 2025-07-30 | 13F | DecisionMap Wealth Management, LLC | 17 228 | 21,38 | 342 | 22,22 | ||||
| 2025-07-15 | 13F | Garrett Investment Advisors LLC | 13 602 | 0,56 | 270 | 1,51 | ||||
| 2025-07-31 | 13F | Cambridge Investment Research Advisors, Inc. | 11 958 | −28,67 | 0 | |||||
| 2025-08-13 | 13F | Northwestern Mutual Wealth Management Co | 83 733 | 11,59 | 1 661 | 12,61 |