Grundläggande statistik
| Institutionella ägare | 233 total, 233 long only, 0 short only, 0 long/short - change of 11,90% MRQ |
| Genomsnittlig portföljallokering | 0.1469 % - change of 9,31% MRQ |
| Institutionella aktier (lång) | 17 931 271 (ex 13D/G) - change of 0,78MM shares 4,55% MRQ |
| Institutionellt värde (lång) | $ 902 170 USD ($1000) |
Institutionellt ägande och aktieägare
Fidelity Covington Trust - Fidelity MSCI Utilities Index ETF (US:FUTY) har 233 Institutionella ägare och aktieägare som har lämnat in 13D/G- eller 13F-formulär till Securities Exchange Commission (SEC). Dessa institut innehar totalt 17,931,271 aktier. Största aktieägare inkluderar Bank Of America Corp /de/, AE Wealth Management LLC, Advisor Group Holdings, Inc., LPL Financial LLC, Lido Advisors, LLC, Kestra Advisory Services, LLC, Commonwealth Equity Services, Llc, Mariner, LLC, Morgan Stanley, and Cambridge Investment Research Advisors, Inc. .
Fidelity Covington Trust - Fidelity MSCI Utilities Index ETF (ARCA:FUTY) Institutionell ägarstruktur visar institutioners och fonders nuvarande positioner i företaget, samt de senaste förändringarna i positionernas storlek. Större aktieägare kan vara enskilda investerare, fonder, hedgefonder eller institutioner. Bilaga 13D visar att investeraren äger (eller ägde) mer än 5% av företaget och avser (eller avsåg) att aktivt eftersträva en förändring av affärsstrategin. Schedule 13G indikerar en passiv investering på över 5%.
The share price as of September 8, 2025 is 53,40 / share. Previously, on September 9, 2024, the share price was 49,30 / share. This represents an increase of 8,32% over that period.

Fondsentimentets poäng
Fondsentimentet poängen(fka Ägarackumulation-poäng) visar vilka aktier som är mest köpta av fonder. Det är resultatet av en sofistikerad kvantitativ flerfaktormodell som identifierar företag med de högsta nivåerna av institutionell ackumulering. Poängsättningsmodellen använder en kombination av den totala ökningen av redovisade ägare, förändringarna i portföljallokeringarna för dessa ägare och andra mått. Siffran sträcker sig från 0 till 100, där högre siffror indikerar en högre nivå av ackumulering i förhållande till sina konkurrenter, och 50 är genomsnittet.
Uppdateringsfrekvens: Dagligen
Se Ownership Explorer, som innehåller en lista över de högst rankade företagen.
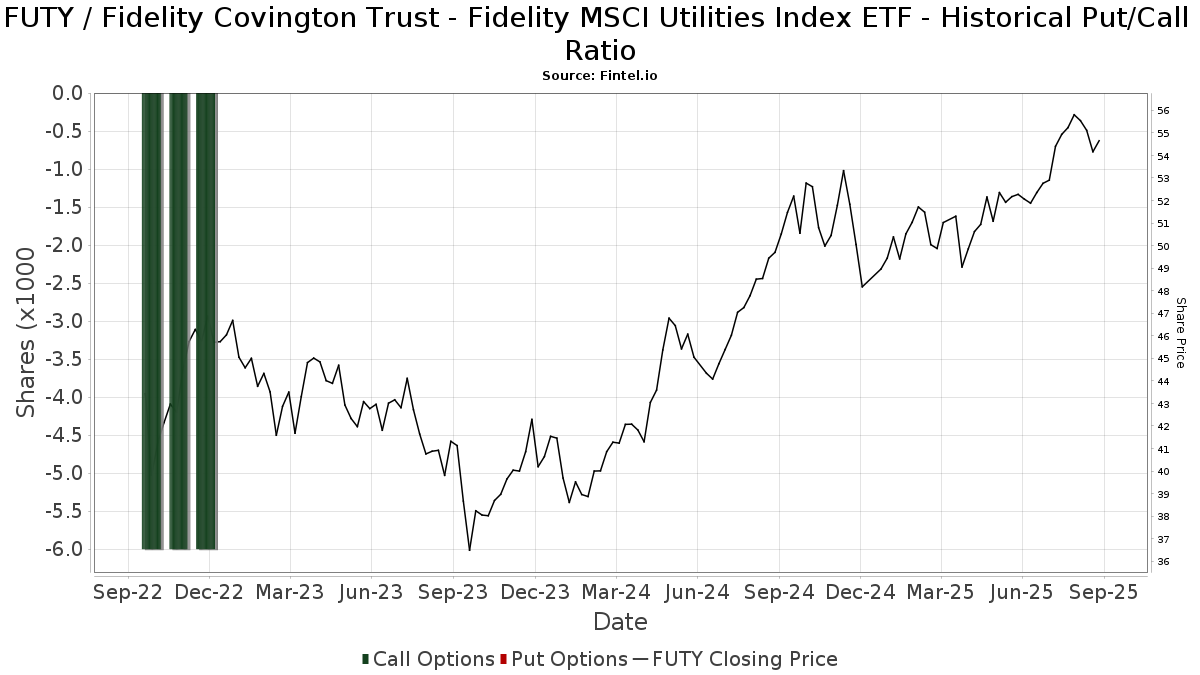
Institutionell sälj/köp-kvot
Förutom att rapportera vanliga eget kapital- och skuldemissioner måste institutioner med mer än 100MM tillgångar under förvaltning också avslöja sina innehav av sälj- och köpoptioner. Eftersom säljoptioner i allmänhet indikerar ett negativt sentiment och köpoptioner indikerar ett positivt sentiment, kan vi få en uppfattning om det övergripande institutionella sentimentet genom att plotta förhållandet mellan säljoptioner och köpoptioner. Diagrammet till höger visar det historiska förhållandet mellan sälj- och köpoptioner för detta instrument.
Genom att använda sälj/köp-kvoten som en indikator på aktieägarnas sentiment undviker man en av de största bristerna med att använda det totala institutionella ägandet, nämligen att en betydande del av de förvaltade tillgångarna investeras passivt för att följa index. Passivt förvaltade fonder köper vanligtvis inte optioner, så indikatorn för sälj/köp-kvoten ger en bättre bild av stämningen i aktivt förvaltade fonder.
13F- och NPORT-arkiveringar
Detaljer om 13F-arkiveringar är gratis. Detaljer om NP-arkiveringar kräver ett premiummedlemskap. Gröna rader indikerar nya positioner. Röda rader indikerar stängda positioner. Klicka på länk symbolen för att se hela transaktionshistoriken.
Uppgradera
för att låsa upp premiumdata och exportera till Excel ![]() .
.
| Fil Datum | Källa | Investerare | Typ | Genomsnittligt pris (beräknat) |
Aktier | Δ Aktier (%) |
Rapporterat värde (1000 USD) |
Δ Värde (%) |
Portföljallokering (%) |
|
|---|---|---|---|---|---|---|---|---|---|---|
| 2025-07-17 | 13F | Janney Montgomery Scott LLC | 5 632 | −1,83 | 0 | |||||
| 2025-08-14 | 13F | GWM Advisors LLC | 64 625 | 1,83 | 3 399 | 5,13 | ||||
| 2025-07-15 | 13F | Mather Group, Llc. | 0 | −100,00 | 0 | |||||
| 2025-08-29 | 13F | Centaurus Financial, Inc. | 2 060 | 0 | ||||||
| 2025-08-07 | 13F | Richard C. Young & CO., LTD. | 74 586 | −0,29 | 3 923 | 2,94 | ||||
| 2025-08-14 | 13F | Full Sail Capital, LLC | 30 569 | −1,04 | 1 608 | 2,16 | ||||
| 2025-08-08 | 13F | Beck Bode, LLC | 9 946 | −35,75 | 523 | −33,63 | ||||
| 2025-07-14 | 13F | Sweeney & Michel, Llc | 82 997 | 2,74 | 4 409 | 15,39 | ||||
| 2025-08-01 | 13F | Envestnet Asset Management Inc | 101 584 | −2,86 | 5 343 | 0,30 | ||||
| 2025-08-04 | 13F | Creative Financial Designs Inc /adv | 7 639 | 1,22 | 402 | 4,43 | ||||
| 2025-08-08 | 13F | Capital Investment Advisory Services, LLC | 27 446 | 3,81 | 1 444 | 7,13 | ||||
| 2025-08-15 | 13F | Kestra Advisory Services, LLC | 425 441 | 17,49 | 22 378 | 21,30 | ||||
| 2025-07-21 | 13F | Ameritas Advisory Services, LLC | 21 706 | 1,33 | 1 142 | 7,84 | ||||
| 2025-08-07 | 13F | Nwam Llc | 21 539 | 0,00 | 1 183 | 7,84 | ||||
| 2025-08-01 | 13F | Purkiss Capital Advisors LLC | 4 044 | 213 | ||||||
| 2025-08-08 | 13F | Avalon Trust Co | 4 600 | 242 | ||||||
| 2025-08-14 | 13F | Bnp Paribas Arbitrage, Sa | 50 000 | 2 630 | ||||||
| 2025-08-07 | 13F | Kestra Private Wealth Services, Llc | 4 234 | −9,20 | 223 | −6,33 | ||||
| 2025-08-14 | 13F | Snowden Capital Advisors LLC | 12 373 | −3,68 | 651 | −0,61 | ||||
| 2025-07-10 | 13F | Financial Management Network Inc | 12 851 | −0,16 | 678 | 10,98 | ||||
| 2025-07-14 | 13F | Sowell Financial Services LLC | 52 017 | 898,98 | 2 736 | 932,45 | ||||
| 2025-08-11 | 13F | PFG Private Wealth Management, LLC | 0 | −100,00 | 0 | |||||
| 2025-07-29 | 13F | Stableford Capital Ii Llc | 9 124 | 0,00 | 497 | 8,28 | ||||
| 2025-08-12 | 13F | Atlas Capital Advisors Llc | 34 041 | −10,87 | 1 791 | −7,97 | ||||
| 2025-04-01 | 13F | Modus Advisors, LLC | 0 | −100,00 | 0 | |||||
| 2025-08-05 | 13F | Smith Shellnut Wilson Llc /adv | 24 210 | 2,85 | 1 273 | 6,17 | ||||
| 2025-08-14 | 13F | Stifel Financial Corp | 23 591 | −0,86 | 1 241 | 2,31 | ||||
| 2025-08-14 | 13F | Fmr Llc | 31 466 | −18,04 | 1 655 | −15,39 | ||||
| 2025-07-18 | 13F | Rogco, Lp | 3 495 | 0,00 | 184 | 2,81 | ||||
| 2025-08-12 | 13F | Tableaux Llc | 20 638 | 1 287 | ||||||
| 2025-04-29 | 13F | Callan Capital, LLC | 8 974 | 0,00 | 457 | 4,58 | ||||
| 2025-08-14 | 13F/A | Rockefeller Capital Management L.P. | 20 804 | 26,23 | 1 094 | 30,39 | ||||
| 2025-08-05 | 13F | Sigma Planning Corp | 30 925 | −8,63 | 1 627 | −5,68 | ||||
| 2025-08-14 | 13F | Sunbelt Securities, Inc. | 13 328 | 1,99 | 650 | −2,26 | ||||
| 2025-07-15 | 13F | Fifth Third Bancorp | 290 | 249,40 | 15 | 275,00 | ||||
| 2025-07-24 | 13F | Galvin, Gaustad & Stein, LLC | 7 000 | −4,11 | 368 | −0,81 | ||||
| 2025-05-14 | 13F | Eqis Capital Management, Inc. | 0 | −100,00 | 0 | −100,00 | ||||
| 2025-08-11 | 13F | Estate Counselors, LLC | 268 885 | 177,96 | 14 143 | 186,99 | ||||
| 2025-08-06 | 13F | Aspetuck Financial Management LLC | 4 485 | 236 | ||||||
| 2025-08-08 | 13F | Gts Securities Llc | 0 | −100,00 | 0 | |||||
| 2025-04-29 | 13F | Element Wealth, LLC | 0 | −100,00 | 0 | |||||
| 2025-07-29 | 13F | Signature Estate & Investment Advisors Llc | 13 175 | 8,24 | 693 | 11,61 | ||||
| 2025-07-14 | 13F | AdvisorNet Financial, Inc | 238 | 0,42 | 13 | 0,00 | ||||
| 2025-05-15 | 13F/A | Orion Portfolio Solutions, LLC | 33 276 | −0,52 | 1 695 | 3,92 | ||||
| 2025-07-22 | 13F | Yoder Wealth Management, Inc. | 41 617 | 5,23 | 2 189 | 8,64 | ||||
| 2025-08-11 | 13F | Hexagon Capital Partners LLC | 0 | −100,00 | 0 | |||||
| 2025-08-18 | 13F | Geneos Wealth Management Inc. | 4 297 | 3,29 | 226 | 7,11 | ||||
| 2025-08-08 | 13F | Pnc Financial Services Group, Inc. | 7 984 | −0,42 | 420 | 2,70 | ||||
| 2025-08-12 | 13F | Jpmorgan Chase & Co | 566 | −49,96 | 30 | −49,12 | ||||
| 2025-08-12 | 13F | Steward Partners Investment Advisory, Llc | 65 486 | 1 086,56 | 3 445 | 1 125,62 | ||||
| 2025-08-12 | 13F | BlackRock, Inc. | 105 | 6 | ||||||
| 2025-08-07 | 13F | Investment Management Corp /va/ /adv | 22 974 | 0,10 | 1 208 | 3,34 | ||||
| 2025-07-16 | 13F | Southern Capital Advisors, Llc | 50 344 | 0,97 | 2 648 | 4,25 | ||||
| 2025-07-30 | 13F | Brookstone Capital Management | 12 235 | −85,17 | 644 | −84,71 | ||||
| 2025-08-04 | 13F | Simon Quick Advisors, Llc | 50 219 | 2 642 | ||||||
| 2025-07-23 | 13F | Fortis Advisors, LLC | 4 943 | 0,26 | 260 | 3,19 | ||||
| 2025-07-16 | 13F | Signature Resources Capital Management, LLC | 182 | 10 | ||||||
| 2025-07-31 | 13F | Cambridge Investment Research Advisors, Inc. | 304 328 | 9,26 | 16 | 14,29 | ||||
| 2025-08-13 | 13F | Everstar Asset Management, LLC | 6 100 | 0,00 | 321 | 3,23 | ||||
| 2025-08-13 | 13F | KDK Private Wealth Management, LLC | 5 777 | −4,05 | 304 | −0,98 | ||||
| 2025-08-04 | 13F | Flagship Harbor Advisors, Llc | 10 831 | 126,02 | 570 | 133,20 | ||||
| 2025-07-08 | 13F | Ballew Advisors, Inc | 6 562 | −8,24 | 346 | −1,98 | ||||
| 2025-08-01 | 13F | Penobscot Wealth Management | 4 382 | 0,85 | 231 | 4,07 | ||||
| 2025-08-14 | 13F | Raymond James Financial Inc | 90 158 | −1,77 | 4 742 | 1,41 | ||||
| 2025-07-30 | 13F | Whittier Trust Co Of Nevada Inc | 414 | −8,20 | 22 | −4,55 | ||||
| 2025-08-12 | 13F | Centric Wealth Management | 0 | −100,00 | 0 | |||||
| 2025-07-29 | 13F | FLC Capital Advisors | 8 128 | 0,00 | 428 | 3,14 | ||||
| 2025-08-08 | 13F | Cetera Investment Advisers | 45 142 | 14,02 | 2 374 | 17,70 | ||||
| 2025-08-19 | 13F | Advisory Services Network, LLC | 5 235 | −93,81 | 289 | −93,29 | ||||
| 2025-08-07 | 13F | PFG Advisors | 0 | −100,00 | 0 | |||||
| 2025-08-06 | 13F | Agf Management Ltd | 94 719 | 9,10 | 4 982 | 12,64 | ||||
| 2025-07-30 | 13F | Whittier Trust Co | 785 | 0,00 | 41 | 5,13 | ||||
| 2025-03-21 | 13F | Prostatis Group LLC | 0 | −100,00 | 0 | |||||
| 2025-08-12 | 13F | O'shaughnessy Asset Management, Llc | 1 079 | 31,75 | 57 | 36,59 | ||||
| 2025-08-14 | 13F | Clarity Asset Management, Inc. | 390 | 0,78 | 20 | 5,26 | ||||
| 2025-05-02 | 13F | Capital A Wealth Management, LLC | 100 | 400,00 | 5 | |||||
| 2025-04-23 | 13F | Golden State Wealth Management, LLC | 0 | −100,00 | 0 | |||||
| 2025-07-17 | 13F | Raleigh Capital Management Inc. | 3 | 50,00 | 0 | |||||
| 2025-08-14 | 13F | MidWestOne Financial Group, Inc. | 5 500 | 0,00 | 289 | 3,21 | ||||
| 2025-07-14 | 13F | Conrad Siegel Investment Advisors, Inc. | 74 306 | −2,19 | 3 908 | 0,98 | ||||
| 2025-08-13 | 13F | Colonial Trust Advisors | 200 | 0,00 | 11 | 0,00 | ||||
| 2025-08-21 | 13F | Pathway Financial Advisers, LLC | 4 898 | 3,79 | 258 | 7,08 | ||||
| 2025-08-07 | 13F | Allworth Financial LP | 55 | 0,00 | 3 | 0,00 | ||||
| 2025-07-25 | 13F | Apollon Wealth Management, LLC | 118 415 | 6,34 | 6 229 | 9,78 | ||||
| 2025-08-13 | 13F | Jones Financial Companies Lllp | 6 110 | 111,42 | 320 | 120,69 | ||||
| 2025-08-15 | 13F | Tower Research Capital LLC (TRC) | 16 031 | 843 | ||||||
| 2025-07-30 | 13F | Axecap Investments, LLC | 16 868 | 22,92 | 887 | 26,90 | ||||
| 2025-08-12 | 13F | Proequities, Inc. | 0 | 0 | ||||||
| 2025-08-11 | 13F | Elite Financial, Inc. | 16 634 | −6,79 | 1 | |||||
| 2025-08-08 | 13F | Crossmark Global Holdings, Inc. | 17 277 | 0,00 | 909 | 3,30 | ||||
| 2025-08-08 | 13F | Smithfield Trust Co | 37 | 0 | ||||||
| 2025-07-30 | NP | ENDW - Cambria Endowment Style ETF | 65 | 3 | ||||||
| 2025-08-14 | 13F | Susquehanna International Group, Llp | 41 908 | 164,91 | 2 204 | 173,45 | ||||
| 2025-07-30 | 13F | Wbh Advisory Inc | 6 884 | 0,85 | 362 | 4,32 | ||||
| 2025-07-11 | 13F | Grove Bank & Trust | 93 | 5 | ||||||
| 2025-08-14 | 13F | UBS Group AG | 86 534 | 26,31 | 4 552 | 30,40 | ||||
| 2025-08-12 | 13F | AlphaCore Capital LLC | 9 235 | 486 | ||||||
| 2025-08-08 | 13F | Kingsview Wealth Management, LLC | 5 540 | 1,60 | 291 | 5,05 | ||||
| 2025-08-04 | 13F | Creekmur Asset Management LLC | 3 | −25,00 | 0 | |||||
| 2025-05-14 | 13F | 1620 Investment Advisors, Inc. | 0 | −100,00 | 0 | |||||
| 2025-07-14 | 13F | Farmers & Merchants Investments Inc | 81 | 0,00 | 4 | 0,00 | ||||
| 2025-08-14 | 13F | Hrt Financial Lp | 3 854 | 0 | ||||||
| 2025-08-01 | 13F | Logan Capital Management Inc | 22 | 0,00 | 1 | 0,00 | ||||
| 2025-07-29 | 13F | Activest Wealth Management | 38 | 0,00 | 2 | 100,00 | ||||
| 2025-08-07 | 13F | Montag A & Associates Inc | 48 | 3 | ||||||
| 2025-04-21 | 13F | Nelson, Van Denburg & Campbell Wealth Management Group, LLC | 0 | −100,00 | 0 | |||||
| 2025-08-11 | 13F | Advisor Resource Council | 5 660 | 298 | ||||||
| 2025-08-05 | 13F | Key FInancial Inc | 124 | 69,86 | 7 | 100,00 | ||||
| 2025-08-14 | 13F | Wells Fargo & Company/mn | 45 610 | 12,50 | 2 399 | 16,17 | ||||
| 2025-08-11 | 13F | Independent Advisor Alliance | 11 279 | 593 | ||||||
| 2025-05-09 | 13F | Generation Capital Management LLC | 0 | −100,00 | 0 | |||||
| 2025-07-16 | 13F | ORG Partners LLC | 600 | 32 | ||||||
| 2025-07-24 | 13F | IFP Advisors, Inc | 1 171 | 0,00 | 62 | 3,39 | ||||
| 2025-08-14 | 13F | CoreCap Advisors, LLC | 3 225 | 37,82 | 170 | 42,02 | ||||
| 2025-08-07 | 13F | Parkside Financial Bank & Trust | 12 | 0,00 | 1 | |||||
| 2025-08-13 | 13F | Quadrature Capital Ltd | 0 | −100,00 | 0 | |||||
| 2025-05-15 | 13F | Proquility Private Wealth Partners, LLC | 48 717 | 34,97 | 2 482 | 41,02 | ||||
| 2025-05-13 | 13F | Bank Of Montreal /can/ | 0 | −100,00 | 0 | |||||
| 2025-07-29 | 13F | BKM Wealth Management, LLC | 4 960 | 0,00 | 261 | 3,17 | ||||
| 2025-07-25 | 13F | Concord Wealth Partners | 29 | 0,00 | 2 | 0,00 | ||||
| 2025-07-08 | 13F | Nbc Securities, Inc. | 375 | 0,00 | 0 | |||||
| 2025-08-14 | 13F | Kovitz Investment Group Partners, LLC | 200 752 | 305,49 | 10 560 | 318,68 | ||||
| 2025-07-30 | 13F | D.a. Davidson & Co. | 4 308 | 9,17 | 227 | 12,44 | ||||
| 2025-08-14 | 13F | Citadel Advisors Llc | 4 992 | −60,87 | 263 | −59,69 | ||||
| 2025-07-30 | 13F | Strategic Blueprint, LLC | 8 934 | 470 | ||||||
| 2025-08-14 | 13F | Federation des caisses Desjardins du Quebec | 1 593 | 84 | ||||||
| 2025-07-25 | 13F | Ellis Investment Partners, LLC | 7 112 | 0,58 | 374 | 3,89 | ||||
| 2025-08-14 | 13F | Two Sigma Investments, Lp | 0 | −100,00 | 0 | |||||
| 2025-07-21 | 13F | Hilltop National Bank | 495 | 0,00 | 26 | 8,33 | ||||
| 2025-07-28 | 13F | BRYN MAWR TRUST Co | 13 623 | 36,67 | 717 | 41,22 | ||||
| 2025-08-04 | 13F | IFG Advisory, LLC | 149 700 | 1,25 | 7 874 | 4,53 | ||||
| 2025-08-14 | 13F | Mercer Global Advisors Inc /adv | 12 259 | −19,83 | 645 | −17,33 | ||||
| 2025-07-31 | 13F | Briaud Financial Planning, Inc | 582 | 0 | ||||||
| 2025-07-22 | 13F | D.B. Root & Company, LLC | 4 377 | 0,00 | 230 | 3,14 | ||||
| 2025-08-04 | 13F | Spire Wealth Management | 330 | 0,61 | 17 | 6,25 | ||||
| 2025-04-29 | 13F | Lee Danner & Bass Inc | 0 | −100,00 | 0 | −100,00 | ||||
| 2025-07-25 | 13F | Atria Wealth Solutions, Inc. | 18 234 | −4,21 | 961 | −0,93 | ||||
| 2025-07-22 | 13F | Accel Wealth Management | 7 583 | 0,53 | 399 | 3,65 | ||||
| 2025-07-09 | 13F | Tounjian Advisory Partners, Llc | 11 576 | −3,15 | 590 | −3,12 | ||||
| 2025-08-14 | 13F | Mml Investors Services, Llc | 35 431 | 1,74 | 2 | 0,00 | ||||
| 2025-08-11 | 13F | Aptus Capital Advisors, LLC | 17 | 0,00 | 1 | |||||
| 2025-07-24 | 13F | Blair William & Co/il | 6 222 | −4,07 | 327 | −0,91 | ||||
| 2025-07-28 | 13F | Harbour Investments, Inc. | 18 565 | 2,13 | 977 | 5,40 | ||||
| 2025-08-06 | 13F | AE Wealth Management LLC | 873 184 | 0,22 | 45 930 | 3,47 | ||||
| 2025-08-08 | 13F | Avantax Advisory Services, Inc. | 32 785 | −12,24 | 1 724 | −9,41 | ||||
| 2025-08-12 | 13F | Global Retirement Partners, LLC | 1 377 | −50,27 | 72 | −46,67 | ||||
| 2025-07-23 | 13F | Heck Capital Advisors, LLC | 27 940 | 0,88 | 1 470 | 4,11 | ||||
| 2025-08-12 | 13F | SRS Capital Advisors, Inc. | 152 | 8 | ||||||
| 2025-07-18 | 13F | Vicus Capital | 8 869 | 10,85 | 466 | 14,50 | ||||
| 2025-07-24 | 13F | Eastern Bank | 1 330 | 70 | ||||||
| 2025-08-13 | 13F | Quadrant Capital Group Llc | 0 | −100,00 | 0 | |||||
| 2025-08-13 | 13F | Renaissance Technologies Llc | 11 000 | 579 | ||||||
| 2025-07-07 | 13F | Nova Wealth Management, Inc. | 1 743 | 2 000,00 | 92 | 2 175,00 | ||||
| 2025-08-05 | 13F | Simplex Trading, Llc | 0 | −100,00 | 0 | |||||
| 2025-07-11 | 13F | Farther Finance Advisors, LLC | 485 | 0,00 | 26 | 4,17 | ||||
| 2025-04-01 | NP | MSMR - McElhenny Sheffield Managed Risk ETF | 0 | −100,00 | 0 | −100,00 | ||||
| 2025-08-27 | 13F/A | Brinker Capital Investments, LLC | 35 625 | 7,06 | 1 874 | 10,50 | ||||
| 2025-07-09 | 13F | Reyes Financial Architecture, Inc. | 0 | −100,00 | 0 | |||||
| 2025-07-31 | 13F | Sage Mountain Advisors LLC | 392 | 0,00 | 21 | 5,26 | ||||
| 2025-08-12 | 13F | Jaffetilchin Investment Partners, LLC | 23 959 | −0,27 | 1 260 | 2,94 | ||||
| 2025-08-13 | 13F | Summit Financial, LLC | 4 397 | −10,01 | 231 | −6,85 | ||||
| 2025-08-12 | 13F | Nemes Rush Group LLC | 110 | 6 | ||||||
| 2025-05-01 | 13F | Grant/GrossMendelsohn, LLC | 61 444 | 3 124 | ||||||
| 2025-07-24 | 13F | Ronald Blue Trust, Inc. | 156 | −4,29 | 8 | 0,00 | ||||
| 2025-07-24 | 13F | Us Bancorp \de\ | 203 | 11 | ||||||
| 2025-08-05 | 13F | EPG Wealth Management LLC | 931 | 0,65 | 49 | 2,13 | ||||
| 2025-08-11 | 13F | HighTower Advisors, LLC | 162 385 | −35,32 | 8 541 | −33,23 | ||||
| 2025-08-12 | 13F | MAI Capital Management | 586 | 2,45 | 31 | 3,45 | ||||
| 2025-04-23 | 13F | PMV Capital Advisers, LLC | 0 | −100,00 | 0 | |||||
| 2025-08-11 | 13F | Private Advisor Group, LLC | 12 400 | −44,06 | 652 | −42,25 | ||||
| 2025-08-12 | 13F | J.w. Cole Advisors, Inc. | 23 984 | 44,67 | 1 262 | 49,41 | ||||
| 2025-09-04 | 13F/A | Advisor Group Holdings, Inc. | 745 001 | 28,68 | 39 209 | 32,84 | ||||
| 2025-08-01 | 13F | SYM FINANCIAL Corp | 61 | 3 | ||||||
| 2025-07-15 | 13F | Lynch & Associates/in | 13 605 | 1,96 | 716 | 5,30 | ||||
| 2025-08-14 | 13F | Modern Wealth Management, LLC | 65 200 | 0,64 | 3 430 | 3,91 | ||||
| 2025-07-28 | 13F | Duncker Streett & Co Inc | 12 | 0,00 | 1 | |||||
| 2025-07-15 | 13F | GSB Wealth Management, LLC | 54 636 | 0,62 | 2 874 | 3,87 | ||||
| 2025-07-16 | 13F | Essex Financial Services, Inc. | 8 824 | 464 | ||||||
| 2025-08-05 | 13F | Centennial Bank/AR/ | 48 | −27,27 | 3 | −33,33 | ||||
| 2025-08-14 | 13F | Bank Of America Corp /de/ | 8 795 631 | 1,99 | 462 650 | 5,29 | ||||
| 2025-08-05 | 13F | Trail Ridge Investment Advisors, LLC | 7 958 | −4,45 | 440 | 3,54 | ||||
| 2025-04-21 | 13F | PSI Advisors, LLC | 0 | −100,00 | 0 | |||||
| 2025-08-08 | 13F | Independence Financial Advisors, LLC | 7 076 | 0,01 | 372 | 3,33 | ||||
| 2025-07-09 | 13F | Archer Investment Management, LLC | 35 559 | 3,12 | 1 870 | 6,49 | ||||
| 2025-08-14 | 13F | Glen Eagle Advisors, LLC | 1 517 | 0,00 | 80 | 2,60 | ||||
| 2025-08-05 | 13F | GHP Investment Advisors, Inc. | 1 300 | 0,00 | 68 | 3,03 | ||||
| 2025-07-17 | 13F | Hanson & Doremus Investment Management | 613 | 0,00 | 0 | |||||
| 2025-07-30 | 13F | Demars Financial Group, LLC | 11 284 | −98,04 | 594 | 5 290,91 | ||||
| 2025-07-15 | 13F | Northside Capital Management, LLC | 3 990 | 210 | ||||||
| 2025-08-06 | 13F | Rialto Wealth Management, LLC | 753 | 0,00 | 40 | 2,63 | ||||
| 2025-08-05 | 13F | Lifeworks Advisors, LLC | 33 187 | −1,09 | 1 746 | 2,11 | ||||
| 2025-08-14 | 13F | D. E. Shaw & Co., Inc. | 15 728 | −49,92 | 827 | −48,31 | ||||
| 2025-05-08 | 13F | Mesirow Financial Investment Management, Inc. | 0 | −100,00 | 0 | |||||
| 2025-08-04 | 13F | Arkadios Wealth Advisors | 14 648 | −82,43 | 770 | −81,87 | ||||
| 2025-08-12 | 13F | Franklin Resources Inc | 0 | −100,00 | 0 | |||||
| 2025-08-08 | 13F | Larson Financial Group LLC | 395 | 0,77 | 21 | 5,26 | ||||
| 2025-07-10 | 13F | Wealth Enhancement Advisory Services, Llc | 7 905 | 0,89 | 417 | 4,26 | ||||
| 2025-08-15 | 13F | CI Private Wealth, LLC | 3 951 | 208 | ||||||
| 2025-08-12 | 13F | Change Path, LLC | 15 060 | 26,23 | 792 | 30,48 | ||||
| 2025-05-15 | 13F | Newbridge Financial Services Group, Inc. | 0 | −100,00 | 0 | |||||
| 2025-07-14 | 13F | GAMMA Investing LLC | 190 | 0,00 | 10 | 0,00 | ||||
| 2025-07-17 | 13F | Emerald Advisors, LLC | 13 915 | 732 | ||||||
| 2025-07-07 | 13F | Roxbury Financial LLC | 1 394 | 0,65 | 73 | 4,29 | ||||
| 2025-08-26 | 13F | Claris Financial LLC | 7 893 | 0,00 | 415 | 8,07 | ||||
| 2025-08-14 | 13F | Warren Averett Asset Management, LLC | 61 900 | 1,94 | 3 256 | 5,24 | ||||
| 2025-07-16 | 13F | American National Bank | 11 134 | 10,63 | 586 | 14,26 | ||||
| 2025-05-09 | 13F | GeoWealth Management, LLC | 0 | −100,00 | 0 | |||||
| 2025-08-14 | 13F | Mariner, LLC | 353 039 | 1 909,33 | 18 570 | 1 974,75 | ||||
| 2025-08-13 | 13F | Northwestern Mutual Wealth Management Co | 8 205 | −89,16 | 432 | −88,82 | ||||
| 2025-07-21 | 13F | HighMark Wealth Management LLC | 250 | 0,00 | 13 | 8,33 | ||||
| 2025-07-29 | 13F | Primoris Wealth Advisors, Llc | 46 425 | 110,31 | 2 442 | 117,17 | ||||
| 2025-07-23 | 13F | Traphagen Investment Advisors Llc | 66 763 | −3,26 | 3 512 | −0,14 | ||||
| 2025-08-14 | 13F | Goldman Sachs Group Inc | 22 547 | 109,33 | 1 186 | 116,24 | ||||
| 2025-08-14 | 13F | Comerica Bank | 4 052 | 23,16 | 213 | 27,54 | ||||
| 2025-07-16 | 13F | Signaturefd, Llc | 0 | −100,00 | 0 | |||||
| 2025-08-05 | 13F | Huntington National Bank | 105 | −1,87 | ||||||
| 2025-08-01 | 13F | Schmidt P J Investment Management Inc | 6 077 | −2,03 | 320 | 0,95 | ||||
| 2025-08-13 | 13F | Lido Advisors, LLC | 574 513 | 11,98 | 30 219 | 15,61 | ||||
| 2025-08-05 | 13F | Carolinas Wealth Consulting Llc | 0 | −100,00 | 0 | |||||
| 2025-08-14 | 13F | Royal Bank Of Canada | 21 511 | 45,47 | 1 132 | 50,13 | ||||
| 2025-05-15 | 13F | Gibson Wealth Advisors LLC | 0 | −100,00 | 0 | |||||
| 2025-08-13 | 13F | Capital Analysts, Inc. | 0 | −100,00 | 0 | |||||
| 2025-08-14 | 13F | LifePlan Investment Advisors, Inc. | 58 687 | −0,93 | 3 087 | 2,25 | ||||
| 2025-08-06 | 13F | Stone House Investment Management, LLC | 4 815 | 253 | ||||||
| 2025-07-16 | 13F/A | CX Institutional | 7 143 | 93,21 | 0 | |||||
| 2025-07-30 | 13F | Gimbal Financial | 168 867 | 8 882 | ||||||
| 2025-07-30 | 13F | IMG Wealth Management, Inc. | 639 | 34 | ||||||
| 2025-08-15 | 13F | Morgan Stanley | 346 248 | 15,53 | 18 213 | 19,27 | ||||
| 2025-07-21 | 13F | Exchange Capital Management, Inc. | 9 242 | −2,73 | 486 | 0,41 | ||||
| 2025-08-14 | 13F | Qube Research & Technologies Ltd | 2 791 | 147 | ||||||
| 2025-09-03 | 13F | Q3 Asset Management | 0 | −100,00 | 0 | |||||
| 2025-07-28 | 13F | RFG Advisory, LLC | 19 319 | 37,00 | 1 016 | 41,50 | ||||
| 2025-08-13 | 13F | Congress Wealth Management LLC / DE / | 13 380 | 704 | ||||||
| 2025-07-23 | 13F | Kingswood Wealth Advisors, Llc | 41 304 | 2,08 | 2 173 | 5,39 | ||||
| 2025-07-02 | 13F | Marotta Asset Management | 4 132 | 217 | ||||||
| 2025-07-15 | 13F | Elevated Capital Advisors, LLC | 13 881 | 0,00 | 707 | 0,00 | ||||
| 2025-07-10 | 13F | Sovran Advisors, LLC | 6 247 | 10,63 | 327 | 14,79 | ||||
| 2025-08-12 | 13F | OneAscent Financial Services LLC | 16 745 | 1 | ||||||
| 2025-07-17 | 13F | Smith, Salley & Associates | 13 599 | 0,48 | 715 | 3,77 | ||||
| 2025-08-13 | 13F | Russell Investments Group, Ltd. | 14 | 0,00 | 1 | |||||
| 2025-08-12 | 13F | Founders Financial Alliance, LLC | 38 | 0,00 | 2 | 0,00 | ||||
| 2025-08-06 | 13F | Maltin Wealth Management, Inc. | 46 378 | 4,01 | 2 440 | 7,40 | ||||
| 2025-07-23 | 13F | Valmark Advisers, Inc. | 90 030 | −0,95 | 4 736 | 2,25 | ||||
| 2025-08-12 | 13F | Coston, McIsaac & Partners | 616 | 0,65 | 0 | |||||
| 2025-07-09 | 13F | Dynamic Advisor Solutions LLC | 43 413 | −1,23 | 2 284 | 1,97 | ||||
| 2025-07-25 | 13F | Cwm, Llc | 800 | 0,63 | 0 | |||||
| 2025-07-30 | 13F | VCI Wealth Management LLC | 7 494 | 7,64 | 394 | 11,30 | ||||
| 2025-07-07 | 13F | Versant Capital Management, Inc | 524 | 0,00 | 28 | 3,85 | ||||
| 2025-08-04 | 13F | Prairie Wealth Advisors, Inc. | 16 711 | 1,87 | 879 | 5,15 | ||||
| 2025-07-21 | 13F | Barrett & Company, Inc. | 11 | 0,00 | 1 | |||||
| 2025-05-14 | 13F | Jane Street Group, Llc | 0 | −100,00 | 0 | |||||
| 2025-07-30 | 13F | Cullen/frost Bankers, Inc. | 23 | 4,55 | 1 | 0,00 | ||||
| 2025-07-17 | 13F | Robbins Farley Llc | 26 | −3,70 | 1 | 0,00 | ||||
| 2025-07-16 | 13F | Beaumont Financial Advisors, LLC | 58 017 | −1,21 | 3 052 | 1,97 | ||||
| 2025-08-11 | 13F | Citigroup Inc | 7 305 | 56,76 | 384 | 62,03 | ||||
| 2025-08-12 | 13F | LPL Financial LLC | 606 961 | 12,34 | 31 926 | 15,98 | ||||
| 2025-07-10 | 13F | Global Financial Private Client, LLC | 10 326 | 37,83 | 543 | 42,52 | ||||
| 2025-08-11 | 13F | Principal Securities, Inc. | 2 724 | 59,86 | 143 | 72,29 | ||||
| 2025-07-17 | 13F | Centennial Wealth Advisory LLC | 6 636 | −6,64 | 351 | −3,31 | ||||
| 2025-08-05 | 13F | BEAM Asset Management, LLC | 15 880 | −0,38 | 835 | 2,83 | ||||
| 2025-07-17 | 13F | Sound Income Strategies, LLC | 552 | 0,00 | 29 | 3,57 | ||||
| 2025-07-31 | 13F | Glass Jacobson Investment Advisors llc | 13 247 | 4,81 | 697 | 12,99 | ||||
| 2025-08-12 | 13F | Bokf, Na | 0 | −100,00 | 0 | |||||
| 2025-05-14 | 13F | CIBC Private Wealth Group, LLC | 0 | −100,00 | 0 | −100,00 | ||||
| 2025-07-29 | 13F | Tradewinds Capital Management, LLC | 75 | 0,00 | 4 | 0,00 | ||||
| 2025-08-01 | 13F | Rossby Financial, LCC | 5 388 | 283 | ||||||
| 2025-04-09 | 13F | HBW Advisory Services LLC | 0 | −100,00 | 0 | −100,00 | ||||
| 2025-08-14 | 13F | Ameriprise Financial Inc | 77 542 | 4,53 | 4 079 | 7,94 | ||||
| 2025-08-06 | 13F | Commonwealth Equity Services, Llc | 383 892 | 3,53 | 20 | 11,11 | ||||
| 2025-07-22 | 13F | Mascoma Wealth Management LLC | 11 565 | −13,67 | 608 | −10,85 | ||||
| 2025-08-11 | 13F | Brown Brothers Harriman & Co | 27 | −72,16 | 1 | −75,00 | ||||
| 2025-08-13 | 13F | Colonial Trust Co / SC | 828 | 0,00 | 44 | 2,38 |