Grundläggande statistik
| Institutionella ägare | 134 total, 131 long only, 0 short only, 3 long/short - change of 3,08% MRQ |
| Genomsnittlig portföljallokering | 0.1477 % - change of −2,79% MRQ |
| Institutionella aktier (lång) | 37 666 287 (ex 13D/G) - change of 27,85MM shares 283,56% MRQ |
| Institutionellt värde (lång) | $ 186 071 USD ($1000) |
Institutionellt ägande och aktieägare
Fidus Investment Corporation (US:FDUS) har 134 Institutionella ägare och aktieägare som har lämnat in 13D/G- eller 13F-formulär till Securities Exchange Commission (SEC). Dessa institut innehar totalt 37,666,287 aktier. Största aktieägare inkluderar Kingstone Capital Partners Texas, LLC, Van Eck Associates Corp, Raymond James Financial Inc, BIZD - VanEck Vectors BDC Income ETF, Invesco Ltd., KBWD - Invesco KBW High Dividend Yield Financial ETF, Two Sigma Advisers, Lp, Cetera Investment Advisers, Envestnet Asset Management Inc, and Columbus Macro, LLC .
Fidus Investment Corporation (NasdaqGS:FDUS) Institutionell ägarstruktur visar institutioners och fonders nuvarande positioner i företaget, samt de senaste förändringarna i positionernas storlek. Större aktieägare kan vara enskilda investerare, fonder, hedgefonder eller institutioner. Bilaga 13D visar att investeraren äger (eller ägde) mer än 5% av företaget och avser (eller avsåg) att aktivt eftersträva en förändring av affärsstrategin. Schedule 13G indikerar en passiv investering på över 5%.
The share price as of September 5, 2025 is 21,39 / share. Previously, on September 9, 2024, the share price was 19,90 / share. This represents an increase of 7,49% over that period.

Fondsentimentets poäng
Fondsentimentet poängen(fka Ägarackumulation-poäng) visar vilka aktier som är mest köpta av fonder. Det är resultatet av en sofistikerad kvantitativ flerfaktormodell som identifierar företag med de högsta nivåerna av institutionell ackumulering. Poängsättningsmodellen använder en kombination av den totala ökningen av redovisade ägare, förändringarna i portföljallokeringarna för dessa ägare och andra mått. Siffran sträcker sig från 0 till 100, där högre siffror indikerar en högre nivå av ackumulering i förhållande till sina konkurrenter, och 50 är genomsnittet.
Uppdateringsfrekvens: Dagligen
Se Ownership Explorer, som innehåller en lista över de högst rankade företagen.
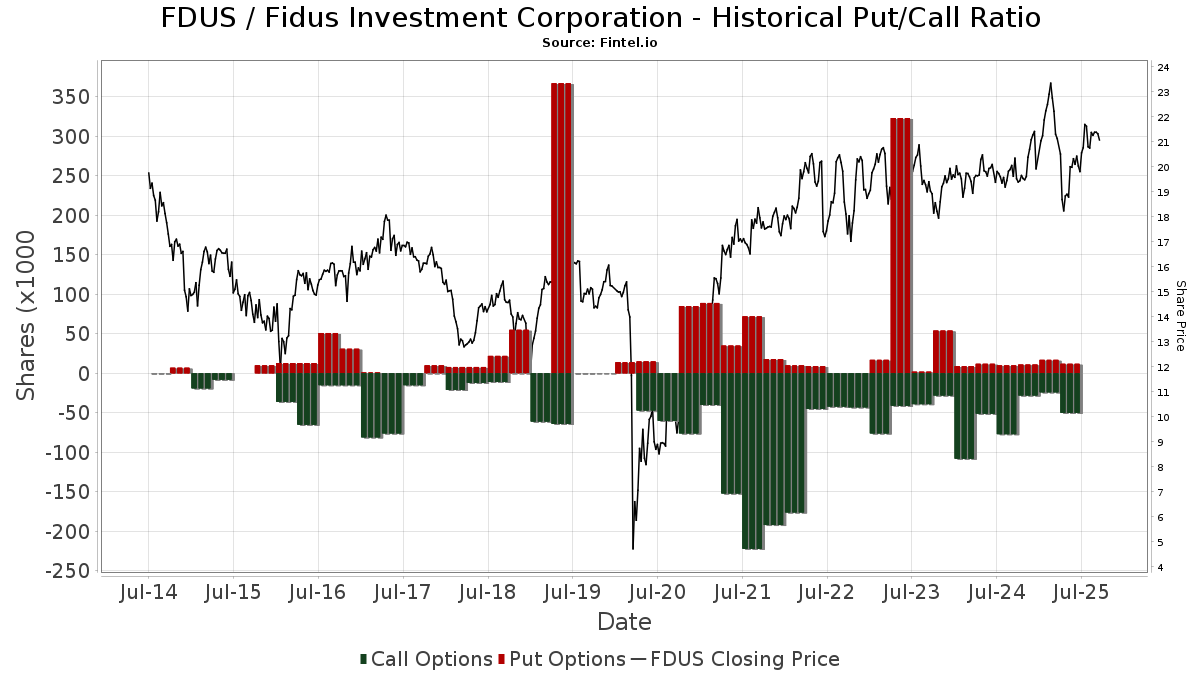
Institutionell sälj/köp-kvot
Förutom att rapportera vanliga eget kapital- och skuldemissioner måste institutioner med mer än 100MM tillgångar under förvaltning också avslöja sina innehav av sälj- och köpoptioner. Eftersom säljoptioner i allmänhet indikerar ett negativt sentiment och köpoptioner indikerar ett positivt sentiment, kan vi få en uppfattning om det övergripande institutionella sentimentet genom att plotta förhållandet mellan säljoptioner och köpoptioner. Diagrammet till höger visar det historiska förhållandet mellan sälj- och köpoptioner för detta instrument.
Genom att använda sälj/köp-kvoten som en indikator på aktieägarnas sentiment undviker man en av de största bristerna med att använda det totala institutionella ägandet, nämligen att en betydande del av de förvaltade tillgångarna investeras passivt för att följa index. Passivt förvaltade fonder köper vanligtvis inte optioner, så indikatorn för sälj/köp-kvoten ger en bättre bild av stämningen i aktivt förvaltade fonder.
13F- och NPORT-arkiveringar
Detaljer om 13F-arkiveringar är gratis. Detaljer om NP-arkiveringar kräver ett premiummedlemskap. Gröna rader indikerar nya positioner. Röda rader indikerar stängda positioner. Klicka på länk symbolen för att se hela transaktionshistoriken.
Uppgradera
för att låsa upp premiumdata och exportera till Excel ![]() .
.
| Fil Datum | Källa | Investerare | Typ | Genomsnittligt pris (beräknat) |
Aktier | Δ Aktier (%) |
Rapporterat värde (1000 USD) |
Δ Värde (%) |
Portföljallokering (%) |
|
|---|---|---|---|---|---|---|---|---|---|---|
| 2025-08-06 | 13F | First Horizon Advisors, Inc. | 2 658 | 154,84 | 54 | 152,38 | ||||
| 2025-05-05 | 13F | IFP Advisors, Inc | 0 | −100,00 | 0 | |||||
| 2025-08-14 | 13F | Group One Trading, L.p. | Call | 1 800 | 36 | |||||
| 2025-08-01 | 13F | Envestnet Asset Management Inc | 359 415 | 10,84 | 7 260 | 9,80 | ||||
| 2025-08-13 | 13F | Plan Group Financial, LLC | 49 763 | 38,85 | 1 005 | 37,67 | ||||
| 2025-07-22 | 13F | DAVENPORT & Co LLC | 36 237 | 0,00 | 732 | −0,95 | ||||
| 2025-08-08 | 13F | Capital Investment Advisory Services, LLC | 84 524 | 13,97 | 1 707 | 12,90 | ||||
| 2025-07-10 | 13F | Atticus Wealth Management, Llc | 3 816 | 77 | ||||||
| 2025-08-14 | 13F | Group One Trading, L.p. | Put | 100 | 2 | |||||
| 2025-08-14 | 13F | Quarry LP | 2 366 | 71,45 | 48 | 67,86 | ||||
| 2025-08-04 | 13F | Muzinich & Co., Inc. | 190 228 | 106,50 | 3 843 | 104,58 | ||||
| 2025-07-31 | 13F | Caitong International Asset Management Co., Ltd | 4 | 100,00 | 0 | |||||
| 2025-08-11 | 13F | Hexagon Capital Partners LLC | 0 | −100,00 | 0 | |||||
| 2025-08-14 | 13F | GWM Advisors LLC | 91 113 | −10,24 | 1 840 | −11,07 | ||||
| 2025-08-07 | 13F | Campbell & CO Investment Adviser LLC | 23 049 | −34,36 | 466 | −35,06 | ||||
| 2025-07-28 | NP | KBWD - Invesco KBW High Dividend Yield Financial ETF This fund is a listed as child fund of Invesco Ltd. and if that institution has disclosed ownership in this security, then these positions will not be double counted when calculating total shares and total value | 430 044 | −21,66 | 8 812 | −31,08 | ||||
| 2025-08-14 | 13F | Verition Fund Management LLC | 14 100 | 285 | ||||||
| 2025-08-12 | 13F | Legal & General Group Plc | 228 512 | 0,94 | 4 616 | −0,02 | ||||
| 2025-07-21 | 13F | Ameritas Advisory Services, LLC | 200 | 4 | ||||||
| 2025-08-12 | 13F | Cornerstone Wealth Management, LLC | 27 173 | 7,80 | 549 | 6,82 | ||||
| 2025-08-13 | 13F | Level Four Advisory Services, Llc | 30 487 | −13,98 | 616 | −14,82 | ||||
| 2025-08-04 | 13F | MeadowBrook Investment Advisors LLC | 2 850 | 90,00 | 58 | 90,00 | ||||
| 2025-08-29 | NP | JAFEX - Total Stock Market Index Trust NAV | 641 | 19,37 | 13 | 9,09 | ||||
| 2025-05-14 | 13F | Virtus ETF Advisers LLC | 0 | −100,00 | 0 | |||||
| 2025-07-10 | 13F | Capital Advisory Group Advisory Services, LLC | 77 618 | 1,98 | 1 568 | 1,03 | ||||
| 2025-08-08 | 13F | Hartland & Co., LLC | 20 661 | 0,44 | 417 | −0,48 | ||||
| 2025-05-16 | 13F | McIlrath & Eck, LLC | 0 | −100,00 | 0 | |||||
| 2025-07-18 | 13F | Truist Financial Corp | 45 703 | −2,67 | 909 | −5,12 | ||||
| 2025-07-29 | 13F | TrueMark Investments, LLC | 0 | −100,00 | 0 | |||||
| 2025-08-11 | 13F | Brown Brothers Harriman & Co | 5 337 | 0,00 | 108 | −0,93 | ||||
| 2025-07-17 | 13F | Janney Montgomery Scott LLC | 10 463 | 0,00 | 0 | |||||
| 2025-08-14 | 13F | Stifel Financial Corp | 13 995 | −21,95 | 283 | −22,74 | ||||
| 2025-08-13 | 13F | Virtus Investment Advisers, Inc. | 41 255 | −2,66 | 833 | −3,59 | ||||
| 2025-08-14 | 13F | Quantinno Capital Management LP | 27 165 | 549 | ||||||
| 2025-08-14 | 13F | Bnp Paribas Arbitrage, Sa | 38 | 1 | ||||||
| 2025-06-18 | NP | Putnam ETF Trust - Putnam BDC ETF - | 166 576 | 17,21 | 3 148 | −2,02 | ||||
| 2025-05-02 | 13F | Hager Investment Management Services, Llc | 0 | −100,00 | 0 | |||||
| 2025-07-23 | 13F | Morey & Quinn Wealth Partners, LLC | 14 778 | 0,00 | 299 | −1,00 | ||||
| 2025-08-14 | 13F | Smartleaf Asset Management LLC | 7 | 0,00 | 0 | |||||
| 2025-07-23 | 13F | 1 North Wealth Services Llc | 600 | 0,00 | 12 | 0,00 | ||||
| 2025-08-13 | 13F | Advisory Research Inc | 10 574 | 6,14 | 214 | 4,93 | ||||
| 2025-08-14 | 13F | Summit Trail Advisors, Llc | 22 502 | 455 | ||||||
| 2025-08-14 | 13F | Mercer Global Advisors Inc /adv | 29 783 | 602 | ||||||
| 2025-07-07 | 13F | Enterprise Bank & Trust Co | 55 912 | 0,00 | 1 129 | −0,96 | ||||
| 2025-07-24 | 13F | Capital Advisors, Ltd. LLC | 2 250 | 0,00 | 0 | |||||
| 2025-08-01 | 13F | Y-Intercept (Hong Kong) Ltd | 62 361 | 472,96 | 1 260 | 469,68 | ||||
| 2025-07-08 | 13F | Davis Investment Partners, LLC | 77 104 | −5,57 | 1 570 | 5,73 | ||||
| 2025-07-16 | 13F | Eagle Global Advisors Llc | 22 325 | 56,01 | 451 | 54,64 | ||||
| 2025-05-30 | NP | ERNZ - TrueShares Active Yield ETF | 11 462 | −85,27 | 234 | −85,75 | ||||
| 2025-08-05 | 13F | Palogic Value Management, L.P. | 69 101 | 2,65 | 1 396 | 1,68 | ||||
| 2025-08-13 | 13F | Mackenzie Financial Corp | 0 | −100,00 | 0 | |||||
| 2025-08-11 | 13F | Private Advisor Group, LLC | 14 734 | 29,12 | 298 | 28,02 | ||||
| 2025-08-21 | NP | BIZD - VanEck Vectors BDC Income ETF | 793 209 | 6,18 | 16 023 | 5,19 | ||||
| 2025-08-01 | 13F | Koss-Olinger Consulting, LLC | 16 153 | 326 | ||||||
| 2025-05-14 | 13F | Credit Agricole S A | 47 649 | 0,00 | 972 | −3,00 | ||||
| 2025-07-16 | 13F | ORG Partners LLC | 1 416 | 0,00 | 29 | −3,45 | ||||
| 2025-08-25 | 13F/A | Promus Capital, LLC | 2 023 | 0,00 | 41 | −2,44 | ||||
| 2025-07-31 | 13F | MQS Management LLC | 36 583 | −20,28 | 739 | −21,07 | ||||
| 2025-07-11 | 13F | Farther Finance Advisors, LLC | 7 346 | −2,92 | 148 | −5,13 | ||||
| 2025-08-12 | 13F | Jpmorgan Chase & Co | 4 398 | −66,67 | 89 | −67,29 | ||||
| 2025-08-08 | 13F | Pnc Financial Services Group, Inc. | 750 | 0,00 | 15 | 0,00 | ||||
| 2025-08-13 | 13F | Natixis | 26 751 | 0,00 | 539 | −1,47 | ||||
| 2025-07-24 | 13F | Blair William & Co/il | 0 | −100,00 | 0 | |||||
| 2025-05-05 | 13F | Transce3nd, LLC | 0 | −100,00 | 0 | |||||
| 2025-07-11 | 13F | Kingstone Capital Partners Texas, LLC | 27 409 759 | 549 | ||||||
| 2025-07-31 | 13F | Oak Harbor Wealth Partners, Llc | 17 981 | 0,00 | 363 | −0,82 | ||||
| 2025-07-25 | 13F | Atria Wealth Solutions, Inc. | 10 089 | 204 | ||||||
| 2025-06-27 | NP | LBO - WHITEWOLF Publicly Listed Private Equity ETF | 676 | 14,19 | 13 | −7,69 | ||||
| 2025-08-12 | 13F | Steward Partners Investment Advisory, Llc | 25 284 | 7,89 | 511 | 6,92 | ||||
| 2025-08-13 | 13F | Quantbot Technologies LP | 9 047 | −7,65 | 183 | −8,54 | ||||
| 2025-08-14 | 13F | Bank Of America Corp /de/ | 17 673 | −2,65 | 357 | −3,78 | ||||
| 2025-07-31 | 13F | Sumitomo Mitsui Trust Holdings, Inc. | 152 463 | 68,49 | 3 080 | 66,88 | ||||
| 2025-08-14 | 13F | Royal Bank Of Canada | 12 088 | 5,72 | 244 | 4,72 | ||||
| 2025-08-07 | 13F | Hennion & Walsh Asset Management, Inc. | 44 016 | 0,05 | 889 | −0,89 | ||||
| 2025-08-12 | 13F | BlackRock, Inc. | 193 153 | 30,75 | 3 902 | 29,52 | ||||
| 2025-08-13 | 13F | Millstone Evans Group, LLC | 3 686 | 0,00 | 74 | −1,33 | ||||
| 2025-08-14 | 13F | Jane Street Group, Llc | 0 | −100,00 | 0 | |||||
| 2025-08-15 | 13F | Morgan Stanley | 267 445 | −12,38 | 5 402 | −13,19 | ||||
| 2025-08-15 | 13F | Great West Life Assurance Co /can/ | 33 094 | 4,65 | 1 | |||||
| 2025-08-18 | 13F | N.E.W. Advisory Services LLC | 62 | 0,00 | 1 | 0,00 | ||||
| 2025-08-14 | 13F | Millennium Management Llc | 0 | −100,00 | 0 | |||||
| 2025-08-06 | 13F | Prospera Financial Services Inc | 20 171 | 0,02 | 407 | −0,97 | ||||
| 2025-08-13 | 13F | Beacon Pointe Advisors, LLC | 22 628 | 457 | ||||||
| 2025-08-18 | 13F | Geneos Wealth Management Inc. | 51 | 0,00 | 1 | 0,00 | ||||
| 2025-08-14 | 13F | Van Eck Associates Corp | 846 994 | 10,94 | 17 | 13,33 | ||||
| 2025-07-14 | 13F | Golden State Equity Partners | 15 740 | 318 | ||||||
| 2025-07-10 | 13F | Wealth Enhancement Advisory Services, Llc | 20 462 | 13,39 | 425 | 15,80 | ||||
| 2025-08-13 | 13F | Baird Financial Group, Inc. | 313 002 | 10,57 | 6 323 | 9,53 | ||||
| 2025-08-08 | 13F | Cetera Investment Advisers | 370 335 | 10,38 | 7 481 | 9,36 | ||||
| 2025-07-14 | 13F | AdvisorNet Financial, Inc | 1 728 | 137,36 | 35 | 142,86 | ||||
| 2025-08-12 | 13F | Virtu Financial LLC | 0 | −100,00 | 0 | |||||
| 2025-08-08 | 13F | Accredited Investors Inc. | 20 000 | 404 | ||||||
| 2025-08-14 | 13F | Wells Fargo & Company/mn | 23 887 | −14,58 | 483 | −15,44 | ||||
| 2025-07-31 | 13F | Optimum Investment Advisors | 20 393 | 9,32 | 412 | 8,16 | ||||
| 2025-07-31 | 13F | Cambridge Investment Research Advisors, Inc. | 26 905 | 10,85 | 1 | |||||
| 2025-08-08 | 13F | Cedar Wealth Management, LLC | 992 | 0,00 | 20 | 0,00 | ||||
| 2025-08-05 | 13F | GPS Wealth Strategies Group, LLC | 2 739 | −36,96 | 55 | −37,50 | ||||
| 2025-06-25 | NP | VPC - Virtus Private Credit Strategy ETF | 38 715 | −12,90 | 732 | −27,19 | ||||
| 2025-05-14 | 13F | Comerica Bank | 0 | −100,00 | 0 | |||||
| 2025-07-31 | 13F | Peterson Wealth Services | 122 | 0,83 | 2 | 0,00 | ||||
| 2025-05-13 | 13F | Neuberger Berman Group LLC | 0 | −100,00 | 0 | |||||
| 2025-07-29 | 13F | Stratos Wealth Partners, LTD. | 26 200 | 61,73 | 529 | 60,30 | ||||
| 2025-08-04 | 13F | Spire Wealth Management | 0 | −100,00 | 0 | |||||
| 2025-08-14 | 13F | Bragg Financial Advisors, Inc | 13 011 | 0,00 | 263 | −1,13 | ||||
| 2025-08-14 | 13F | Aquatic Capital Management LLC | 0 | −100,00 | 0 | |||||
| 2025-08-14 | 13F | Raymond James Financial Inc | 813 702 | −13,26 | 16 437 | −14,07 | ||||
| 2025-07-09 | 13F | Fiduciary Alliance LLC | 13 025 | 0,00 | 263 | −0,75 | ||||
| 2025-07-17 | 13F | GraniteShares Advisors LLC | 132 532 | 6,67 | 2 677 | 5,68 | ||||
| 2025-08-14 | 13F | Citadel Advisors Llc | Call | 24 800 | 10,22 | 501 | 9,17 | |||
| 2025-08-13 | 13F | Northwestern Mutual Wealth Management Co | 150 | 3 | ||||||
| 2025-08-25 | NP | TMVAX - RBC Microcap Value Fund A Shares | 4 400 | 0,00 | 89 | −1,12 | ||||
| 2025-04-21 | 13F | Nelson, Van Denburg & Campbell Wealth Management Group, LLC | 0 | −100,00 | 0 | |||||
| 2025-08-12 | 13F | Advisors Asset Management, Inc. | 154 610 | −27,54 | 3 123 | −28,21 | ||||
| 2025-07-23 | 13F | Columbus Macro, LLC | 322 543 | 12,14 | 6 515 | 11,10 | ||||
| 2025-07-31 | 13F | Oppenheimer & Co Inc | 20 323 | 6,82 | 411 | 5,94 | ||||
| 2025-08-06 | 13F | Ethos Financial Group, LLC | 137 365 | 2,22 | 2 775 | 1,24 | ||||
| 2025-08-12 | 13F | Dynamic Technology Lab Private Ltd | 0 | −100,00 | 0 | |||||
| 2025-08-12 | 13F | MAI Capital Management | 3 132 | 0,00 | 63 | 0,00 | ||||
| 2025-08-15 | 13F | Tower Research Capital LLC (TRC) | 699 | 2 812,50 | 14 | |||||
| 2025-08-12 | 13F | Franklin Resources Inc | 167 016 | −0,42 | 3 374 | −1,35 | ||||
| 2025-07-25 | 13F | Cwm, Llc | 749 | 1 602,27 | 0 | |||||
| 2025-08-14 | 13F | Mariner, LLC | 11 515 | 13,68 | 233 | 12,62 | ||||
| 2025-08-11 | 13F | HighTower Advisors, LLC | 90 865 | 0,22 | 1 835 | −0,70 | ||||
| 2025-08-12 | 13F | Laurel Wealth Advisors LLC | 31 755 | 7 588,86 | 2 | −87,50 | ||||
| 2025-07-17 | 13F | HB Wealth Management, LLC | 13 599 | 0,00 | 275 | −1,08 | ||||
| 2025-08-11 | 13F | Citigroup Inc | 0 | −100,00 | 0 | |||||
| 2025-08-12 | 13F | Trexquant Investment LP | 76 533 | 56,54 | 1 546 | 55,12 | ||||
| 2025-08-13 | 13F | Legacy Capital Wealth Partners, LLC | 66 037 | −2,68 | 1 334 | −3,62 | ||||
| 2025-08-12 | 13F | Global Retirement Partners, LLC | 788 | 16 | ||||||
| 2025-08-14 | 13F | Two Sigma Investments, Lp | 287 879 | −27,85 | 5 815 | −28,52 | ||||
| 2025-07-29 | 13F | Novare Capital Management Llc | 190 275 | 0,60 | 3 844 | −0,34 | ||||
| 2025-08-14 | 13F | Qube Research & Technologies Ltd | 64 929 | 39,81 | 1 312 | 38,58 | ||||
| 2025-09-04 | 13F/A | Advisor Group Holdings, Inc. | 13 092 | 7,56 | 264 | 6,45 | ||||
| 2025-08-29 | NP | GraniteShares ETF Trust - GraniteShares HIPS US High Income ETF | 132 532 | 6,67 | 2 677 | 5,68 | ||||
| 2025-08-06 | 13F | Commonwealth Equity Services, Llc | 35 124 | 20,65 | 1 | |||||
| 2025-07-08 | 13F | Nbc Securities, Inc. | 0 | −100,00 | 0 | |||||
| 2025-08-12 | 13F | LPL Financial LLC | 82 993 | −3,48 | 1 676 | −4,39 | ||||
| 2025-07-22 | 13F | Sage Investment Counsel LLC | 12 070 | 0,00 | 244 | −1,22 | ||||
| 2025-07-15 | 13F | Riverbridge Partners Llc | 38 975 | 3,92 | 787 | 3,01 | ||||
| 2025-08-07 | 13F | PFG Advisors | 188 495 | 3,76 | 3 808 | 2,81 | ||||
| 2025-08-12 | 13F | Proequities, Inc. | Put | 0 | 0 | |||||
| 2025-08-12 | 13F | Proequities, Inc. | Call | 0 | 0 | |||||
| 2025-08-12 | 13F | Proequities, Inc. | 0 | 0 | ||||||
| 2025-08-14 | 13F | Citadel Advisors Llc | Put | 0 | −100,00 | 0 | ||||
| 2025-08-13 | 13F | Russell Investments Group, Ltd. | 72 | 0,00 | 1 | 0,00 | ||||
| 2025-08-14 | 13F | UBS Group AG | 298 390 | 50,83 | 6 027 | 49,44 | ||||
| 2025-08-14 | 13F | Susquehanna International Group, Llp | 0 | −100,00 | 0 | |||||
| 2025-08-14 | 13F | Hrt Financial Lp | 54 066 | 26,75 | 1 | |||||
| 2025-08-14 | 13F | Susquehanna International Group, Llp | Call | 24 000 | 485 | |||||
| 2025-08-14 | 13F | IHT Wealth Management, LLC | 69 581 | 10,12 | 1 406 | 9,08 | ||||
| 2025-08-14 | 13F | Susquehanna International Group, Llp | Put | 12 000 | −7,69 | 242 | −8,68 | |||
| 2025-08-13 | 13F | Invesco Ltd. | 446 703 | 2,20 | 9 023 | 1,26 | ||||
| 2025-05-13 | 13F | EverSource Wealth Advisors, LLC | 0 | −100,00 | 0 | |||||
| 2025-08-14 | 13F | Ameriprise Financial Inc | 92 080 | −13,40 | 1 858 | −13,14 | ||||
| 2025-08-14 | 13F | MGB Wealth Management, LLC | 89 775 | 2,07 | 1 807 | 0,61 | ||||
| 2025-08-11 | 13F | Greenland Capital Management LP | 53 190 | −9,39 | 1 074 | −10,20 | ||||
| 2025-07-17 | 13F | Sound Income Strategies, LLC | 1 898 | −63,27 | 38 | −63,81 | ||||
| 2025-07-30 | 13F | D.a. Davidson & Co. | 115 872 | 159,06 | 2 341 | 156,86 | ||||
| 2025-08-05 | 13F | Simplex Trading, Llc | Put | 200 | 100,00 | 0 | ||||
| 2025-08-05 | 13F | Simplex Trading, Llc | 16 458 | 0 | ||||||
| 2025-08-05 | 13F | Simplex Trading, Llc | Call | 100 | −95,65 | 0 | ||||
| 2025-08-14 | 13F | Two Sigma Advisers, Lp | 380 613 | −8,49 | 7 688 | −9,34 | ||||
| 2025-08-13 | 13F | Northern Trust Corp | 20 202 | 408 | ||||||
| 2025-08-14 | 13F | Citadel Advisors Llc | 0 | −100,00 | 0 | |||||
| 2025-05-06 | 13F | WT Wealth Management | 53 376 | −3,72 | 1 088 | −6,61 |