Grundläggande statistik
| Institutionella ägare | 115 total, 115 long only, 0 short only, 0 long/short - change of 43,75% MRQ |
| Genomsnittlig portföljallokering | 0.3221 % - change of 178,85% MRQ |
| Institutionella aktier (lång) | 20 784 662 (ex 13D/G) - change of 12,51MM shares 151,13% MRQ |
| Institutionellt värde (lång) | $ 310 781 USD ($1000) |
Institutionellt ägande och aktieägare
First Trust Exchange-Traded Fund II - First Trust STOXX European Select Dividend Index Fund (US:FDD) har 115 Institutionella ägare och aktieägare som har lämnat in 13D/G- eller 13F-formulär till Securities Exchange Commission (SEC). Dessa institut innehar totalt 20,784,662 aktier. Största aktieägare inkluderar Morgan Stanley, Wells Fargo & Company/mn, Raymond James Financial Inc, Manchester Financial Inc, SMI Advisory Services, LLC, UBS Group AG, LPL Financial LLC, ODonnell Financial Services, LLC, Ameriprise Financial Inc, and Intellectus Partners, LLC .
First Trust Exchange-Traded Fund II - First Trust STOXX European Select Dividend Index Fund (ARCA:FDD) Institutionell ägarstruktur visar institutioners och fonders nuvarande positioner i företaget, samt de senaste förändringarna i positionernas storlek. Större aktieägare kan vara enskilda investerare, fonder, hedgefonder eller institutioner. Bilaga 13D visar att investeraren äger (eller ägde) mer än 5% av företaget och avser (eller avsåg) att aktivt eftersträva en förändring av affärsstrategin. Schedule 13G indikerar en passiv investering på över 5%.
The share price as of September 8, 2025 is 16,10 / share. Previously, on September 9, 2024, the share price was 12,22 / share. This represents an increase of 31,79% over that period.

Fondsentimentets poäng
Fondsentimentet poängen(fka Ägarackumulation-poäng) visar vilka aktier som är mest köpta av fonder. Det är resultatet av en sofistikerad kvantitativ flerfaktormodell som identifierar företag med de högsta nivåerna av institutionell ackumulering. Poängsättningsmodellen använder en kombination av den totala ökningen av redovisade ägare, förändringarna i portföljallokeringarna för dessa ägare och andra mått. Siffran sträcker sig från 0 till 100, där högre siffror indikerar en högre nivå av ackumulering i förhållande till sina konkurrenter, och 50 är genomsnittet.
Uppdateringsfrekvens: Dagligen
Se Ownership Explorer, som innehåller en lista över de högst rankade företagen.
Institutionell sälj/köp-kvot
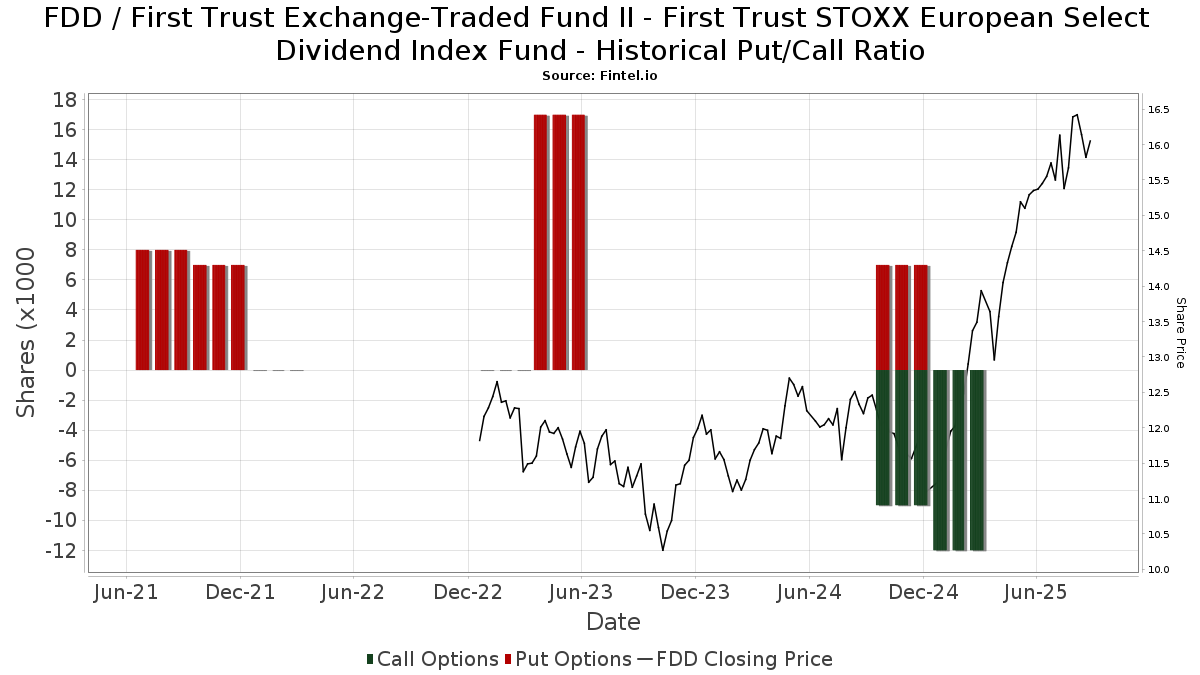
Förutom att rapportera vanliga eget kapital- och skuldemissioner måste institutioner med mer än 100MM tillgångar under förvaltning också avslöja sina innehav av sälj- och köpoptioner. Eftersom säljoptioner i allmänhet indikerar ett negativt sentiment och köpoptioner indikerar ett positivt sentiment, kan vi få en uppfattning om det övergripande institutionella sentimentet genom att plotta förhållandet mellan säljoptioner och köpoptioner. Diagrammet till höger visar det historiska förhållandet mellan sälj- och köpoptioner för detta instrument.
Genom att använda sälj/köp-kvoten som en indikator på aktieägarnas sentiment undviker man en av de största bristerna med att använda det totala institutionella ägandet, nämligen att en betydande del av de förvaltade tillgångarna investeras passivt för att följa index. Passivt förvaltade fonder köper vanligtvis inte optioner, så indikatorn för sälj/köp-kvoten ger en bättre bild av stämningen i aktivt förvaltade fonder.
13F- och NPORT-arkiveringar
Detaljer om 13F-arkiveringar är gratis. Detaljer om NP-arkiveringar kräver ett premiummedlemskap. Gröna rader indikerar nya positioner. Röda rader indikerar stängda positioner. Klicka på länk symbolen för att se hela transaktionshistoriken.
Uppgradera
för att låsa upp premiumdata och exportera till Excel ![]() .
.
| Fil Datum | Källa | Investerare | Typ | Genomsnittligt pris (beräknat) |
Aktier | Δ Aktier (%) |
Rapporterat värde (1000 USD) |
Δ Värde (%) |
Portföljallokering (%) |
|
|---|---|---|---|---|---|---|---|---|---|---|
| 2025-08-06 | 13F | Wedbush Securities Inc | 25 055 | 0,00 | 0 | |||||
| 2025-08-14 | 13F | Raymond James Financial Inc | 1 491 557 | 609,22 | 23 179 | 712,41 | ||||
| 2025-08-14 | 13F | Susquehanna International Group, Llp | 29 323 | 456 | ||||||
| 2025-07-08 | 13F | Nbc Securities, Inc. | 2 192 | 0,00 | 0 | |||||
| 2025-08-06 | 13F | Commonwealth Equity Services, Llc | 100 802 | −29,70 | 2 | 0,00 | ||||
| 2025-07-17 | 13F | Forefront Wealth Management Inc. | 157 967 | 2 455 | ||||||
| 2025-08-14 | 13F | Treasure Coast Financial Planning | 13 493 | 7,75 | 210 | 23,67 | ||||
| 2025-06-30 | NP | SMIFX - Sound Mind Investing Fund | 427 620 | 6 128 | ||||||
| 2025-08-05 | 13F | Ciovacco Capital Management LLC | 34 994 | 544 | ||||||
| 2025-08-27 | 13F/A | Brinker Capital Investments, LLC | 32 600 | −30,87 | 507 | −20,81 | ||||
| 2025-07-31 | 13F | Topsail Wealth Management, LLC | 14 060 | 218 | ||||||
| 2025-08-14 | 13F | Wells Fargo & Company/mn | 2 494 548 | 474,53 | 38 765 | 558,04 | ||||
| 2025-07-17 | 13F | Sound Income Strategies, LLC | 87 | 1 | ||||||
| 2025-08-04 | 13F | Spire Wealth Management | 0 | −100,00 | 0 | |||||
| 2025-08-12 | 13F | Proequities, Inc. | 0 | 0 | ||||||
| 2025-08-08 | 13F | Cetera Investment Advisers | 57 259 | 178,40 | 890 | 218,64 | ||||
| 2025-08-13 | 13F | Flow Traders U.s. Llc | 32 694 | 1 | ||||||
| 2025-08-14 | 13F | Goldman Sachs Group Inc | 16 304 | 253 | ||||||
| 2025-07-25 | 13F | Envestnet Portfolio Solutions, Inc. | 47 936 | −7,26 | 745 | 6,13 | ||||
| 2025-08-04 | 13F | Integrity Alliance, Llc. | 29 086 | 452 | ||||||
| 2025-08-06 | 13F | Strategic Financial Partners, Ltd. | 14 910 | 0,17 | 232 | 14,93 | ||||
| 2025-08-11 | 13F | Principal Securities, Inc. | 14 086 | −25,14 | 219 | 3,32 | ||||
| 2025-08-18 | 13F | Geneos Wealth Management Inc. | 750 | −48,28 | 12 | −42,11 | ||||
| 2025-05-15 | 13F/A | Orion Portfolio Solutions, LLC | 47 160 | −3,89 | 640 | 15,76 | ||||
| 2025-05-12 | 13F | Virtu Financial LLC | 0 | −100,00 | 0 | |||||
| 2025-07-24 | 13F | Blair William & Co/il | 3 000 | 47 | ||||||
| 2025-07-29 | 13F | International Assets Investment Management, Llc | 44 010 | 684 | ||||||
| 2025-08-14 | 13F/A | Rockefeller Capital Management L.P. | 114 170 | 26,49 | 1 774 | 44,93 | ||||
| 2025-08-06 | 13F | Prospera Financial Services Inc | 156 115 | 2 426 | ||||||
| 2025-07-18 | 13F | SMI Advisory Services, LLC | 1 247 631 | 19 338 | ||||||
| 2025-07-18 | 13F | Truist Financial Corp | 120 316 | 620,15 | 1 870 | 726,99 | ||||
| 2025-07-17 | 13F | Janney Montgomery Scott LLC | 380 881 | 93,91 | 6 | 150,00 | ||||
| 2025-08-06 | 13F | Moors & Cabot, Inc. | 22 366 | 348 | ||||||
| 2025-08-14 | 13F | Susquehanna International Group, Llp | Call | 0 | −100,00 | 0 | ||||
| 2025-08-14 | 13F | Benjamin Edwards Inc | 20 521 | −11,76 | 319 | 0,95 | ||||
| 2025-08-08 | 13F | SBI Securities Co., Ltd. | 6 438 | 137,04 | 100 | 177,78 | ||||
| 2025-08-01 | 13F | Rossby Financial, LCC | 401 | 0,00 | 6 | 20,00 | ||||
| 2025-07-29 | 13F | Balboa Wealth Partners | 32 459 | 171,35 | 504 | 211,11 | ||||
| 2025-08-12 | 13F | Change Path, LLC | 20 361 | −23,72 | 316 | −12,71 | ||||
| 2025-08-13 | 13F | Continuum Advisory, LLC | 0 | −100,00 | 0 | |||||
| 2025-08-13 | 13F | BlackDiamond Wealth Management Inc. | 10 952 | −1,32 | 170 | 4,94 | ||||
| 2025-07-24 | 13F | IFP Advisors, Inc | 342 112 | 14 748,61 | 5 316 | 17 048,39 | ||||
| 2025-09-04 | 13F/A | Advisor Group Holdings, Inc. | 569 857 | 6 008,45 | 8 855 | 6 927,78 | ||||
| 2025-07-11 | 13F | Pinnacle Bancorp, Inc. | 104 | 0,00 | 2 | 0,00 | ||||
| 2025-07-16 | 13F | Owen LaRue, LLC | 151 421 | −61,65 | 2 353 | −56,08 | ||||
| 2025-08-04 | 13F | Atria Investments Llc | 414 962 | 3 906,97 | 6 449 | 4 505,71 | ||||
| 2025-07-31 | 13F | Hobart Private Capital, LLC | 154 669 | 11,65 | 2 404 | 27,89 | ||||
| 2025-08-13 | 13F | Jones Financial Companies Lllp | 71 719 | 940,46 | 1 110 | 1 080,85 | ||||
| 2025-07-21 | 13F | J2 Capital Management Inc | 41 716 | 648 | ||||||
| 2025-07-14 | 13F | GAMMA Investing LLC | 2 775 | 0,00 | 43 | 16,22 | ||||
| 2025-08-14 | 13F | UBS Group AG | 1 154 637 | 81,04 | 17 943 | 107,34 | ||||
| 2025-08-12 | 13F | LPL Financial LLC | 749 713 | 58,93 | 11 651 | 82,00 | ||||
| 2025-07-28 | 13F | BRYN MAWR TRUST Co | 4 300 | 67 | ||||||
| 2025-07-30 | 13F | BlueChip Wealth Advisors LLC | 63 436 | −5,08 | 986 | 8,72 | ||||
| 2025-08-18 | 13F/A | National Bank Of Canada /fi/ | 1 200 | 71,43 | 19 | 100,00 | ||||
| 2025-07-28 | 13F | Harbour Investments, Inc. | 155 443 | −4,72 | 2 416 | 9,13 | ||||
| 2025-07-08 | 13F | Next Level Private LLC | 163 272 | 0,71 | 2 537 | 15,32 | ||||
| 2025-08-07 | 13F | Kestra Private Wealth Services, Llc | 75 227 | −2,28 | 1 169 | 11,97 | ||||
| 2025-08-14 | 13F | Comerica Bank | 46 757 | −6,70 | 727 | 6,76 | ||||
| 2025-07-29 | 13F | Stephens Inc /ar/ | 35 758 | −0,56 | 556 | 13,96 | ||||
| 2025-08-13 | 13F | Twin Peaks Wealth Advisors, LLC | 4 216 | 68 | ||||||
| 2025-08-14 | 13F | Integrated Wealth Concepts LLC | 94 796 | 4,38 | 1 473 | 19,56 | ||||
| 2025-05-15 | 13F | Hrt Financial Lp | 0 | −100,00 | 0 | |||||
| 2025-08-14 | 13F | Mml Investors Services, Llc | 109 515 | 886,62 | 2 | |||||
| 2025-08-05 | 13F | Intellectus Partners, LLC | 632 650 | 2,76 | 9 831 | 17,68 | ||||
| 2025-08-15 | 13F | Fsb Premier Wealth Management, Inc. | 11 116 | 0,22 | 173 | 14,67 | ||||
| 2025-08-13 | 13F | Gateway Wealth Partners, LLC | 28 588 | 29,94 | 444 | 48,99 | ||||
| 2025-07-31 | 13F | Oppenheimer & Co Inc | 10 000 | 155 | ||||||
| 2025-08-15 | 13F | Kestra Advisory Services, LLC | 57 099 | 167,89 | 887 | 206,92 | ||||
| 2025-07-23 | 13F | Tcfg Wealth Management, Llc | 103 350 | −0,42 | 1 606 | 14,06 | ||||
| 2025-08-01 | 13F | Envestnet Asset Management Inc | 255 278 | 57,84 | 3 967 | 80,81 | ||||
| 2025-07-16 | 13F | ORG Partners LLC | 28 500 | 466 | ||||||
| 2025-08-08 | 13F | Pnc Financial Services Group, Inc. | 3 793 | −15,20 | 59 | −3,33 | ||||
| 2025-07-22 | 13F | Belpointe Asset Management LLC | 22 905 | 356 | ||||||
| 2025-08-14 | 13F | Colony Group, LLC | 39 343 | −12,56 | 611 | 0,16 | ||||
| 2025-08-14 | 13F | Ameriprise Financial Inc | 650 174 | 53,73 | 10 081 | 75,66 | ||||
| 2025-08-14 | 13F | Harwood Advisory Group, LLC | 2 157 | −5,48 | 34 | 32,00 | ||||
| 2025-08-19 | 13F | Advisory Services Network, LLC | 15 493 | 237 | ||||||
| 2025-07-09 | 13F | Murphy, Middleton, Hinkle & Parker, Inc. | 107 446 | 0,00 | 1 458 | 0,00 | ||||
| 2025-08-15 | 13F | Tower Research Capital LLC (TRC) | 0 | −100,00 | 0 | |||||
| 2025-07-11 | 13F | Farther Finance Advisors, LLC | 1 792 | 3,76 | 28 | 17,39 | ||||
| 2025-08-13 | 13F | Baird Financial Group, Inc. | 20 153 | 56,80 | 313 | 79,89 | ||||
| 2025-08-05 | 13F | Prosperity Wealth Management, Inc. | 14 600 | 227 | ||||||
| 2025-08-12 | 13F | Steward Partners Investment Advisory, Llc | 164 659 | 3 531,65 | 2 559 | 4 093,44 | ||||
| 2025-08-14 | 13F | GWM Advisors LLC | 14 105 | 219 | ||||||
| 2025-08-19 | 13F | Newbridge Financial Services Group, Inc. | 13 879 | 216 | ||||||
| 2025-07-16 | 13F | Register Financial Advisors LLC | 12 719 | 198 | ||||||
| 2025-08-08 | 13F | MTM Investment Management, LLC | 1 500 | 23 | ||||||
| 2025-08-14 | 13F | Fmr Llc | 5 716 | 89 | ||||||
| 2025-07-29 | 13F | ODonnell Financial Services, LLC | 747 517 | 11 616 | ||||||
| 2025-08-14 | 13F | Royal Bank Of Canada | 110 349 | 333,95 | 1 715 | 395,66 | ||||
| 2025-05-15 | 13F | Citadel Advisors Llc | Put | 0 | −100,00 | 0 | −100,00 | |||
| 2025-08-14 | 13F | Atomi Financial Group, Inc. | 13 879 | 216 | ||||||
| 2025-05-08 | 13F | Armis Advisers, LLC | 0 | −100,00 | 0 | |||||
| 2025-07-11 | 13F | SILVER OAK SECURITIES, Inc | 20 056 | 25,37 | 312 | 42,66 | ||||
| 2025-08-07 | 13F | Private Advisory Group LLC | 92 110 | 1 431 | ||||||
| 2025-07-21 | 13F | Ameritas Advisory Services, LLC | 209 | 3 | ||||||
| 2025-07-17 | 13F | Raleigh Capital Management Inc. | 783 | 1,42 | 12 | 20,00 | ||||
| 2025-08-14 | 13F | Jane Street Group, Llc | 400 000 | 161,23 | 6 216 | 199,28 | ||||
| 2025-08-14 | 13F | Bank Of America Corp /de/ | 273 362 | −16,36 | 4 248 | −4,22 | ||||
| 2025-08-12 | 13F | Global Retirement Partners, LLC | 5 843 | 1 603,50 | 91 | 2 900,00 | ||||
| 2025-07-23 | 13F | Foresight Capital Management Advisors, Inc. | 195 185 | 3 033 | ||||||
| 2025-07-31 | 13F | Cambridge Investment Research Advisors, Inc. | 60 260 | 10,88 | 1 | |||||
| 2025-07-10 | 13F | Wealth Enhancement Advisory Services, Llc | 24 946 | 389 | ||||||
| 2025-07-29 | 13F | Manchester Financial Inc | 1 382 182 | 21 479 | ||||||
| 2025-07-29 | 13F | Cottonwood Capital Advisors, Llc | 33 170 | −0,18 | 515 | 14,44 | ||||
| 2025-08-14 | 13F | Citadel Advisors Llc | Call | 0 | −100,00 | 0 | ||||
| 2025-04-30 | 13F | Allworth Financial LP | 0 | −100,00 | 0 | |||||
| 2025-08-01 | 13F | Liberty Wealth Management Llc | 14 770 | 1,29 | 230 | 16,24 | ||||
| 2025-08-12 | 13F | Jaffetilchin Investment Partners, LLC | 0 | −100,00 | 0 | |||||
| 2025-07-22 | 13F | Berger Financial Group, Inc | 16 543 | 4,21 | 257 | 19,53 | ||||
| 2025-08-12 | 13F | Wisconsin Wealth Advisors, LLC | 52 722 | 819 | ||||||
| 2025-08-12 | 13F | Jpmorgan Chase & Co | 1 772 | 28 | ||||||
| 2025-08-14 | 13F | Snowden Capital Advisors LLC | 30 012 | 52,64 | 466 | 75,19 | ||||
| 2025-08-14 | 13F | Citadel Advisors Llc | 50 089 | 109,35 | 778 | 140,12 | ||||
| 2025-08-15 | 13F | Morgan Stanley | 2 689 945 | 28,45 | 41 802 | 47,10 | ||||
| 2025-08-04 | 13F | Flagship Harbor Advisors, Llc | 198 437 | 3 084 | ||||||
| 2025-06-30 | NP | SMILX - SMI 50/40/10 Fund | 114 510 | 1 641 | ||||||
| 2025-07-17 | 13F | Lee Johnson Capital Management, Llc | 22 640 | 352 | ||||||
| 2025-07-25 | 13F | Concurrent Investment Advisors, LLC | 28 514 | 97,62 | 443 | 127,18 | ||||
| 2025-08-15 | 13F | Equitable Holdings, Inc. | 181 155 | 47,82 | 2 815 | 69,27 | ||||
| 2025-08-05 | 13F | Sigma Planning Corp | 17 416 | 2,65 | 271 | 17,39 | ||||
| 2025-08-14 | 13F | Stifel Financial Corp | 40 752 | 27,75 | 633 | 46,53 | ||||
| 2025-08-12 | 13F | MAI Capital Management | 120 | 0,00 | 2 | 0,00 | ||||
| 2025-07-15 | 13F | Elevated Capital Advisors, LLC | 49 419 | 0,00 | 671 | 0,00 | ||||
| 2025-07-23 | 13F | Bellevue Asset Management, Llc | 1 202 | 0,59 | 19 | 12,50 | ||||
| 2025-08-20 | 13F/A | Coppell Advisory Solutions LLC | 26 069 | 96,29 | 404 | 110,42 |
Other Listings
| MX:FDD |