Grundläggande statistik
| Institutionella ägare | 290 total, 286 long only, 1 short only, 3 long/short - change of −3,32% MRQ |
| Genomsnittlig portföljallokering | 0.3245 % - change of −3,16% MRQ |
| Institutionella aktier (lång) | 41 412 029 (ex 13D/G) - change of −25,27MM shares −37,90% MRQ |
| Institutionellt värde (lång) | $ 1 538 001 USD ($1000) |
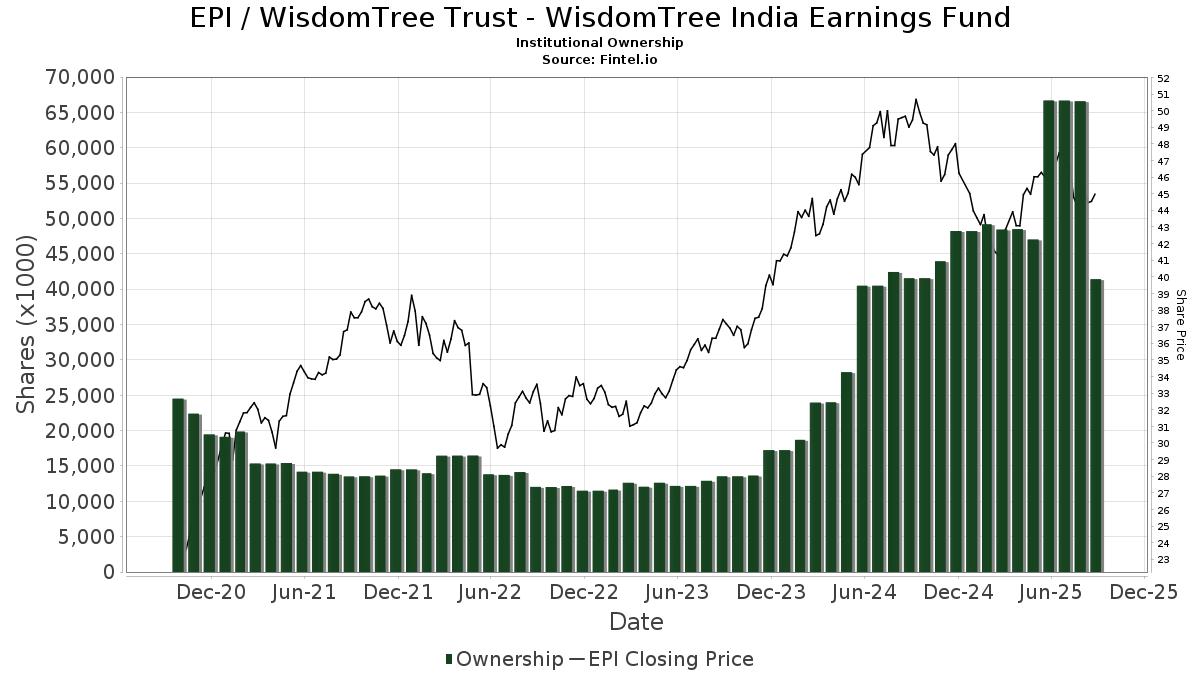
Institutionellt ägande och aktieägare
WisdomTree Trust - WisdomTree India Earnings Fund (US:EPI) har 290 Institutionella ägare och aktieägare som har lämnat in 13D/G- eller 13F-formulär till Securities Exchange Commission (SEC). Dessa institut innehar totalt 41,412,029 aktier. Största aktieägare inkluderar Morgan Stanley, Meitav Dash Investments Ltd, Clal Insurance Enterprises Holdings Ltd, Bank Of America Corp /de/, Migdal Insurance & Financial Holdings Ltd., LPL Financial LLC, Harel Insurance Investments & Financial Services Ltd., Bank Of Montreal /can/, Miracle Mile Advisors, LLC, and Kranot Hishtalmut Le Morim Ve Gananot Havera Menahelet LTD .
WisdomTree Trust - WisdomTree India Earnings Fund (ARCA:EPI) Institutionell ägarstruktur visar institutioners och fonders nuvarande positioner i företaget, samt de senaste förändringarna i positionernas storlek. Större aktieägare kan vara enskilda investerare, fonder, hedgefonder eller institutioner. Bilaga 13D visar att investeraren äger (eller ägde) mer än 5% av företaget och avser (eller avsåg) att aktivt eftersträva en förändring av affärsstrategin. Schedule 13G indikerar en passiv investering på över 5%.
The share price as of September 12, 2025 is 44,91 / share. Previously, on September 13, 2024, the share price was 49,74 / share. This represents a decline of 9,71% over that period.
Fondsentimentets poäng
Fondsentimentet poängen(fka Ägarackumulation-poäng) visar vilka aktier som är mest köpta av fonder. Det är resultatet av en sofistikerad kvantitativ flerfaktormodell som identifierar företag med de högsta nivåerna av institutionell ackumulering. Poängsättningsmodellen använder en kombination av den totala ökningen av redovisade ägare, förändringarna i portföljallokeringarna för dessa ägare och andra mått. Siffran sträcker sig från 0 till 100, där högre siffror indikerar en högre nivå av ackumulering i förhållande till sina konkurrenter, och 50 är genomsnittet.
Uppdateringsfrekvens: Dagligen
Se Ownership Explorer, som innehåller en lista över de högst rankade företagen.
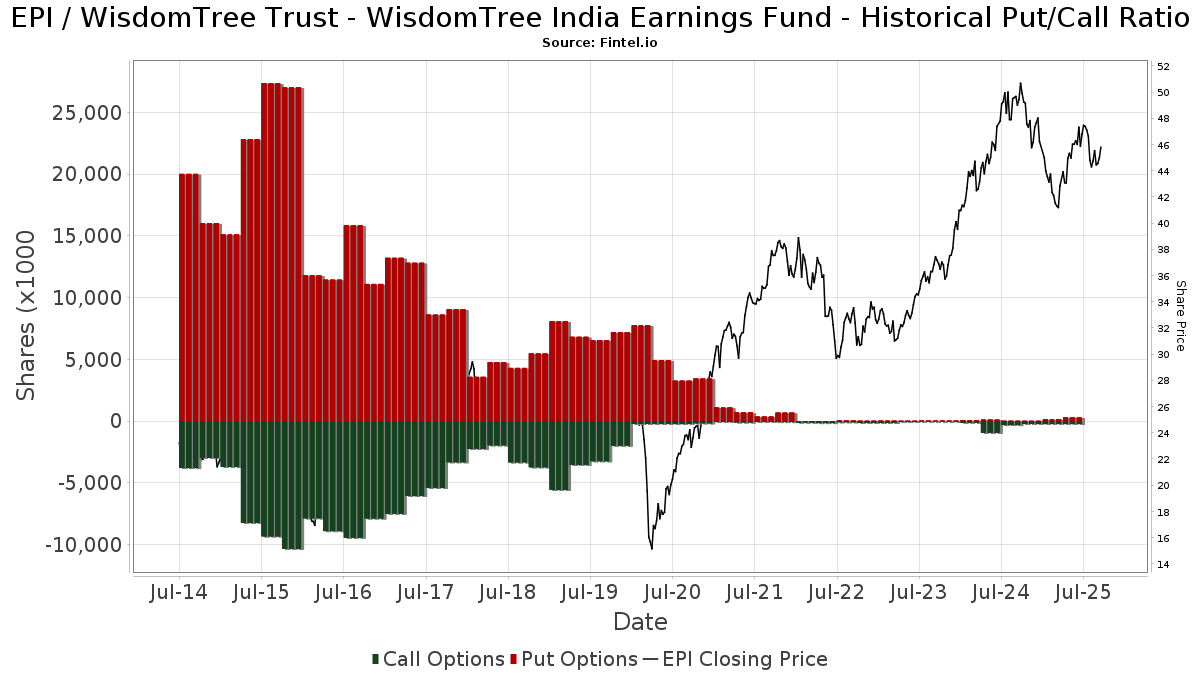
Institutionell sälj/köp-kvot
Förutom att rapportera vanliga eget kapital- och skuldemissioner måste institutioner med mer än 100MM tillgångar under förvaltning också avslöja sina innehav av sälj- och köpoptioner. Eftersom säljoptioner i allmänhet indikerar ett negativt sentiment och köpoptioner indikerar ett positivt sentiment, kan vi få en uppfattning om det övergripande institutionella sentimentet genom att plotta förhållandet mellan säljoptioner och köpoptioner. Diagrammet till höger visar det historiska förhållandet mellan sälj- och köpoptioner för detta instrument.
Genom att använda sälj/köp-kvoten som en indikator på aktieägarnas sentiment undviker man en av de största bristerna med att använda det totala institutionella ägandet, nämligen att en betydande del av de förvaltade tillgångarna investeras passivt för att följa index. Passivt förvaltade fonder köper vanligtvis inte optioner, så indikatorn för sälj/köp-kvoten ger en bättre bild av stämningen i aktivt förvaltade fonder.
13F- och NPORT-arkiveringar
Detaljer om 13F-arkiveringar är gratis. Detaljer om NP-arkiveringar kräver ett premiummedlemskap. Gröna rader indikerar nya positioner. Röda rader indikerar stängda positioner. Klicka på länk symbolen för att se hela transaktionshistoriken.
Uppgradera
för att låsa upp premiumdata och exportera till Excel ![]() .
.
| Fil Datum | Källa | Investerare | Typ | Genomsnittligt pris (beräknat) |
Aktier | Δ Aktier (%) |
Rapporterat värde (1000 USD) |
Δ Värde (%) |
Portföljallokering (%) |
|
|---|---|---|---|---|---|---|---|---|---|---|
| 2025-05-16 | 13F | Strait & Sound Wealth Management LLC | 0 | −100,00 | 0 | |||||
| 2025-07-29 | 13F | Chicago Partners Investment Group LLC | 4 875 | 227 | ||||||
| 2025-08-12 | 13F | Kohmann Bosshard Financial Services, LLC | 0 | −100,00 | 0 | |||||
| 2025-07-29 | 13F | Arista Wealth Management, LLC | 4 500 | 214 | ||||||
| 2025-08-14 | 13F | Strategic Wealth Designers | 3 700 | −94,93 | 176 | −94,70 | ||||
| 2025-05-02 | 13F | James Investment Research Inc | 0 | −100,00 | 0 | |||||
| 2025-08-04 | 13F | Migdal Insurance & Financial Holdings Ltd. | 2 515 670 | −1,78 | 119 | 7,21 | ||||
| 2025-08-13 | 13F | Smith, Moore & Co. | 4 593 | −26,50 | 218 | −20,15 | ||||
| 2025-05-12 | 13F | Beaumont Financial Advisors, LLC | 0 | −100,00 | 0 | |||||
| 2025-07-31 | 13F | Sage Mountain Advisors LLC | 0 | −100,00 | 0 | |||||
| 2025-08-04 | 13F | Hantz Financial Services, Inc. | 32 | 0 | ||||||
| 2025-08-08 | 13F | Itau Unibanco Holding S.A. | 22 000 | 0,00 | 1 044 | |||||
| 2025-07-08 | 13F | Lowe Wealth Advisors, LLC | 23 092 | 10,36 | 1 096 | 19,91 | ||||
| 2025-08-14 | 13F | Avid Wealth Partners LLC | 89 461 | 14,96 | 4 247 | 24,85 | ||||
| 2025-08-05 | 13F | Harel Insurance Investments & Financial Services Ltd. | 1 621 500 | 0,00 | 77 | 8,57 | ||||
| 2025-07-23 | 13F | Kingswood Wealth Advisors, Llc | 11 023 | −3,46 | 523 | 4,81 | ||||
| 2025-07-22 | 13F | Merit Financial Group, LLC | 22 012 | 3,30 | 1 045 | 12,14 | ||||
| 2025-05-01 | 13F | Steel Peak Wealth Management LLC | 0 | −100,00 | 0 | |||||
| 2025-08-06 | 13F | Legacy Wealth Managment, LLC/ID | 38 | 0,00 | 2 | 0,00 | ||||
| 2025-05-14 | 13F | Eqis Capital Management, Inc. | 0 | −100,00 | 0 | |||||
| 2025-08-07 | 13F | Zurcher Kantonalbank (Zurich Cantonalbank) | 10 850 | −0,81 | 516 | 7,52 | ||||
| 2025-08-14 | 13F | Atomi Financial Group, Inc. | 9 905 | −10,66 | 470 | −2,89 | ||||
| 2025-08-08 | 13F | SBI Securities Co., Ltd. | 309 596 | −5,45 | 14 697 | 2,68 | ||||
| 2025-08-14 | 13F | Horizon Investments, LLC | 100 | 5 | ||||||
| 2025-04-10 | 13F | EWG Elevate Inc. | 0 | −100,00 | 0 | |||||
| 2025-08-08 | 13F | Cetera Investment Advisers | 43 159 | 23,33 | 2 049 | 33,94 | ||||
| 2025-08-12 | 13F | Ameraudi Asset Management, Inc. | 7 780 | 369 | ||||||
| 2025-07-03 | 13F | Garde Capital, Inc. | 339 | 19,79 | 16 | 33,33 | ||||
| 2025-05-06 | 13F | Elm3 Financial Group, LLC | 0 | −100,00 | 0 | |||||
| 2025-08-05 | 13F | Strategic Financial Concepts, LLC | 41 259 | 1 959 | ||||||
| 2025-07-29 | 13F | Members Advisory Group LLC | 139 201 | 1,07 | 6 609 | 9,78 | ||||
| 2025-07-24 | 13F | Blair William & Co/il | 59 490 | 6,96 | 2 824 | 16,13 | ||||
| 2025-04-21 | 13F | Envestnet Portfolio Solutions, Inc. | 0 | −100,00 | 0 | |||||
| 2025-07-31 | 13F | GenTrust, LLC | 476 510 | 61,11 | 22 620 | 74,96 | ||||
| 2025-07-31 | 13F | Cambridge Investment Research Advisors, Inc. | 69 024 | −1,22 | 3 | 0,00 | ||||
| 2025-08-12 | 13F | Global Retirement Partners, LLC | 362 | −99,56 | 17 | −99,55 | ||||
| 2025-07-25 | 13F | Cwm, Llc | 200 | 0,00 | 0 | |||||
| 2025-08-14 | 13F | Headlands Technologies LLC | 1 485 | 70 | ||||||
| 2025-08-13 | 13F | EverSource Wealth Advisors, LLC | 0 | −100,00 | 0 | |||||
| 2025-08-13 | 13F | Idaho Trust Bank | 0 | −100,00 | 0 | |||||
| 2025-04-25 | 13F | Uniting Wealth Partners, LLC | 0 | −100,00 | 0 | |||||
| 2025-07-11 | 13F | Harbour Capital Advisors, LLC | 13 263 | 0,00 | 629 | 9,20 | ||||
| 2025-07-23 | 13F | Defined Financial Planning LLC | 40 896 | 16,24 | 1 910 | 24,77 | ||||
| 2025-07-09 | 13F | Procyon Private Wealth Partners, LLC | 6 462 | 14,33 | 307 | 23,89 | ||||
| 2025-08-07 | 13F | Parkside Financial Bank & Trust | 0 | −100,00 | 0 | |||||
| 2025-08-13 | 13F | IAG Wealth Partners, LLC | 26 | 0,00 | 1 | 0,00 | ||||
| 2025-08-14 | 13F | IHT Wealth Management, LLC | 32 251 | 8,33 | 1 531 | 17,60 | ||||
| 2025-08-14 | 13F/A | Rockefeller Capital Management L.P. | 64 246 | 19,37 | 3 050 | 29,63 | ||||
| 2025-05-15 | 13F | Beaumont Capital Management, LLC | 0 | −100,00 | 0 | |||||
| 2025-08-01 | 13F | Ferguson Shapiro LLC | 60 256 | 0,46 | 2 860 | 9,12 | ||||
| 2025-07-23 | 13F | Meitav Dash Investments Ltd | 3 367 899 | 1,39 | 159 919 | 10,17 | ||||
| 2025-08-14 | 13F | Bank Of America Corp /de/ | 2 689 972 | 8,06 | 127 693 | 17,35 | ||||
| 2025-07-09 | 13F | Breakwater Investment Management | 621 | 0,00 | 29 | 7,41 | ||||
| 2025-08-05 | 13F | Dunhill Financial, LLC | 5 452 | 0,00 | 259 | 8,40 | ||||
| 2025-08-13 | 13F | Gateway Wealth Partners, LLC | 9 791 | −8,53 | 465 | −0,64 | ||||
| 2025-08-12 | 13F | Jpmorgan Chase & Co | 743 712 | 6,82 | 35 304 | 16,01 | ||||
| 2025-08-05 | 13F | GHP Investment Advisors, Inc. | 8 104 | −11,98 | 385 | −4,48 | ||||
| 2025-04-29 | 13F | Onyx Bridge Wealth Group LLC | 0 | −100,00 | 0 | |||||
| 2025-07-22 | 13F | Wealthcare Advisory Partners LLC | 5 121 | 243 | ||||||
| 2025-07-29 | 13F | Millburn Ridgefield Corp | 433 341 | −11,40 | 20 571 | −3,78 | ||||
| 2025-08-08 | 13F | Larson Financial Group LLC | 332 | 0,00 | 16 | 7,14 | ||||
| 2025-04-23 | 13F | Creative Financial Designs Inc /adv | 0 | −100,00 | 0 | |||||
| 2025-08-13 | 13F | Jones Financial Companies Lllp | 28 523 | 60,63 | 1 355 | 75,52 | ||||
| 2025-08-14 | 13F | CoreCap Advisors, LLC | 740 | −98,83 | 35 | −98,73 | ||||
| 2025-05-09 | 13F | Belvedere Trading LLC | 0 | −100,00 | 0 | |||||
| 2025-05-09 | 13F | Belvedere Trading LLC | Put | 0 | −100,00 | 0 | ||||
| 2025-07-22 | 13F | Beacon Financial Advisory LLC | 25 173 | 12,12 | 1 195 | 21,71 | ||||
| 2025-05-12 | 13F | Basso Capital Management, L.p. | 0 | −100,00 | 0 | |||||
| 2025-04-30 | 13F | Axxcess Wealth Management, Llc | 0 | −100,00 | 0 | |||||
| 2025-05-09 | 13F | Belvedere Trading LLC | Call | 0 | −100,00 | 0 | ||||
| 2025-05-15 | 13F | Cubist Systematic Strategies, LLC | Call | 0 | −100,00 | 0 | ||||
| 2025-07-30 | 13F | Greenup Street Wealth Management Llc | 136 256 | 0,77 | 6 468 | 9,44 | ||||
| 2025-07-31 | 13F | Washington Trust Advisors, Inc. | 212 | 0,00 | 10 | 11,11 | ||||
| 2025-08-05 | 13F | Bank Of Montreal /can/ | 1 203 951 | 54,82 | 57 152 | 68,14 | ||||
| 2025-07-30 | 13F | FNY Investment Advisers, LLC | 0 | −100,00 | 0 | |||||
| 2025-08-01 | 13F | Gwn Securities Inc. | 5 596 | 266 | ||||||
| 2025-05-15 | 13F | Integrated Wealth Concepts LLC | 0 | −100,00 | 0 | |||||
| 2025-08-07 | 13F | Atala Financial Inc | 0 | −100,00 | 0 | |||||
| 2025-07-28 | 13F | Pettinga Financial Advisors, LLC | 6 350 | 0,00 | 301 | 8,66 | ||||
| 2025-08-14 | 13F | Comerica Bank | 13 512 | 2,51 | 641 | 11,28 | ||||
| 2025-07-28 | 13F | RFG Advisory, LLC | 4 853 | 230 | ||||||
| 2025-08-04 | 13F | Atria Investments Llc | 60 216 | 8,50 | 2 858 | 17,86 | ||||
| 2025-07-16 | 13F | ORG Partners LLC | 1 181 | 127,12 | 56 | 154,55 | ||||
| 2025-08-08 | 13F | Massachusetts Financial Services Co /ma/ | 304 460 | 19,14 | 14 453 | 29,38 | ||||
| 2025-08-08 | 13F | Pnc Financial Services Group, Inc. | 3 722 | −71,01 | 177 | −68,63 | ||||
| 2025-07-28 | 13F | Harbour Investments, Inc. | 3 909 | 10,36 | 186 | 20,13 | ||||
| 2025-08-14 | 13F | Df Dent & Co Inc | 9 000 | 0,00 | 427 | 8,65 | ||||
| 2025-04-11 | 13F | DHK Financial Advisors, Inc. | 0 | −100,00 | 0 | |||||
| 2025-08-04 | 13F | Spire Wealth Management | 170 | 0,00 | 8 | 14,29 | ||||
| 2025-07-17 | 13F | Investment Research & Advisory Group, Inc. | 200 | 0,00 | 9 | 12,50 | ||||
| 2025-07-28 | 13F | Kiker Wealth Management, LLC | 345 | 0,00 | 16 | 6,67 | ||||
| 2025-08-05 | 13F | Verity Asset Management, Inc. | 18 903 | −1,11 | 897 | 7,43 | ||||
| 2025-08-08 | 13F | SG Americas Securities, LLC | 34 741 | −0,25 | 2 | 0,00 | ||||
| 2025-07-25 | 13F | Sequoia Financial Advisors, LLC | 4 772 | 0,00 | 227 | 8,65 | ||||
| 2025-08-14 | 13F | UBS Group AG | 627 216 | −16,20 | 29 774 | −9,00 | ||||
| 2025-08-14 | 13F | UBS Group AG | Call | 22 540 | 0,00 | 1 070 | 8,53 | |||
| 2025-08-14 | 13F | Hrt Financial Lp | 0 | −100,00 | 0 | |||||
| 2025-07-31 | 13F | Kranot Hishtalmut Le Morim Tichoniim Havera Menahelet LTD | 342 373 | 1,85 | 16 262 | 10,74 | ||||
| 2025-08-08 | 13F | Creative Planning | 15 239 | 1,02 | 723 | 9,71 | ||||
| 2025-08-06 | 13F | North Capital, Inc. | 750 | 36 | ||||||
| 2025-08-25 | 13F/A | Neuberger Berman Group LLC | 13 211 | 0,00 | 627 | 8,67 | ||||
| 2025-08-14 | 13F | Old Mission Capital Llc | 17 264 | −93,08 | 820 | −92,49 | ||||
| 2025-04-25 | 13F | Trademark Financial Management, LLC | 0 | −100,00 | 0 | −100,00 | ||||
| 2025-07-08 | 13F | Nbc Securities, Inc. | 13 013 | 2,02 | 1 | |||||
| 2025-08-05 | 13F | Key FInancial Inc | 0 | −100,00 | 0 | |||||
| 2025-05-20 | 13F/A | Colony Group, LLC | 0 | −100,00 | 0 | −100,00 | ||||
| 2025-08-11 | 13F | Covestor Ltd | 45 | 18,42 | 0 | |||||
| 2025-07-17 | 13F | Janney Montgomery Scott LLC | 12 652 | −6,81 | 1 | |||||
| 2025-04-29 | 13F | Raleigh Capital Management Inc. | 0 | −100,00 | 0 | |||||
| 2025-08-27 | 13F/A | Squarepoint Ops LLC | 14 963 | 710 | ||||||
| 2025-08-14 | 13F | Great Valley Advisor Group, Inc. | 0 | −100,00 | 0 | |||||
| 2025-08-12 | 13F | CIBC Private Wealth Group, LLC | 490 973 | 0,00 | 23 306 | 14,94 | ||||
| 2025-07-22 | 13F | Belpointe Asset Management LLC | 4 581 | −87,56 | 217 | −86,51 | ||||
| 2025-07-17 | 13F | Venture Visionary Partners LLC | 443 534 | 0,89 | 21 055 | 9,56 | ||||
| 2025-08-06 | 13F | Legacy Investment Solutions, LLC | 38 | 0,00 | 2 | 0,00 | ||||
| 2025-08-14 | 13F | Tudor Investment Corp Et Al | 28 211 | 111,68 | 1 339 | 130,07 | ||||
| 2025-08-13 | 13F | Russell Investments Group, Ltd. | 1 319 | 0,00 | 63 | 8,77 | ||||
| 2025-08-05 | 13F | Carmel Capital Management L.L.C. | 129 405 | 0,31 | 6 143 | 8,94 | ||||
| 2025-08-14 | 13F | Mariner, LLC | 26 722 | 4,78 | 1 268 | 13,82 | ||||
| 2025-07-30 | 13F | Insight Advisors, LLC/ PA | 43 463 | 126,78 | 2 063 | 146,48 | ||||
| 2025-07-17 | 13F | Moody Lynn & Lieberson, Llc | 9 052 | −0,55 | 430 | 8,06 | ||||
| 2025-08-13 | 13F | Bank Of Nova Scotia | 23 365 | −1,79 | 1 109 | 6,74 | ||||
| 2025-08-13 | 13F | Northern Trust Corp | 8 923 | 12,95 | 424 | 22,61 | ||||
| 2025-09-12 | 13F/A | Valeo Financial Advisors, LLC | 49 712 | 269,06 | 672 | 14,12 | ||||
| 2025-05-22 | 13F | Mattson Financial Services, LLC | 0 | −100,00 | 0 | |||||
| 2025-08-06 | 13F | Csenge Advisory Group | 8 825 | −22,36 | 408 | −18,40 | ||||
| 2025-07-17 | 13F | Forefront Wealth Management Inc. | 55 423 | 2,00 | 2 631 | 10,78 | ||||
| 2025-05-15 | 13F | Advisory Services Network, LLC | 0 | −100,00 | 0 | |||||
| 2025-08-14 | 13F | Susquehanna International Group, Llp | 80 063 | 22,83 | 3 801 | 33,38 | ||||
| 2025-04-15 | 13F | Redhawk Wealth Advisors, Inc. | 0 | −100,00 | 0 | |||||
| 2025-07-17 | 13F | Farmers & Merchants Trust Co of Long Beach | 10 158 | 482 | ||||||
| 2025-08-01 | 13F | Y-Intercept (Hong Kong) Ltd | 16 256 | 772 | ||||||
| 2025-08-01 | 13F | Jennison Associates Llc | 59 079 | −87,81 | 2 804 | −86,76 | ||||
| 2025-07-25 | 13F | NorthRock Partners, LLC | 0 | −100,00 | 0 | |||||
| 2025-08-18 | 13F/A | National Bank Of Canada /fi/ | 1 055 | 0,00 | 50 | 8,70 | ||||
| 2025-07-29 | 13F | Fundamentun, Llc | 55 960 | 43,58 | 2 656 | 55,96 | ||||
| 2025-08-14 | 13F | Susquehanna International Group, Llp | Call | 59 000 | 14,34 | 2 801 | 24,17 | |||
| 2025-08-14 | 13F | Susquehanna International Group, Llp | Put | 80 800 | 3 836 | |||||
| 2025-08-07 | 13F | PFG Advisors | 0 | −100,00 | 0 | |||||
| 2025-05-05 | 13F | Lindbrook Capital, Llc | 2 270 | 0,00 | 99 | −2,94 | ||||
| 2025-08-07 | 13F | Allworth Financial LP | 59 569 | 12 284,41 | 2 828 | 13 361,90 | ||||
| 2025-07-14 | 13F | Park Avenue Securities Llc | 98 697 | 7,81 | 5 | 0,00 | ||||
| 2025-08-14 | 13F | Mml Investors Services, Llc | 206 741 | 2,32 | 10 | 12,50 | ||||
| 2025-08-14 | 13F | Driehaus Capital Management Llc | 91 206 | −87,88 | 4 330 | −86,84 | ||||
| 2025-07-15 | 13F | Oxinas Partners Wealth Management LLC | 19 015 | 1,29 | 903 | 10,00 | ||||
| 2025-07-31 | 13F | Catalyst Capital Advisors LLC | 433 341 | −11,40 | 20 571 | −3,78 | ||||
| 2025-08-08 | 13F | Hartland & Co., LLC | 24 438 | 256,34 | 1 160 | 287,96 | ||||
| 2025-07-29 | 13F | Stratos Wealth Advisors, LLC | 0 | −100,00 | 0 | |||||
| 2025-08-13 | 13F | Brown Advisory Inc | 14 169 | −17,92 | 673 | −10,88 | ||||
| 2025-08-13 | 13F | Portland Global Advisors LLC | 8 555 | −8,80 | 406 | −0,98 | ||||
| 2025-07-21 | 13F | Mirae Asset Global Investments Co., Ltd. | 22 000 | 0,00 | 1 044 | 9,21 | ||||
| 2025-04-25 | 13F | New Wave Wealth Advisors Llc | 0 | −100,00 | 0 | |||||
| 2025-08-08 | 13F | Avantax Advisory Services, Inc. | 7 935 | 377 | ||||||
| 2025-08-12 | 13F | PSI Advisors, LLC | 0 | −100,00 | 0 | |||||
| 2025-08-13 | 13F | Continuum Advisory, LLC | 0 | −100,00 | 0 | |||||
| 2025-08-14 | 13F | Kovitz Investment Group Partners, LLC | 14 674 | −5,88 | 697 | 2,20 | ||||
| 2025-07-28 | 13F | Rosenberg Matthew Hamilton | 4 230 | −2,65 | 201 | 5,82 | ||||
| 2025-07-29 | 13F | Private Trust Co Na | 4 915 | 7,69 | 233 | 17,09 | ||||
| 2025-07-24 | 13F | Baldwin Brothers Inc/ma | 13 070 | 0,00 | 620 | 8,58 | ||||
| 2025-07-17 | 13F | Paradigm Financial Partners, Llc | 40 177 | −1,41 | 1 907 | 7,07 | ||||
| 2025-07-16 | 13F | Perigon Wealth Management, LLC | 15 527 | 1,41 | 737 | 10,16 | ||||
| 2025-07-31 | 13F | Harbour Investment Management Llc | 8 137 | −2,52 | 386 | 6,04 | ||||
| 2025-08-11 | 13F | Aptus Capital Advisors, LLC | 2 500 | −16,75 | 119 | −9,92 | ||||
| 2025-05-15 | 13F | CAPROCK Group, Inc. | 21 376 | 113,21 | 934 | 106,18 | ||||
| 2025-08-13 | 13F | Baird Financial Group, Inc. | 0 | −100,00 | 0 | |||||
| 2025-07-23 | 13F | Peak Financial Management, Inc. | 8 873 | 0,00 | 421 | 8,79 | ||||
| 2025-08-14 | 13F | Ameriprise Financial Inc | 459 561 | 0,23 | 21 810 | 8,57 | ||||
| 2025-04-30 | 13F | Personal Cfo Solutions, Llc | 0 | −100,00 | 0 | |||||
| 2025-07-10 | 13F | Pachira Investments Inc. | 22 517 | 0,54 | 1 069 | 9,76 | ||||
| 2025-07-25 | 13F | Apollon Wealth Management, LLC | 26 884 | 482,16 | 1 276 | 534,83 | ||||
| 2025-04-08 | 13F | Advisory Alpha, LLC | 0 | −100,00 | 0 | |||||
| 2025-08-12 | 13F | J.w. Cole Advisors, Inc. | 5 438 | 258 | ||||||
| 2025-08-14 | 13F | Byrne Financial Freedom, Llc | 13 011 | −4,16 | 618 | 4,05 | ||||
| 2025-08-18 | 13F/A | Nomura Holdings Inc | Call | 131 400 | 0,00 | 6 238 | 8,60 | |||
| 2025-07-31 | 13F | Money Design Co.,Ltd. | 753 862 | 7,41 | 36 | 16,67 | ||||
| 2025-08-05 | 13F | Provident Co of the Employees of the Hebrew University LTD | 155 346 | 25,84 | 7 379 | 36,83 | ||||
| 2025-07-22 | 13F | MGO Private Wealth, LLC | 7 870 | 374 | ||||||
| 2025-05-15 | 13F | SRS Capital Advisors, Inc. | 0 | −100,00 | 0 | |||||
| 2025-08-14 | 13F | Stifel Financial Corp | 51 595 | −1,80 | 2 450 | 6,62 | ||||
| 2025-08-26 | 13F/A | Thrivent Financial For Lutherans | 170 898 | −27,45 | 8 | −27,27 | ||||
| 2025-04-09 | 13F | HBW Advisory Services LLC | 0 | −100,00 | 0 | |||||
| 2025-07-28 | 13F | Twin Tree Management, LP | Put | 58 900 | 2 796 | |||||
| 2025-08-14 | 13F | Raymond James Financial Inc | 517 389 | 16,87 | 24 560 | 26,93 | ||||
| 2025-08-14 | 13F | Silvercrest Asset Management Group Llc | 13 700 | 0,00 | 650 | 8,70 | ||||
| 2025-08-11 | 13F | Tidemark, LLC | 37 | 0,00 | 2 | 0,00 | ||||
| 2025-08-14 | 13F | EP Wealth Advisors, Inc. | 21 960 | 1 042 | ||||||
| 2025-07-07 | 13F | Whitaker-Myers Wealth Managers, LTD. | 296 285 | 2,28 | 14 065 | 11,08 | ||||
| 2025-04-29 | 13F | Truist Financial Corp | 0 | −100,00 | 0 | |||||
| 2025-08-12 | 13F | Calton & Associates, Inc. | 32 048 | 28,70 | 1 521 | 39,80 | ||||
| 2025-07-31 | 13F | Asset Management One Co., Ltd. | 0 | −100,00 | 0 | |||||
| 2025-08-18 | 13F | Tyler-Stone Wealth Management | 7 251 | 7,76 | 344 | 17,01 | ||||
| 2025-08-08 | 13F | Islay Capital Management, Llc | 3 000 | 0,00 | 142 | 8,40 | ||||
| 2025-05-12 | 13F | C2P Capital Advisory Group, LLC d.b.a. Prosperity Capital Advisors | 0 | −100,00 | 0 | −100,00 | ||||
| 2025-07-23 | 13F | Viewpoint Capital Management LLC | 23 972 | 0,00 | 1 138 | 8,60 | ||||
| 2025-08-13 | 13F | VestGen Advisors, LLC | 10 130 | 6,68 | 481 | 15,66 | ||||
| 2025-08-14 | 13F | Goldman Sachs Group Inc | 68 176 | −9,59 | 3 236 | −1,79 | ||||
| 2025-08-08 | 13F | Adapt Wealth Advisors, Llc | 171 999 | 1,13 | 8 165 | 9,83 | ||||
| 2025-07-16 | 13F | Crown Wealth Group, LLC | 65 987 | 92,31 | 3 132 | 108,94 | ||||
| 2025-07-31 | 13F | Sharper & Granite LLC | 24 250 | 31,58 | 1 151 | 42,86 | ||||
| 2025-08-14 | 13F | Evercore Wealth Management, LLC | 4 475 | 212 | ||||||
| 2025-04-22 | 13F | Aspire Capital Advisors LLC | 0 | −100,00 | 0 | |||||
| 2025-07-31 | 13F | Kranot Hishtalmut Le Morim Ve Gananot Havera Menahelet LTD | 987 040 | 0,82 | 46 883 | 9,62 | ||||
| 2025-08-14 | 13F/A | Barclays Plc | 63 937 | −52,03 | 3 | −40,00 | ||||
| 2025-08-14 | 13F | Smartleaf Asset Management LLC | 20 377 | 0,73 | 968 | 10,13 | ||||
| 2025-07-24 | 13F | Robertson Stephens Wealth Management, LLC | 21 065 | 4,97 | 1 000 | 13,91 | ||||
| 2025-04-25 | 13F | Essex Financial Services, Inc. | 0 | −100,00 | 0 | |||||
| 2025-07-08 | 13F | Northwest & Ethical Investments L.P. | 0 | −100,00 | 0 | −100,00 | ||||
| 2025-07-30 | 13F | Bogart Wealth, LLC | 838 | 0,00 | 40 | 8,33 | ||||
| 2025-09-04 | 13F/A | Advisor Group Holdings, Inc. | 24 140 | −6,46 | 1 141 | 1,15 | ||||
| 2025-07-11 | 13F | Afg Fiduciary Services Limited Partnership | 19 338 | 26,62 | 921 | 40,18 | ||||
| 2025-08-12 | 13F | PKS Advisory Services, LLC | 29 312 | 3,25 | 1 391 | 12,18 | ||||
| 2025-07-23 | 13F | Venturi Wealth Management, LLC | 0 | −100,00 | 0 | |||||
| 2025-08-12 | 13F | Insigneo Advisory Services, Llc | 13 724 | 21,48 | 651 | 32,05 | ||||
| 2025-08-15 | 13F/A | MONECO Advisors, LLC | 0 | −100,00 | 0 | |||||
| 2025-05-16 | 13F | Ascent Group, LLC | 0 | −100,00 | 0 | |||||
| 2025-07-16 | 13F | Randolph Co Inc | 215 904 | 1,67 | 10 249 | 10,42 | ||||
| 2025-08-11 | 13F | Hexagon Capital Partners LLC | 0 | −100,00 | 0 | |||||
| 2025-07-21 | 13F | Patriot Financial Group Insurance Agency, LLC | 51 882 | −4,39 | 2 463 | 3,84 | ||||
| 2025-08-05 | 13F | Sigma Planning Corp | 9 315 | 3,08 | 442 | 11,90 | ||||
| 2025-08-15 | 13F | Equitable Holdings, Inc. | 94 355 | 84,47 | 4 479 | 100,40 | ||||
| 2025-08-13 | 13F | Flow Traders U.s. Llc | 78 222 | −40,91 | 4 | −40,00 | ||||
| 2025-08-12 | 13F | MAI Capital Management | 200 | −40,30 | 10 | −35,71 | ||||
| 2025-08-12 | 13F | Tableaux Llc | 0 | −100,00 | 0 | |||||
| 2025-08-14 | 13F | Qube Research & Technologies Ltd | 381 | −69,47 | 18 | −66,67 | ||||
| 2025-05-06 | 13F | Black Swift Group, LLC | 0 | −100,00 | 0 | |||||
| 2025-07-11 | 13F/A | Umb Bank N A/mo | 7 434 | 0,00 | 353 | 8,64 | ||||
| 2025-07-18 | 13F | Naples Global Advisors, Llc | 24 229 | 0,00 | 1 150 | 8,59 | ||||
| 2025-08-14 | 13F | Federation des caisses Desjardins du Quebec | 200 | −28,57 | 9 | −25,00 | ||||
| 2025-08-11 | 13F | Trajan Wealth LLC | 351 278 | 33,16 | 16 675 | 44,61 | ||||
| 2025-08-12 | 13F | BlackRock, Inc. | 309 472 | −88,14 | 14 691 | −87,12 | ||||
| 2025-07-22 | 13F | Gsa Capital Partners Llp | 0 | −100,00 | 0 | |||||
| 2025-04-21 | 13F | Nelson, Van Denburg & Campbell Wealth Management Group, LLC | 0 | −100,00 | 0 | |||||
| 2025-07-24 | 13F | Us Bancorp \de\ | 1 330 | 0,00 | 63 | 8,62 | ||||
| 2025-08-14 | 13F | Jane Street Group, Llc | 351 484 | 1 392,50 | 16 685 | 1 521,38 | ||||
| 2025-08-15 | 13F | Morgan Stanley | 3 789 452 | 16,19 | 179 885 | 26,19 | ||||
| 2025-08-14 | 13F | Mercer Global Advisors Inc /adv | 6 997 | −18,82 | 332 | −11,70 | ||||
| 2025-08-14 | 13F | Millennium Management Llc | 37 391 | −2,78 | 1 775 | 5,53 | ||||
| 2025-08-14 | 13F | Jane Street Group, Llc | Put | 150 300 | 0,13 | 7 135 | 8,75 | |||
| 2025-07-09 | 13F | Dynamic Advisor Solutions LLC | 67 404 | 885,87 | 3 200 | 973,49 | ||||
| 2025-08-11 | 13F | TD Waterhouse Canada Inc. | 28 855 | 401,39 | 1 374 | 449,20 | ||||
| 2025-08-13 | 13F | Quadrature Capital Ltd | 47 376 | −65,34 | 2 248 | −62,38 | ||||
| 2025-07-14 | 13F | Sweeney & Michel, Llc | 19 103 | 10,66 | 893 | 25,28 | ||||
| 2025-05-08 | 13F | Plante Moran Financial Advisors, LLC | 0 | −100,00 | 0 | |||||
| 2025-07-18 | 13F | TruNorth Capital Management, LLC | 500 | 0,00 | 24 | 9,52 | ||||
| 2025-08-14 | 13F | Glen Eagle Advisors, LLC | 104 177 | 2,72 | 4 945 | 11,55 | ||||
| 2025-04-29 | 13F | Resources Investment Advisors, LLC. | 0 | −100,00 | 0 | |||||
| 2025-07-09 | 13F | Lifestyle Asset Management, Inc. | 17 646 | −3,38 | 838 | 4,89 | ||||
| 2025-08-11 | 13F | Private Advisor Group, LLC | 332 876 | 24,91 | 15 802 | 35,65 | ||||
| 2025-07-25 | 13F | Atria Wealth Solutions, Inc. | 0 | −100,00 | 0 | |||||
| 2025-08-07 | 13F | Runnymede Capital Advisors, Inc. | 0 | −100,00 | 0 | |||||
| 2025-08-11 | 13F | Principal Securities, Inc. | 851 | −92,49 | 40 | −92,19 | ||||
| 2025-08-14 | 13F | Murphy & Mullick Capital Management Corp | 1 358 | 0,00 | 61 | 3,39 | ||||
| 2025-04-30 | 13F | M&t Bank Corp | 0 | −100,00 | 0 | |||||
| 2025-08-07 | 13F | Cascade Financial Partners, LLC | 15 950 | −10,14 | 757 | −2,32 | ||||
| 2025-08-14 | 13F | Fmr Llc | 4 683 | −2,48 | 222 | 6,22 | ||||
| 2025-08-15 | 13F | Tower Research Capital LLC (TRC) | 5 | −98,95 | 0 | −100,00 | ||||
| 2025-08-05 | 13F | Prosperity Consulting Group, LLC | 88 580 | 0,99 | 4 205 | 9,68 | ||||
| 2025-08-08 | 13F/A | Prospect Financial Services LLC | 8 841 | 0,00 | 420 | 8,55 | ||||
| 2025-08-11 | 13F | Inspire Advisors, LLC | 90 389 | −1,45 | 4 291 | 7,04 | ||||
| 2025-07-15 | 13F | GSB Wealth Management, LLC | 92 611 | 0,08 | 4 396 | 8,70 | ||||
| 2025-08-05 | 13F | Simplex Trading, Llc | 1 524 | −88,53 | 0 | |||||
| 2025-08-06 | 13F | Moors & Cabot, Inc. | 12 419 | 0,20 | 590 | 8,87 | ||||
| 2025-08-12 | 13F | Proequities, Inc. | 0 | 0 | ||||||
| 2025-08-13 | 13F | Summit Financial, LLC | 30 758 | −79,46 | 1 460 | −77,69 | ||||
| 2025-07-17 | 13F | Global Trust Asset Management, LLC | 2 725 | 81,67 | 129 | 98,46 | ||||
| 2025-08-01 | 13F | Biltmore Family Office, LLC | 20 | 0,00 | 1 | |||||
| 2025-08-14 | 13F | Lazard Asset Management Llc | 0 | −100,00 | 0 | |||||
| 2025-07-14 | 13F | Narus Financial Partners, LLC | 47 487 | 9,68 | 2 254 | 19,13 | ||||
| 2025-08-12 | 13F | Putnam Fl Investment Management Co | 789 116 | −20,65 | 37 459 | −13,82 | ||||
| 2025-08-14 | 13F | Bnp Paribas Arbitrage, Sa | 6 916 | −30,32 | 328 | −24,25 | ||||
| 2025-08-12 | 13F | Yahav Achim Ve Achayot - Provident Funds Management Co Ltd. | 33 076 | 0,00 | 1 571 | 8,80 | ||||
| 2025-08-14 | 13F | Citadel Advisors Llc | Call | 15 700 | 60,20 | 745 | 74,07 | |||
| 2025-08-14 | 13F | Citadel Advisors Llc | 145 062 | 122,11 | 6 886 | 141,28 | ||||
| 2025-07-31 | 13F | Wealthfront Advisers Llc | 50 267 | −5,94 | 2 386 | 2,18 | ||||
| 2025-08-14 | 13F | Citadel Advisors Llc | Put | 10 800 | 47,95 | 513 | 60,50 | |||
| 2025-08-08 | 13F | Laurel Wealth Planning LLC | 144 719 | 6,84 | 6 870 | 16,03 | ||||
| 2025-08-12 | 13F | O'shaughnessy Asset Management, Llc | 158 | −8,67 | 8 | 0,00 | ||||
| 2025-05-15 | 13F | Discovery Capital Management, Llc / Ct | 0 | −100,00 | 0 | |||||
| 2025-07-09 | 13F | Channel Wealth Llc | 67 970 | 4,25 | 3 227 | 13,23 | ||||
| 2025-06-13 | 13F | Optima Capital Llc | 0 | −100,00 | 0 | −100,00 | ||||
| 2025-07-18 | 13F | Cohen Klingenstein LLC | 53 600 | 0,00 | 2 544 | 8,63 | ||||
| 2025-08-12 | 13F | Clal Insurance Enterprises Holdings Ltd | 3 000 000 | 0,00 | 142 | 8,40 | ||||
| 2025-05-12 | 13F | Aveo Capital Partners, LLC | 0 | −100,00 | 0 | |||||
| 2025-08-08 | 13F | Meridian Wealth Management, LLC | 75 106 | 485,17 | 3 565 | 535,47 | ||||
| 2025-08-12 | 13F | LPL Financial LLC | 1 827 793 | 19,15 | 86 765 | 29,40 | ||||
| 2025-07-17 | 13F | Hanson & Doremus Investment Management | 2 665 | 0,00 | 0 | |||||
| 2025-08-14 | 13F | Glenmede Investment Management, LP | 2 343 | 111 | ||||||
| 2025-08-06 | 13F | Savant Capital, LLC | 20 597 | 0,16 | 978 | 8,80 | ||||
| 2025-07-11 | 13F | Diversified Trust Co | 8 560 | 0,00 | 406 | 8,56 | ||||
| 2025-07-01 | 13F | Harbor Investment Advisory, Llc | 7 650 | −2,61 | 363 | 5,83 | ||||
| 2025-04-30 | 13F | Cerity Partners LLC | 0 | −100,00 | 0 | |||||
| 2025-07-10 | 13F | Atticus Wealth Management, Llc | 824 | −15,57 | 39 | −7,14 | ||||
| 2025-08-13 | 13F | Beacon Pointe Advisors, LLC | 30 227 | −14,15 | 1 435 | −6,82 | ||||
| 2025-08-11 | 13F | Western Wealth Management, LLC | 10 329 | 13,44 | 490 | 23,43 | ||||
| 2025-05-15 | 13F | Glenmede Trust Co Na | 2 343 | 0,00 | 102 | −3,77 | ||||
| 2025-07-08 | 13F | Parallel Advisors, LLC | 818 | 0,00 | 39 | 8,57 | ||||
| 2025-08-05 | 13F | Huntington National Bank | 53 | 10,42 | ||||||
| 2025-07-25 | 13F | RoundAngle Advisors LLC | 38 553 | 3,51 | 1 830 | 12,41 | ||||
| 2025-08-11 | 13F | Theory Financial Llc | 43 292 | −43,89 | 1 937 | −42,56 | ||||
| 2025-07-29 | 13F | Stratos Wealth Partners, LTD. | 199 696 | −3,80 | 9 480 | 4,47 | ||||
| 2025-08-12 | 13F | Financial Advocates Investment Management | 9 424 | 1,97 | 447 | 10,92 | ||||
| 2025-08-14 | 13F | Group One Trading, L.p. | 0 | −100,00 | 0 | |||||
| 2025-08-18 | 13F | Geneos Wealth Management Inc. | 100 | 0,00 | 5 | 0,00 | ||||
| 2025-08-13 | 13F | Loomis Sayles & Co L P | 91 131 | 87,82 | 4 326 | 216 150,00 | ||||
| 2025-07-10 | 13F | Wealth Enhancement Advisory Services, Llc | 22 088 | −6,61 | 1 052 | 1,84 | ||||
| 2025-08-13 | 13F | Cresset Asset Management, LLC | 0 | −100,00 | 0 | |||||
| 2025-07-14 | 13F | AdvisorNet Financial, Inc | 0 | −100,00 | 0 | |||||
| 2025-04-28 | 13F | First Horizon Advisors, Inc. | 0 | −100,00 | 0 | −100,00 | ||||
| 2025-08-14 | 13F | CIBC World Markets Inc. | 23 422 | 344,61 | 1 112 | 383,04 | ||||
| 2025-08-13 | 13F | Arrowstreet Capital, Limited Partnership | 0 | −100,00 | 0 | |||||
| 2025-04-21 | 13F | Siligmueller & Norvid Wealth Advisors LLC | 0 | −100,00 | 0 | |||||
| 2025-08-13 | 13F | Riverview Capital Advisers, LLC | 8 855 | −11,05 | 420 | −3,45 | ||||
| 2025-08-12 | 13F | Steward Partners Investment Advisory, Llc | 16 983 | 14,58 | 806 | 24,57 | ||||
| 2025-08-29 | NP | MBXAX - Catalyst/Millburn Hedge Strategy Fund Class A | 433 341 | −11,40 | 20 571 | −3,78 | ||||
| 2025-08-01 | 13F | Capital Investment Counsel, LLC | 195 374 | 769,18 | 9 274 | 844,40 | ||||
| 2025-08-05 | 13F | GPS Wealth Strategies Group, LLC | 150 | 0,00 | 7 | 16,67 | ||||
| 2025-07-24 | 13F | Ramirez Asset Management, Inc. | 3 200 | −1,54 | 152 | 6,34 | ||||
| 2025-07-11 | 13F | Caldwell Securities, Inc | 455 | 3,41 | 22 | 10,53 | ||||
| 2025-04-23 | 13F | PMV Capital Advisers, LLC | 0 | −100,00 | 0 | |||||
| 2025-08-11 | 13F | Actinver Wealth Management, Inc. | 0 | −100,00 | 0 | |||||
| 2025-08-11 | 13F | Citigroup Inc | 96 485 | −70,29 | 4 580 | −67,73 | ||||
| 2025-08-06 | 13F | Commonwealth Equity Services, Llc | 287 137 | 7,66 | 14 | 18,18 | ||||
| 2025-08-14 | 13F | Sunbelt Securities, Inc. | 498 | 0,00 | 23 | 4,76 | ||||
| 2025-07-24 | 13F | Ronald Blue Trust, Inc. | 205 | −46,48 | 10 | −43,75 | ||||
| 2025-08-04 | 13F | Assetmark, Inc | 4 904 | −20,32 | 233 | −13,75 | ||||
| 2025-08-14 | 13F | GWM Advisors LLC | 17 053 | −6,36 | 810 | 1,63 | ||||
| 2025-07-22 | 13F | Sava Infond d.o.o. | 5 000 | 0,00 | 237 | 8,72 | ||||
| 2025-07-22 | 13F | Rocky Mountain Advisers, Llc | 565 | 0,00 | 27 | 8,33 | ||||
| 2025-08-13 | 13F | Renaissance Technologies Llc | 6 900 | 328 | ||||||
| 2025-07-07 | 13F | First Community Trust Na | 78 | 0,00 | 4 | 0,00 | ||||
| 2025-08-15 | 13F | Chapman Financial Group, Llc | 27 151 | −23,61 | 1 289 | −18,27 | ||||
| 2025-08-15 | 13F | Kestra Advisory Services, LLC | 338 167 | 9,75 | 16 053 | 19,19 | ||||
| 2025-07-22 | 13F | Miracle Mile Advisors, LLC | 1 007 601 | 6,52 | 47 831 | 15,68 | ||||
| 2025-08-14 | 13F | Cantor Fitzgerald, L. P. | 6 093 | 289 | ||||||
| 2025-08-14 | 13F | Royal Bank Of Canada | 301 985 | −5,00 | 14 335 | 3,17 | ||||
| 2025-08-15 | 13F | Captrust Financial Advisors | 7 063 | 0,43 | 335 | 9,12 | ||||
| 2025-05-05 | 13F | OneAscent Financial Services LLC | 0 | −100,00 | 0 | |||||
| 2025-08-18 | 13F | Wolverine Trading, Llc | Call | 0 | −100,00 | 0 | −100,00 | |||
| 2025-07-11 | 13F | Farther Finance Advisors, LLC | 555 | 0,00 | 26 | 8,33 | ||||
| 2025-08-14 | 13F | Wellington Management Group Llp | 0 | −100,00 | 0 | |||||
| 2025-07-29 | 13F | Sowa Financial Group, Inc. | 14 442 | −75,52 | 1 | −100,00 | ||||
| 2025-05-13 | 13F | Hanlon Investment Management, Inc. | 0 | −100,00 | 0 | |||||
| 2025-05-15 | 13F | Cullen Capital Management, LLC | 181 173 | −37,05 | 7 919 | −39,22 | ||||
| 2025-07-15 | 13F | BigSur Wealth Management LLC | 10 000 | 0,00 | 475 | 8,47 | ||||
| 2025-04-22 | 13F | World Equity Group, Inc. | 0 | −100,00 | 0 | |||||
| 2025-08-12 | 13F | Pathstone Holdings, LLC | 8 836 | 1,95 | 419 | 10,85 | ||||
| 2025-08-14 | 13F | Circle Wealth Management, LLC | 66 489 | −4,39 | 3 156 | 3,85 | ||||
| 2025-07-25 | 13F | Concurrent Investment Advisors, LLC | 24 206 | 1 149 | ||||||
| 2025-07-21 | 13F | Rainey & Randall Investment Management Inc. | 6 942 | 1,09 | 330 | 9,67 | ||||
| 2025-08-12 | 13F | Zacks Investment Management | 40 419 | 10,68 | 1 919 | 20,18 | ||||
| 2025-08-07 | 13F | CENTRAL TRUST Co | 1 795 | 0,00 | 85 | 8,97 | ||||
| 2025-07-21 | 13F | Washington Growth Strategies Llc | 14 882 | 33 722,73 | 1 | |||||
| 2025-08-14 | 13F | Barometer Capital Management Inc. | 6 400 | −27,27 | 304 | −21,09 | ||||
| 2025-08-06 | 13F | AE Wealth Management LLC | 371 | 0,00 | 18 | 6,25 | ||||
| 2025-08-14 | 13F | JPL Wealth Management, LLC | 24 255 | 7,90 | 1 151 | 17,21 | ||||
| 2025-08-18 | 13F | Wolverine Trading, Llc | 10 511 | −1,82 | 499 | 7,31 | ||||
| 2025-08-01 | 13F | Envestnet Asset Management Inc | 92 767 | 64,45 | 4 404 | 78,62 | ||||
| 2025-08-11 | 13F | Rothschild Investment Llc | 800 | 0,00 | 38 | 8,82 | ||||
| 2025-08-11 | 13F | HighTower Advisors, LLC | 19 170 | 132,03 | 910 | 151,80 | ||||
| 2025-08-13 | 13F | Hsbc Holdings Plc | 0 | −100,00 | 0 | |||||
| 2025-08-07 | 13F | PCG Wealth Advisors, LLC | 31 579 | −2,43 | 1 499 | 6,01 | ||||
| 2025-08-14 | 13F | BCS Private Wealth Management, Inc. | 4 500 | 0 | ||||||
| 2025-07-22 | 13F | Berkshire Money Management, Inc. | 450 | 21 | ||||||
| 2025-08-13 | 13F | Marshall Wace, Llp | 25 696 | 1 220 | ||||||
| 2025-07-24 | 13F | IFP Advisors, Inc | 10 139 | 46,16 | 481 | 58,75 | ||||
| 2025-05-12 | 13F | Turning Point Benefit Group, Inc. | 0 | −100,00 | 0 | |||||
| 2025-08-08 | 13F | Capital Investment Advisory Services, LLC | 8 500 | 7,59 | 403 | 16,81 | ||||
| 2025-07-14 | 13F | Golden State Equity Partners | 13 022 | −0,17 | 618 | 8,42 | ||||
| 2025-07-29 | 13F | William Blair Investment Management, Llc | 21 000 | 0,00 | 997 | 8,62 | ||||
| 2025-07-30 | 13F | Crewe Advisors LLC | 6 650 | 0,00 | 316 | 8,62 | ||||
| 2025-08-14 | 13F | Ausdal Financial Partners, Inc. | 8 127 | 20,61 | 386 | 30,95 | ||||
| 2025-08-13 | 13F | BCJ Capital Management, LLC | 4 377 | 208 | ||||||
| 2025-07-30 | 13F | Patten Group, Inc. | 0 | −100,00 | 0 | |||||
| 2025-08-13 | 13F | Level Four Advisory Services, Llc | 81 736 | 0,69 | 3 880 | 9,36 | ||||
| 2025-08-14 | 13F | New Vernon Capital Holdings II LLC | 302 875 | −98,64 | 14 377 | 2 724,56 | ||||
| 2025-08-14 | 13F | Summit Trail Advisors, Llc | 244 041 | −1,85 | 11 585 | 6,59 | ||||
| 2025-07-09 | 13F | Leibman Financial Services, Inc. | 126 595 | 0,99 | 6 009 | 9,67 | ||||
| 2025-08-13 | 13F | Northwestern Mutual Wealth Management Co | 422 628 | −6,92 | 20 062 | 1,09 | ||||
| 2025-08-14 | 13F | Fwl Investment Management, Llc | 4 534 | −8,86 | 215 | −0,92 | ||||
| 2025-05-15 | 13F | Modern Wealth Management, LLC | 0 | −100,00 | 0 | −100,00 | ||||
| 2025-07-31 | 13F | Cosner Financial Group, LLC | 8 085 | −1,34 | 384 | 6,98 | ||||
| 2025-08-08 | 13F | Tortoise Investment Management, LLC | 940 | 0,00 | 45 | 7,32 | ||||
| 2025-07-18 | 13F | Bartlett & Co. Wealth Management Llc | 4 100 | 0,00 | 195 | 8,38 | ||||
| 2025-08-14 | 13F | Wells Fargo & Company/mn | 897 060 | 4,78 | 42 583 | 13,80 | ||||
| 2025-07-28 | 13F | Mutual Advisors, LLC | 10 329 | −0,21 | 473 | 1,94 | ||||
| 2025-08-11 | 13F | Bulltick Wealth Management, LLC | 160 345 | 0,00 | 7 612 | 8,60 | ||||
| 2025-05-14 | 13F | Per Stirling Capital Management, LLC. | 0 | −100,00 | 0 |
Other Listings
| MX:EPI |