Grundläggande statistik
| Institutionella ägare | 255 total, 255 long only, 0 short only, 0 long/short - change of 6,69% MRQ |
| Genomsnittlig portföljallokering | 0.4635 % - change of −6,83% MRQ |
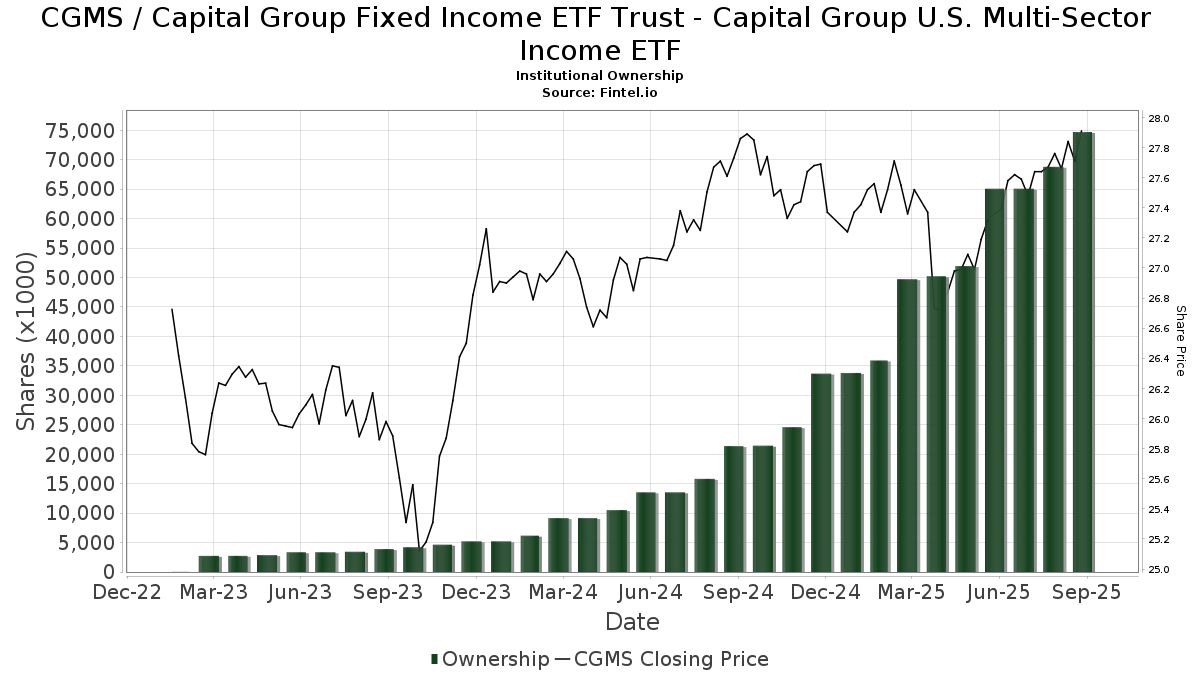
| Institutionella aktier (lång) | 74 715 451 (ex 13D/G) - change of 9,63MM shares 14,80% MRQ |
| Institutionellt värde (lång) | $ 1 885 679 USD ($1000) |
Institutionellt ägande och aktieägare
Capital Group Fixed Income ETF Trust - Capital Group U.S. Multi-Sector Income ETF (US:CGMS) har 255 Institutionella ägare och aktieägare som har lämnat in 13D/G- eller 13F-formulär till Securities Exchange Commission (SEC). Dessa institut innehar totalt 74,715,451 aktier. Största aktieägare inkluderar LPL Financial LLC, Morgan Stanley, Envestnet Asset Management Inc, Raymond James Financial Inc, Wells Fargo & Company/mn, Cetera Investment Advisers, Commonwealth Equity Services, Llc, UBS Group AG, Great Valley Advisor Group, Inc., and Capital Advantage, Inc. .
Capital Group Fixed Income ETF Trust - Capital Group U.S. Multi-Sector Income ETF (ARCA:CGMS) Institutionell ägarstruktur visar institutioners och fonders nuvarande positioner i företaget, samt de senaste förändringarna i positionernas storlek. Större aktieägare kan vara enskilda investerare, fonder, hedgefonder eller institutioner. Bilaga 13D visar att investeraren äger (eller ägde) mer än 5% av företaget och avser (eller avsåg) att aktivt eftersträva en förändring av affärsstrategin. Schedule 13G indikerar en passiv investering på över 5%.
The share price as of September 10, 2025 is 27,91 / share. Previously, on September 11, 2024, the share price was 27,73 / share. This represents an increase of 0,65% over that period.
Fondsentimentets poäng
Fondsentimentet poängen(fka Ägarackumulation-poäng) visar vilka aktier som är mest köpta av fonder. Det är resultatet av en sofistikerad kvantitativ flerfaktormodell som identifierar företag med de högsta nivåerna av institutionell ackumulering. Poängsättningsmodellen använder en kombination av den totala ökningen av redovisade ägare, förändringarna i portföljallokeringarna för dessa ägare och andra mått. Siffran sträcker sig från 0 till 100, där högre siffror indikerar en högre nivå av ackumulering i förhållande till sina konkurrenter, och 50 är genomsnittet.
Uppdateringsfrekvens: Dagligen
Se Ownership Explorer, som innehåller en lista över de högst rankade företagen.
Institutionell sälj/köp-kvot
Förutom att rapportera vanliga eget kapital- och skuldemissioner måste institutioner med mer än 100MM tillgångar under förvaltning också avslöja sina innehav av sälj- och köpoptioner. Eftersom säljoptioner i allmänhet indikerar ett negativt sentiment och köpoptioner indikerar ett positivt sentiment, kan vi få en uppfattning om det övergripande institutionella sentimentet genom att plotta förhållandet mellan säljoptioner och köpoptioner. Diagrammet till höger visar det historiska förhållandet mellan sälj- och köpoptioner för detta instrument.
Genom att använda sälj/köp-kvoten som en indikator på aktieägarnas sentiment undviker man en av de största bristerna med att använda det totala institutionella ägandet, nämligen att en betydande del av de förvaltade tillgångarna investeras passivt för att följa index. Passivt förvaltade fonder köper vanligtvis inte optioner, så indikatorn för sälj/köp-kvoten ger en bättre bild av stämningen i aktivt förvaltade fonder.
13F- och NPORT-arkiveringar
Detaljer om 13F-arkiveringar är gratis. Detaljer om NP-arkiveringar kräver ett premiummedlemskap. Gröna rader indikerar nya positioner. Röda rader indikerar stängda positioner. Klicka på länk symbolen för att se hela transaktionshistoriken.
Uppgradera
för att låsa upp premiumdata och exportera till Excel ![]() .
.
| Fil Datum | Källa | Investerare | Typ | Genomsnittligt pris (beräknat) |
Aktier | Δ Aktier (%) |
Rapporterat värde (1000 USD) |
Δ Värde (%) |
Portföljallokering (%) |
|
|---|---|---|---|---|---|---|---|---|---|---|
| 2025-08-12 | 13F | Financial Advocates Investment Management | 16 977 | −4,79 | 469 | −3,70 | ||||
| 2025-07-10 | 13F | Redhawk Wealth Advisors, Inc. | 576 569 | −0,89 | 15 925 | 0,27 | ||||
| 2025-08-12 | 13F | Global Retirement Partners, LLC | 85 299 | 306,42 | 2 356 | 311,71 | ||||
| 2025-07-11 | 13F | Bouvel Investment Partners, LLC | 219 457 | 1,42 | 6 061 | 0,63 | ||||
| 2025-07-14 | 13F | McGlone Suttner Wealth Management, Inc. | 16 579 | −5,66 | 458 | −4,59 | ||||
| 2025-08-11 | 13F | Rothschild Investment Llc | 96 350 | 10,94 | 2 661 | 12,23 | ||||
| 2025-07-16 | 13F | Novem Group | 114 748 | 2,79 | 3 169 | 4,00 | ||||
| 2025-08-05 | 13F | Fullcircle Wealth Llc | 130 658 | 3,73 | 3 609 | 5,37 | ||||
| 2025-07-29 | 13F | Signature Estate & Investment Advisors Llc | 28 749 | 794 | ||||||
| 2025-07-02 | 13F | Crumly & Associates Inc. | 203 641 | 9,28 | 5 625 | 10,56 | ||||
| 2025-07-18 | 13F | Cooper Financial Group | 12 894 | 1,41 | 356 | 2,59 | ||||
| 2025-08-11 | 13F | Private Advisor Group, LLC | 486 797 | −6,24 | 13 445 | −5,14 | ||||
| 2025-05-12 | 13F | Fmr Llc | 0 | −100,00 | 0 | |||||
| 2025-08-11 | 13F | Hexagon Capital Partners LLC | 0 | −100,00 | 0 | |||||
| 2025-08-14 | 13F | UBS Group AG | 2 362 552 | 11,62 | 65 254 | 12,92 | ||||
| 2025-07-23 | 13F | Cannon Wealth Management Services, LLC | 35 257 | −3,01 | 974 | −0,82 | ||||
| 2025-07-11 | 13F | Bond & Devick Financial Network, Inc. | 237 164 | 3,14 | 6 550 | 4,35 | ||||
| 2025-07-22 | 13F | Wealthcare Advisory Partners LLC | 22 884 | 4,46 | 632 | 5,69 | ||||
| 2025-07-29 | 13F | Koshinski Asset Management, Inc. | 40 026 | 4,52 | 1 106 | 5,74 | ||||
| 2025-08-11 | 13F | Principal Securities, Inc. | 23 623 | 59,25 | 652 | 61,39 | ||||
| 2025-07-25 | 13F | Envestnet Portfolio Solutions, Inc. | 49 223 | −67,98 | 1 360 | −67,61 | ||||
| 2025-08-12 | 13F | Jpmorgan Chase & Co | 90 195 | 0,02 | 2 491 | 1,22 | ||||
| 2025-07-23 | 13F | WESPAC Advisors, LLC | 32 239 | 15,51 | 890 | 16,95 | ||||
| 2025-07-16 | 13F | Strategic Investment Solutions, Inc. /IL | 6 472 | 0,00 | 179 | 1,14 | ||||
| 2025-07-29 | 13F | Burford Brothers, Inc. | 33 930 | −3,38 | 937 | −2,19 | ||||
| 2025-08-15 | 13F | Morgan Stanley | 5 604 101 | −5,85 | 154 785 | −4,74 | ||||
| 2025-07-22 | 13F | Merit Financial Group, LLC | 148 581 | 197,78 | 4 104 | 201,25 | ||||
| 2025-04-25 | 13F | Avidian Wealth Solutions, LLC | 0 | −100,00 | 0 | |||||
| 2025-08-12 | 13F | Lodestone Wealth Management LLC | 75 951 | 0,81 | 2 098 | 1,99 | ||||
| 2025-08-13 | 13F | Beacon Pointe Advisors, LLC | 428 134 | 11 825 | ||||||
| 2025-08-11 | 13F | Advisor Resource Council | 0 | −100,00 | 0 | |||||
| 2025-07-11 | 13F | Capital Advantage, Inc. | 2 108 316 | 58 232 | ||||||
| 2025-07-28 | 13F | Sagespring Wealth Partners, Llc | 7 400 | 204 | ||||||
| 2025-08-11 | 13F | Perennial Investment Advisors, LLC | 82 144 | 58,25 | 2 269 | 60,06 | ||||
| 2025-07-29 | 13F | Balboa Wealth Partners | 12 024 | 22,05 | 332 | 23,88 | ||||
| 2025-08-04 | 13F | Arkadios Wealth Advisors | 13 052 | 8,01 | 360 | 9,42 | ||||
| 2025-08-14 | 13F | GWM Advisors LLC | 148 965 | 85,09 | 4 114 | 87,26 | ||||
| 2025-07-22 | 13F | DAVENPORT & Co LLC | 114 237 | 7,55 | 3 155 | 8,83 | ||||
| 2025-07-17 | 13F | KWB Wealth | 100 577 | −40,62 | 2 746 | −40,58 | ||||
| 2025-07-21 | 13F | Capital Planning LLC | 0 | −100,00 | 0 | |||||
| 2025-08-12 | 13F | AlphaCore Capital LLC | 40 380 | −0,22 | 1 115 | 1,00 | ||||
| 2025-08-14 | 13F | Clg Llc | 47 423 | 7,38 | 1 310 | 8,63 | ||||
| 2025-08-14 | 13F | Royal Bank Of Canada | 871 108 | 13,94 | 24 060 | 15,28 | ||||
| 2025-05-08 | 13F | HHM Wealth Advisors, LLC | 0 | −100,00 | 0 | |||||
| 2025-08-14 | 13F | Gotham Asset Management, LLC | 29 430 | 813 | ||||||
| 2025-08-14 | 13F | Wiley Bros.-aintree Capital, Llc | 200 142 | 56,53 | 5 543 | 58,46 | ||||
| 2025-07-10 | 13F | Kmg Fiduciary Partners, Llc | 355 666 | 11,76 | 9 824 | 13,06 | ||||
| 2025-08-08 | 13F | Kingsview Wealth Management, LLC | 251 692 | 19,90 | 6 952 | 21,31 | ||||
| 2025-04-21 | 13F | Ronald Blue Trust, Inc. | 0 | −100,00 | 0 | −100,00 | ||||
| 2025-07-14 | 13F | Main Line Retirement Advisors, LLC | 312 403 | 4,52 | 8 629 | 5,75 | ||||
| 2025-07-25 | 13F | Atria Wealth Solutions, Inc. | 354 998 | −33,64 | 9 806 | −33,14 | ||||
| 2025-07-30 | 13F | TFB Advisors LLC | 7 502 | 207 | ||||||
| 2025-07-31 | 13F | Trademark Financial Management, LLC | 8 419 | −48,34 | 233 | −47,75 | ||||
| 2025-08-18 | 13F/A | Kestra Investment Management, LLC | 59 114 | 20,92 | 1 633 | 22,34 | ||||
| 2025-08-11 | 13F | Aptus Capital Advisors, LLC | 3 223 | 1,42 | 89 | 3,49 | ||||
| 2025-07-31 | 13F | CAP Partners, LLC | 22 091 | 2,24 | 610 | 3,57 | ||||
| 2025-08-14 | 13F | Great Valley Advisor Group, Inc. | 2 150 804 | 4,87 | 59 406 | 6,10 | ||||
| 2025-08-27 | 13F/A | Brinker Capital Investments, LLC | 34 432 | 53,17 | 951 | 55,14 | ||||
| 2025-08-04 | 13F | Bridgewealth Advisory Group, LLC | 17 007 | 470 | ||||||
| 2025-07-21 | 13F | Patriot Financial Group Insurance Agency, LLC | 107 461 | 1,97 | 2 968 | 3,16 | ||||
| 2025-07-21 | 13F | Investment Planning Advisors, Inc. | 17 838 | −34,91 | 493 | −34,22 | ||||
| 2025-08-14 | 13F | Goldman Sachs Group Inc | 331 757 | 9 163 | ||||||
| 2025-04-21 | 13F | Bay Colony Advisory Group, Inc d/b/a Bay Colony Advisors | 0 | −100,00 | 0 | −100,00 | ||||
| 2025-07-16 | 13F | Midwest Heritage Bank, FSB | 10 871 | 34,16 | 300 | 35,75 | ||||
| 2025-08-11 | 13F | Synergy Investment Management, LLC | 0 | −100,00 | 0 | |||||
| 2025-08-11 | 13F | Western Wealth Management, LLC | 7 628 | −0,27 | 211 | 0,96 | ||||
| 2025-08-12 | 13F | Wayfinding Financial, LLC | 105 248 | −1,52 | 3 | 0,00 | ||||
| 2025-08-13 | 13F | Baird Financial Group, Inc. | 689 032 | 1,50 | 19 031 | 2,69 | ||||
| 2025-07-07 | 13F | Thurston, Springer, Miller, Herd & Titak, Inc. | 5 005 | 88,65 | 138 | 91,67 | ||||
| 2025-08-14 | 13F | Benjamin Edwards Inc | 398 486 | 4,55 | 11 006 | 5,78 | ||||
| 2025-08-06 | 13F | Golden State Wealth Management, LLC | 0 | −100,00 | 0 | −100,00 | ||||
| 2025-08-12 | 13F | Steward Partners Investment Advisory, Llc | 20 444 | 7,76 | 565 | 9,09 | ||||
| 2025-07-23 | 13F | Clear Creek Financial Management, LLC | 13 122 | −0,76 | 362 | 0,56 | ||||
| 2025-07-24 | 13F | IFP Advisors, Inc | 4 091 | 38,26 | 113 | 41,25 | ||||
| 2025-08-14 | 13F | Raymond James Financial Inc | 3 978 724 | −0,66 | 109 892 | 0,50 | ||||
| 2025-08-14 | 13F | Sunbelt Securities, Inc. | 237 062 | −9,91 | 6 467 | −9,97 | ||||
| 2025-08-12 | 13F | Marshall & Sterling Wealth Advisors Inc. | 584 | 12,09 | 16 | 14,29 | ||||
| 2025-08-05 | 13F | Mission Wealth Management, Lp | 70 190 | 28,90 | 1 939 | 30,42 | ||||
| 2025-08-14 | 13F | Jane Street Group, Llc | 118 193 | −80,05 | 3 264 | −79,82 | ||||
| 2025-07-16 | 13F | St Germain D J Co Inc | 347 002 | 0,77 | 9 584 | 1,95 | ||||
| 2025-07-24 | 13F | MSH Capital Advisors LLC | 17 791 | 35,46 | 491 | 37,15 | ||||
| 2025-08-14 | 13F | Mariner, LLC | 741 908 | 2,65 | 20 491 | 3,86 | ||||
| 2025-08-08 | 13F | Cetera Investment Advisers | 2 690 563 | 18,97 | 74 313 | 20,37 | ||||
| 2025-08-12 | 13F | J.w. Cole Advisors, Inc. | 36 137 | 8,00 | 998 | 9,31 | ||||
| 2025-08-08 | 13F | Security Financial Services, INC. | 7 471 | 206 | ||||||
| 2025-07-10 | 13F | Wealth Enhancement Advisory Services, Llc | 1 825 546 | 0,40 | 50 403 | 1,54 | ||||
| 2025-07-18 | 13F | Trilogy Capital Inc. | 58 706 | 3,04 | 1 621 | 4,24 | ||||
| 2025-07-16 | 13F | Freestate Advisors LLC | 10 068 | 278 | ||||||
| 2025-08-14 | 13F | Susquehanna International Group, Llp | 56 107 | 1 550 | ||||||
| 2025-08-13 | 13F | Continuum Advisory, LLC | 16 348 | 9,17 | 452 | 10,54 | ||||
| 2025-08-06 | 13F | Prospera Financial Services Inc | 525 656 | −0,67 | 14 519 | 0,50 | ||||
| 2025-08-14 | 13F | Bank Of America Corp /de/ | 0 | −100,00 | 0 | |||||
| 2025-05-09 | 13F | GeoWealth Management, LLC | 0 | −100,00 | 0 | |||||
| 2025-08-13 | 13F | Milestone Investment Advisors LLC | 22 976 | −11,13 | 635 | −10,07 | ||||
| 2025-07-11 | 13F | Farther Finance Advisors, LLC | 8 244 | 174,80 | 228 | 180,25 | ||||
| 2025-08-13 | 13F | Level Four Advisory Services, Llc | 147 583 | 24,98 | 4 076 | 26,47 | ||||
| 2025-07-17 | 13F | Janney Montgomery Scott LLC | 145 898 | 19,74 | 4 | 33,33 | ||||
| 2025-08-05 | 13F | Bank of New York Mellon Corp | 8 032 | 222 | ||||||
| 2025-08-12 | 13F | Calton & Associates, Inc. | 26 589 | 22,07 | 734 | 23,57 | ||||
| 2025-07-23 | 13F | Element Wealth, LLC | 50 022 | 18,45 | 1 382 | 19,88 | ||||
| 2025-08-14 | 13F | Old Mission Capital Llc | 37 367 | −77,84 | 1 032 | −77,58 | ||||
| 2025-08-05 | 13F | Aurdan Capital Management, LLC | 17 571 | 4,75 | 485 | 6,13 | ||||
| 2025-07-21 | 13F | Ameritas Advisory Services, LLC | 42 157 | −7,93 | 1 164 | −6,81 | ||||
| 2025-07-28 | 13F | Rosenberg Matthew Hamilton | 825 | 1 061,97 | 23 | 2 100,00 | ||||
| 2025-08-18 | 13F | Wellington Capital Management, Inc. | 74 041 | 1 | ||||||
| 2025-07-31 | 13F | Cambridge Investment Research Advisors, Inc. | 1 332 030 | 14,62 | 37 | 16,13 | ||||
| 2025-05-12 | 13F | Founders Financial Securities Llc | 0 | −100,00 | 0 | |||||
| 2025-08-15 | 13F | Equitable Holdings, Inc. | 113 391 | 37,70 | 3 132 | 39,28 | ||||
| 2025-08-13 | 13F | Capital Group Private Client Services, Inc. | 407 629 | 391,42 | 11 259 | 397,26 | ||||
| 2025-07-14 | 13F | AdvisorNet Financial, Inc | 4 551 | 67,62 | 126 | 68,92 | ||||
| 2025-07-24 | 13F | Von Berge Wealth Management Group, LLC | 63 478 | 44,27 | 1 756 | 47,48 | ||||
| 2025-08-08 | 13F | Larson Financial Group LLC | 5 727 | 118,50 | 158 | 122,54 | ||||
| 2025-08-13 | 13F | Capital Analysts, Inc. | 1 835 | 0 | ||||||
| 2025-07-16 | 13F | Swisher Financial Concepts, Inc. | 220 873 | −2,59 | 6 101 | −1,45 | ||||
| 2025-04-23 | 13F | VisionPoint Advisory Group, LLC | 0 | −100,00 | 0 | |||||
| 2025-08-14 | 13F | Wells Fargo & Company/mn | 2 779 290 | 13,13 | 76 764 | 14,46 | ||||
| 2025-08-04 | 13F | Creekmur Asset Management LLC | 266 691 | 7 366 | ||||||
| 2025-08-14 | 13F | IHT Wealth Management, LLC | 8 332 | 230 | ||||||
| 2025-07-17 | 13F | LifeGoal Wealth Advisors | 36 160 | −74,56 | 999 | −74,28 | ||||
| 2025-05-02 | 13F | Capital A Wealth Management, LLC | 834 | −7,44 | 23 | −8,33 | ||||
| 2025-08-05 | 13F | 5T Wealth, LLC | 75 557 | −1,14 | 2 087 | 0,00 | ||||
| 2025-07-09 | 13F | Pines Wealth Management, LLC | 28 921 | 20,73 | 799 | 26,47 | ||||
| 2025-07-28 | 13F | Eq Wealth Advisors, Llc | 483 678 | 13,86 | 13 359 | 15,20 | ||||
| 2025-08-12 | 13F | LPL Financial LLC | 9 943 155 | 21,63 | 274 630 | 23,05 | ||||
| 2025-07-10 | 13F | Sharkey, Howes & Javer | 60 723 | −25,12 | 1 677 | −24,22 | ||||
| 2025-08-06 | 13F | Blue Investment Partners LLC | 0 | −100,00 | 0 | |||||
| 2025-08-14 | 13F | Integrated Wealth Concepts LLC | 204 377 | 8,93 | 5 645 | 10,19 | ||||
| 2025-07-31 | 13F | Turning Point Benefit Group, Inc. | 107 849 | −19,00 | 2 979 | −15,83 | ||||
| 2025-08-04 | 13F | IFG Advisory, LLC | 15 213 | 84,29 | 420 | 86,67 | ||||
| 2025-07-07 | 13F | TruWealth Advisors, LLC | 697 947 | 14,22 | 19 277 | 15,56 | ||||
| 2025-07-25 | 13F | Concurrent Investment Advisors, LLC | 188 553 | 21,57 | 5 208 | 22,98 | ||||
| 2025-08-04 | 13F | Creative Financial Designs Inc /adv | 239 126 | −28,67 | 6 605 | −27,84 | ||||
| 2025-08-14 | 13F | Gerber Kawasaki Wealth & Investment Management | 10 494 | −22,35 | 290 | −21,47 | ||||
| 2025-08-14 | 13F | Federation des caisses Desjardins du Quebec | 700 | −72,00 | 19 | −72,06 | ||||
| 2025-08-13 | 13F | Flow Traders U.s. Llc | 0 | −100,00 | 0 | |||||
| 2025-08-04 | 13F | Impact Partnership Wealth, LLC | 18 676 | 516 | ||||||
| 2025-07-16 | 13F | ORG Partners LLC | 7 610 | 409,37 | 210 | 425,00 | ||||
| 2025-07-29 | 13F | Stephens Inc /ar/ | 643 841 | 8,66 | 17 783 | 9,94 | ||||
| 2025-08-14 | 13F | Modern Wealth Management, LLC | 13 250 | 14,64 | 366 | 15,87 | ||||
| 2025-08-12 | 13F | Proequities, Inc. | 0 | 0 | ||||||
| 2025-07-30 | 13F | Financial Perspectives, Inc | 1 853 | 59,60 | 51 | 64,52 | ||||
| 2025-09-04 | 13F/A | Advisor Group Holdings, Inc. | 1 768 762 | 30,24 | 48 855 | 31,77 | ||||
| 2025-07-17 | 13F | Venture Visionary Partners LLC | 12 612 | 348 | ||||||
| 2025-07-21 | 13F | DHJJ Financial Advisors, Ltd. | 70 | 0,00 | 2 | 0,00 | ||||
| 2025-07-09 | 13F | WealthCare Investment Partners, LLC | 20 287 | −2,77 | 560 | 0,72 | ||||
| 2025-07-23 | 13F | Seamount Financial Group Inc | 58 366 | 4,03 | 1 612 | 5,29 | ||||
| 2025-07-11 | 13F | AA Financial Advisors, LLC | 9 906 | 0,00 | 274 | 1,11 | ||||
| 2025-07-31 | 13F | Moloney Securities Asset Management, LLC | 10 960 | −63,35 | 303 | −62,99 | ||||
| 2025-08-07 | 13F | Winch Advisory Services, LLC | 741 436 | 1,17 | 20 478 | 2,35 | ||||
| 2025-07-30 | 13F | Onyx Bridge Wealth Group LLC | 389 717 | 87,31 | 10 764 | 89,49 | ||||
| 2025-07-24 | 13F | Us Bancorp \de\ | 5 229 | 0,00 | 144 | 1,41 | ||||
| 2025-07-23 | 13F | Prime Capital Investment Advisors, LLC | 43 800 | −53,93 | 1 210 | −53,41 | ||||
| 2025-08-15 | 13F | Kestra Advisory Services, LLC | 360 665 | 20,05 | 9 962 | 21,46 | ||||
| 2025-08-14 | 13F | Colony Group, LLC | 36 019 | −6,20 | 995 | −5,15 | ||||
| 2025-07-24 | 13F | MFA Wealth Services | 69 744 | 4,63 | 1 926 | 5,88 | ||||
| 2025-08-14 | 13F | Citadel Advisors Llc | 66 928 | −72,54 | 1 849 | −72,23 | ||||
| 2025-08-01 | 13F | Rossby Financial, LCC | 478 | 13 | ||||||
| 2025-08-04 | 13F | Atria Investments Llc | 418 117 | −10,40 | 11 548 | −9,35 | ||||
| 2025-08-11 | 13F | Inspire Advisors, LLC | 57 332 | 1,96 | 1 584 | 3,13 | ||||
| 2025-07-22 | 13F | Oak Hill Wealth Advisors, Llc | 51 123 | 1 406 | ||||||
| 2025-07-17 | 13F | Tempus Wealth Planning, LLC | 24 845 | 1,76 | 686 | 3,00 | ||||
| 2025-07-11 | 13F | LongView Wealth Management | 84 352 | 26,45 | 2 330 | 27,90 | ||||
| 2025-05-15 | 13F | MAI Capital Management | 0 | −100,00 | 0 | |||||
| 2025-07-14 | 13F | Armstrong Advisory Group, Inc | 0 | −100,00 | 0 | |||||
| 2025-08-15 | 13F | Lantern Wealth Advisors, LLC | 10 059 | 278 | ||||||
| 2025-07-30 | 13F | Eqis Capital Management, Inc. | 0 | −100,00 | 0 | |||||
| 2025-08-13 | 13F | RPg Family Wealth Advisory, LLC | 140 717 | 3 887 | ||||||
| 2025-08-18 | 13F | Geneos Wealth Management Inc. | 22 070 | 43,08 | 610 | 44,66 | ||||
| 2025-08-12 | 13F | Barnes Pettey Financial Advisors, Llc | 16 250 | 16,05 | 449 | 17,28 | ||||
| 2025-07-30 | 13F | Klingman & Associates, LLC | 12 381 | 0,00 | 342 | 0,89 | ||||
| 2025-08-12 | 13F | Wealth Advisors of Iowa, LLC | 16 918 | −16,47 | 467 | −15,40 | ||||
| 2025-08-14 | 13F | Mercer Global Advisors Inc /adv | 14 646 | −69,58 | 405 | −69,25 | ||||
| 2025-08-12 | 13F | BlueStem Wealth Partners, LLC | 747 841 | 6,05 | 20 655 | 7,30 | ||||
| 2025-07-09 | 13F | Dynamic Advisor Solutions LLC | 141 617 | 12,10 | 3 911 | 13,43 | ||||
| 2025-07-29 | 13F | Carmel Capital Partners, LLC | 215 493 | 8,74 | 5 952 | 10,02 | ||||
| 2025-07-25 | 13F | Apollon Wealth Management, LLC | 55 424 | −6,50 | 1 531 | −5,44 | ||||
| 2025-08-08 | 13F | Thoroughbred Financial Services, Llc | 38 744 | −19,17 | 1 | 0,00 | ||||
| 2025-08-15 | 13F | Captrust Financial Advisors | 52 367 | 0,51 | 1 446 | 1,69 | ||||
| 2025-07-15 | 13F | Hartmann Taylor Wealth Management, LLC | 89 293 | −35,08 | 2 466 | −34,31 | ||||
| 2025-08-13 | 13F | Renaissance Technologies Llc | 177 100 | 56,25 | 4 892 | 58,08 | ||||
| 2025-08-04 | 13F | Spire Wealth Management | 13 870 | 0,27 | 383 | 1,59 | ||||
| 2025-07-15 | 13F | Regatta Capital Group, Llc | 10 245 | 283 | ||||||
| 2025-08-07 | 13F | Kestra Private Wealth Services, Llc | 18 169 | −16,00 | 502 | −15,08 | ||||
| 2025-07-22 | 13F | Beacon Financial Advisory LLC | 11 150 | 0,70 | 308 | 1,66 | ||||
| 2025-07-03 | 13F | TrueWealth Advisors, LLC | 779 709 | 6,32 | 21 536 | 7,57 | ||||
| 2025-08-07 | 13F | PFG Advisors | 30 400 | 1,64 | 840 | 2,82 | ||||
| 2025-08-12 | 13F | Tradition Wealth Management, LLC | 11 400 | −0,87 | 315 | 0,32 | ||||
| 2025-08-14 | 13F/A | Rockefeller Capital Management L.P. | 288 712 | 7 974 | ||||||
| 2025-08-11 | 13F | HighTower Advisors, LLC | 17 001 | 52,01 | 470 | 53,77 | ||||
| 2025-08-13 | 13F | Strategic Family Wealth Counselors, L.L.C. | 183 258 | 17,43 | 5 062 | 18,80 | ||||
| 2025-08-06 | 13F | Souders Financial Advisors | 332 556 | 6,79 | 9 185 | 8,05 | ||||
| 2025-07-11 | 13F | SILVER OAK SECURITIES, Inc | 177 141 | 4,95 | 4 893 | 6,16 | ||||
| 2025-08-01 | 13F | Brookwood Investment Group LLC | 14 070 | 1,04 | 389 | 2,11 | ||||
| 2025-04-22 | 13F | RFP Financial Group LLC | 0 | −100,00 | 0 | |||||
| 2025-07-29 | 13F | DeDora Capital, Inc. | 43 161 | −90,54 | 1 192 | −90,43 | ||||
| 2025-07-28 | 13F | RFG Advisory, LLC | 10 106 | −71,09 | 279 | −70,75 | ||||
| 2025-07-28 | 13F | Harbour Investments, Inc. | 271 768 | 4,41 | 7 506 | 5,63 | ||||
| 2025-07-22 | 13F | Olistico Wealth, LLC | 1 947 | 18,86 | 54 | 20,45 | ||||
| 2025-07-30 | 13F | Cullen/frost Bankers, Inc. | 121 889 | 28,84 | 3 367 | 30,36 | ||||
| 2025-08-11 | 13F | Nations Financial Group Inc, /ia/ /adv | 33 465 | 7,83 | 924 | 9,09 | ||||
| 2025-07-25 | 13F | Transcendent Capital Group LLC | 69 788 | 3,25 | 1 928 | 4,44 | ||||
| 2025-07-14 | 13F | Opal Wealth Advisors, LLC | 7 336 | 0,81 | 203 | 2,02 | ||||
| 2025-08-04 | 13F | Pensionmark Financial Group, Llc | 18 189 | 17,05 | 502 | 18,40 | ||||
| 2025-08-13 | 13F | Capital International Investors | 122 892 | 33,73 | 3 394 | 35,33 | ||||
| 2025-08-14 | 13F | CoreCap Advisors, LLC | 6 779 | −87,27 | 187 | −87,13 | ||||
| 2025-05-12 | 13F | Independent Advisor Alliance | 0 | −100,00 | 0 | |||||
| 2025-08-05 | 13F | GPS Wealth Strategies Group, LLC | 14 990 | −1,64 | 414 | −0,48 | ||||
| 2025-09-09 | 13F | NWF Advisory Services Inc. | 176 937 | −1,02 | 4 887 | 0,14 | ||||
| 2025-08-12 | 13F | OneAscent Financial Services LLC | 104 656 | −22,38 | 3 | −33,33 | ||||
| 2025-08-04 | 13F | Integrity Alliance, Llc. | 0 | −100,00 | 0 | |||||
| 2025-08-13 | 13F | Argyle Capital Partners, LLC | 28 240 | 29,00 | 780 | 30,49 | ||||
| 2025-08-14 | 13F | Comerica Bank | 15 348 | 23,36 | 424 | 24,78 | ||||
| 2025-08-14 | 13F | Smartleaf Asset Management LLC | 424 123 | 7,88 | 11 663 | 8,66 | ||||
| 2025-07-23 | 13F | Valmark Advisers, Inc. | 514 219 | 13,85 | 14 203 | 15,19 | ||||
| 2025-08-14 | 13F | Keystone Financial Services, LLC | 113 482 | 4,40 | 3 134 | 5,63 | ||||
| 2025-07-30 | 13F | Bleakley Financial Group, LLC | 10 325 | −15,18 | 285 | −14,16 | ||||
| 2025-08-05 | 13F | Bank Of Montreal /can/ | 9 300 | 18,47 | 257 | 19,63 | ||||
| 2025-07-08 | 13F | Nbc Securities, Inc. | 1 230 | 0,00 | 0 | |||||
| 2025-08-04 | 13F | Assetmark, Inc | 256 056 | 5 070,76 | 7 072 | 5 138,52 | ||||
| 2025-07-14 | 13F | Oliver Luxxe Assets LLC | 0 | −100,00 | 0 | |||||
| 2025-08-04 | 13F | Waterfront Wealth Inc. | 26 632 | −0,07 | 736 | 1,10 | ||||
| 2025-08-06 | 13F | Commonwealth Equity Services, Llc | 2 400 798 | 13,21 | 66 | 15,79 | ||||
| 2025-08-06 | 13F | Financial Advisory Corp /ut/ /adv | 52 720 | 5,94 | 1 | 0,00 | ||||
| 2025-08-14 | 13F | Betterment LLC | 320 413 | 1,06 | 9 | 0,00 | ||||
| 2025-08-01 | 13F | Schmidt P J Investment Management Inc | 29 217 | −0,28 | 807 | 0,88 | ||||
| 2025-07-16 | 13F | Owen LaRue, LLC | 33 775 | −1,42 | 933 | −0,32 | ||||
| 2025-08-14 | 13F | Mml Investors Services, Llc | 893 794 | 18,60 | 25 | 20,00 | ||||
| 2025-08-08 | 13F | Good Life Advisors, LLC | 21 898 | −27,21 | 605 | −26,43 | ||||
| 2025-08-19 | 13F | Cape Investment Advisory, Inc. | 503 | 14 | ||||||
| 2025-07-10 | 13F | Sovran Advisors, LLC | 35 353 | −30,58 | 972 | −28,63 | ||||
| 2025-07-31 | 13F | Richards, Merrill & Peterson, Inc. | 46 804 | 43,82 | 1 293 | 45,50 | ||||
| 2025-05-15 | 13F/A | Orion Portfolio Solutions, LLC | 22 480 | 63,42 | 614 | 63,47 | ||||
| 2025-07-11 | 13F | Skyline Advisors, Inc. | 481 421 | 1,77 | 13 297 | 2,96 | ||||
| 2025-07-29 | 13F | Uhlmann Price Securities, Llc | 22 637 | 93,48 | 625 | 95,92 | ||||
| 2025-08-13 | 13F | EverSource Wealth Advisors, LLC | 11 284 | 312 | ||||||
| 2025-08-14 | 13F | Herold Advisors, Inc. | 10 059 | 278 | ||||||
| 2025-05-16 | 13F | American Trust | 0 | −100,00 | 0 | −100,00 | ||||
| 2025-07-14 | 13F | Sowell Financial Services LLC | 112 270 | 140,56 | 3 101 | 143,33 | ||||
| 2025-08-06 | 13F | Wedbush Securities Inc | 32 957 | 13,96 | 1 | |||||
| 2025-07-07 | 13F | Peterson Wealth Advisors, LLC | 25 514 | −1,82 | 705 | 2,03 | ||||
| 2025-07-18 | 13F | Truist Financial Corp | 67 256 | 36,99 | 1 831 | 36,64 | ||||
| 2025-07-22 | 13F | Confluence Wealth Services, Inc. | 216 749 | 0,16 | 5 987 | 3,06 | ||||
| 2025-08-14 | 13F | Ausdal Financial Partners, Inc. | 49 114 | 0,62 | 1 357 | 1,80 | ||||
| 2025-07-25 | 13F | M.e. Allison & Co., Inc. | 25 880 | 71,93 | 715 | 74,15 | ||||
| 2025-08-13 | 13F | Jones Financial Companies Lllp | 840 932 | 18,62 | 23 126 | 19,48 | ||||
| 2025-07-17 | 13F | Centennial Wealth Advisory LLC | 146 061 | 145,86 | 4 030 | 148,55 | ||||
| 2025-07-25 | 13F | Cwm, Llc | 929 285 | 441,89 | 26 | 525,00 | ||||
| 2025-08-12 | 13F | Insigneo Advisory Services, Llc | 10 723 | 0,00 | 296 | 1,37 | ||||
| 2025-08-12 | 13F | Entruity Wealth, LLC | 184 650 | 11,43 | 5 100 | 12,76 | ||||
| 2025-08-14 | 13F | Stifel Financial Corp | 1 240 773 | 25,22 | 34 270 | 26,68 | ||||
| 2025-08-04 | 13F | Cottage Street Advisors LLC | 42 928 | 1,39 | 1 186 | 2,60 | ||||
| 2025-08-13 | 13F | VestGen Advisors, LLC | 302 078 | −0,19 | 8 343 | 0,98 | ||||
| 2025-07-30 | 13F | D.a. Davidson & Co. | 193 473 | 9,08 | 5 344 | 10,35 | ||||
| 2025-08-12 | 13F | SRS Capital Advisors, Inc. | 1 723 | 54,81 | 48 | 56,67 | ||||
| 2025-07-29 | 13F | Stratos Wealth Partners, LTD. | 42 904 | 1 185 | ||||||
| 2025-07-17 | 13F | LexAurum Advisors, LLC | 11 342 | 11,27 | 313 | 12,59 | ||||
| 2025-08-05 | 13F | Sigma Planning Corp | 19 002 | −1,92 | 525 | −0,76 | ||||
| 2025-07-17 | 13F | Johnson Bixby & Associates, LLC | 0 | −100,00 | 0 | |||||
| 2025-07-28 | 13F | Mutual Advisors, LLC | 11 590 | −55,10 | 321 | −54,35 | ||||
| 2025-07-29 | 13F | Private Trust Co Na | 42 543 | 0,00 | 1 175 | 1,21 | ||||
| 2025-05-15 | 13F | Advisory Services Network, LLC | 0 | −100,00 | 0 | |||||
| 2025-07-10 | 13F | SK Wealth Management, LLC | 44 929 | 14,85 | 1 240 | 18,79 | ||||
| 2025-08-04 | 13F | Daymark Wealth Partners, Llc | 28 267 | −2,04 | 781 | −0,89 | ||||
| 2025-08-13 | 13F | Gateway Wealth Partners, LLC | 22 482 | 52,47 | 621 | 54,23 | ||||
| 2025-07-09 | 13F | Fiduciary Alliance LLC | 117 756 | 3 252 | ||||||
| 2025-08-06 | 13F | Mascagni Wealth Management, Inc. | 74 162 | 14,05 | 2 048 | 15,38 | ||||
| 2025-08-13 | 13F | Vermillion & White Wealth Management Group, LLC | 3 329 | 6,46 | 92 | 7,06 | ||||
| 2025-07-24 | 13F | Endeavor Private Wealth, Inc. | 56 640 | 31,35 | 1 564 | 32,88 | ||||
| 2025-07-30 | 13F | Brookstone Capital Management | 16 533 | −5,63 | 457 | −4,60 | ||||
| 2025-08-08 | 13F | Avantax Advisory Services, Inc. | 79 125 | 41,60 | 2 185 | 43,28 | ||||
| 2025-08-12 | 13F | Jacobi Capital Management LLC | 78 638 | 1,51 | 2 172 | 2,70 | ||||
| 2025-08-13 | 13F | Forthright Family Wealth Advisory LLC | 114 201 | −1,44 | 3 154 | −0,28 | ||||
| 2025-07-18 | 13F | Vicus Capital | 259 927 | −12,82 | 7 179 | −11,80 | ||||
| 2025-07-25 | 13F | Total Clarity Wealth Management, Inc. | 105 399 | 9,63 | 2 911 | 11,02 | ||||
| 2025-08-08 | 13F | Pnc Financial Services Group, Inc. | 0 | −100,00 | 0 | |||||
| 2025-08-25 | 13F | Fulcrum Equity Management | 0 | −100,00 | 0 | |||||
| 2025-07-10 | 13F | Global Financial Private Client, LLC | 15 607 | 0,00 | 431 | 1,17 | ||||
| 2025-08-12 | 13F | Cornerstone Wealth Management, LLC | 11 329 | 10,35 | 313 | 11,43 | ||||
| 2025-08-13 | 13F | Northwestern Mutual Wealth Management Co | 654 276 | 111,55 | 18 071 | 114,04 | ||||
| 2025-08-08 | 13F | Capital Investment Advisory Services, LLC | 7 080 | 0,00 | 196 | 1,04 | ||||
| 2025-08-14 | 13F | Snowden Capital Advisors LLC | 18 955 | 6,29 | 524 | 7,61 | ||||
| 2025-08-01 | 13F | Envestnet Asset Management Inc | 4 244 651 | 16,71 | 117 237 | 18,08 | ||||
| 2025-07-17 | 13F | Beacon Capital Management, LLC | 94 | 1,08 | 3 | 0,00 | ||||
| 2025-07-01 | 13F | Kera Capital Partners, Inc. | 12 674 | 0,00 | 350 | 1,16 |