Grundläggande statistik
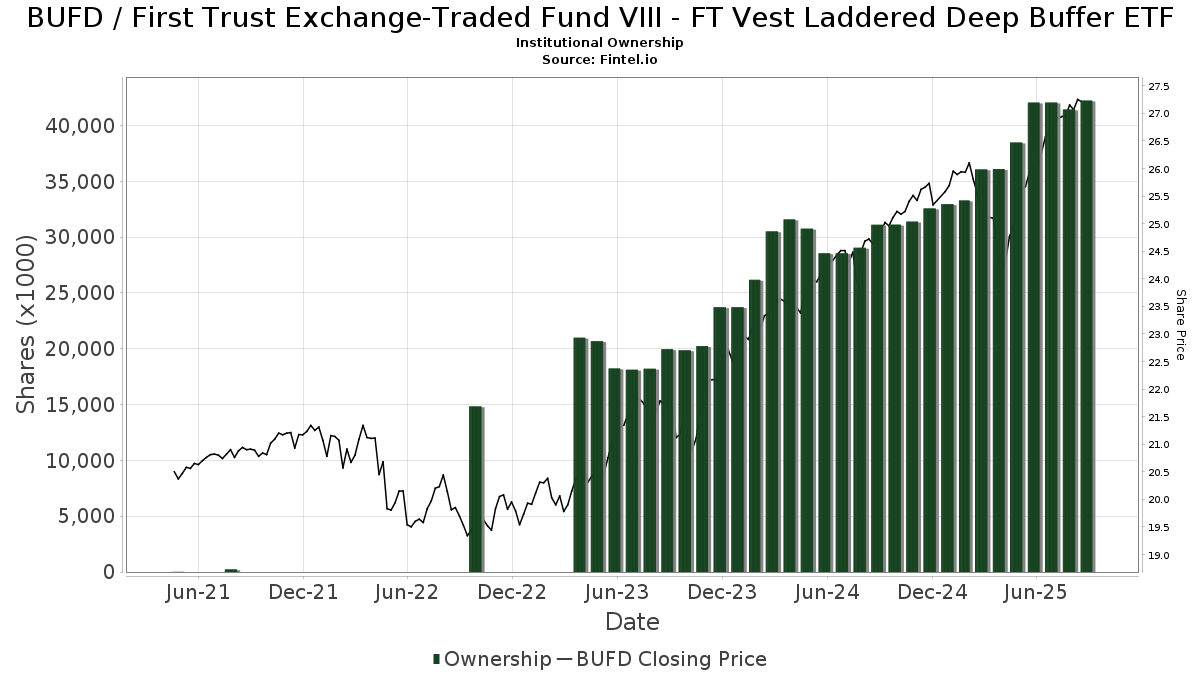
| Institutionella ägare | 170 total, 170 long only, 0 short only, 0 long/short - change of 3,03% MRQ |
| Genomsnittlig portföljallokering | 0.5269 % - change of −6,95% MRQ |
| Institutionella aktier (lång) | 42 232 745 (ex 13D/G) - change of 0,19MM shares 0,46% MRQ |
| Institutionellt värde (lång) | $ 1 047 218 USD ($1000) |
Institutionellt ägande och aktieägare
First Trust Exchange-Traded Fund VIII - FT Vest Laddered Deep Buffer ETF (US:BUFD) har 170 Institutionella ägare och aktieägare som har lämnat in 13D/G- eller 13F-formulär till Securities Exchange Commission (SEC). Dessa institut innehar totalt 42,232,745 aktier. Största aktieägare inkluderar LPL Financial LLC, Gw Henssler & Associates Ltd, Envestnet Asset Management Inc, Legacy Financial Group LLC, Centennial Wealth Advisory LLC, Advisor Group Holdings, Inc., Creekmur Asset Management LLC, Truist Financial Corp, Cetera Investment Advisers, and Commonwealth Equity Services, Llc .
First Trust Exchange-Traded Fund VIII - FT Vest Laddered Deep Buffer ETF (BATS:BUFD) Institutionell ägarstruktur visar institutioners och fonders nuvarande positioner i företaget, samt de senaste förändringarna i positionernas storlek. Större aktieägare kan vara enskilda investerare, fonder, hedgefonder eller institutioner. Bilaga 13D visar att investeraren äger (eller ägde) mer än 5% av företaget och avser (eller avsåg) att aktivt eftersträva en förändring av affärsstrategin. Schedule 13G indikerar en passiv investering på över 5%.
The share price as of September 8, 2025 is 27,31 / share. Previously, on September 9, 2024, the share price was 24,56 / share. This represents an increase of 11,20% over that period.
Fondsentimentets poäng
Fondsentimentet poängen(fka Ägarackumulation-poäng) visar vilka aktier som är mest köpta av fonder. Det är resultatet av en sofistikerad kvantitativ flerfaktormodell som identifierar företag med de högsta nivåerna av institutionell ackumulering. Poängsättningsmodellen använder en kombination av den totala ökningen av redovisade ägare, förändringarna i portföljallokeringarna för dessa ägare och andra mått. Siffran sträcker sig från 0 till 100, där högre siffror indikerar en högre nivå av ackumulering i förhållande till sina konkurrenter, och 50 är genomsnittet.
Uppdateringsfrekvens: Dagligen
Se Ownership Explorer, som innehåller en lista över de högst rankade företagen.
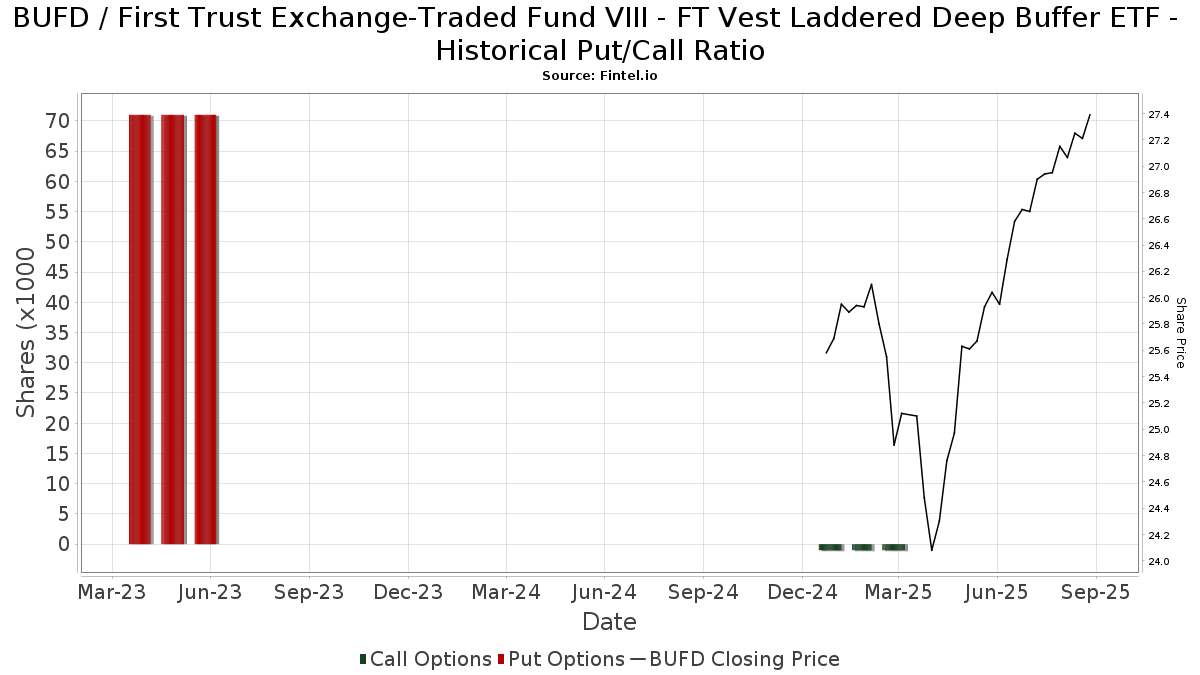
Institutionell sälj/köp-kvot
Förutom att rapportera vanliga eget kapital- och skuldemissioner måste institutioner med mer än 100MM tillgångar under förvaltning också avslöja sina innehav av sälj- och köpoptioner. Eftersom säljoptioner i allmänhet indikerar ett negativt sentiment och köpoptioner indikerar ett positivt sentiment, kan vi få en uppfattning om det övergripande institutionella sentimentet genom att plotta förhållandet mellan säljoptioner och köpoptioner. Diagrammet till höger visar det historiska förhållandet mellan sälj- och köpoptioner för detta instrument.
Genom att använda sälj/köp-kvoten som en indikator på aktieägarnas sentiment undviker man en av de största bristerna med att använda det totala institutionella ägandet, nämligen att en betydande del av de förvaltade tillgångarna investeras passivt för att följa index. Passivt förvaltade fonder köper vanligtvis inte optioner, så indikatorn för sälj/köp-kvoten ger en bättre bild av stämningen i aktivt förvaltade fonder.
13F- och NPORT-arkiveringar
Detaljer om 13F-arkiveringar är gratis. Detaljer om NP-arkiveringar kräver ett premiummedlemskap. Gröna rader indikerar nya positioner. Röda rader indikerar stängda positioner. Klicka på länk symbolen för att se hela transaktionshistoriken.
Uppgradera
för att låsa upp premiumdata och exportera till Excel ![]() .
.
| Fil Datum | Källa | Investerare | Typ | Genomsnittligt pris (beräknat) |
Aktier | Δ Aktier (%) |
Rapporterat värde (1000 USD) |
Δ Värde (%) |
Portföljallokering (%) |
|
|---|---|---|---|---|---|---|---|---|---|---|
| 2025-08-05 | 13F | EPG Wealth Management LLC | Call | 0 | −100,00 | 0 | ||||
| 2025-08-05 | 13F | American Institute for Advanced Investment Management, LLP | 30 572 | −1,98 | 812 | 4,24 | ||||
| 2025-08-13 | 13F | Northwestern Mutual Wealth Management Co | 2 972 | 79 | ||||||
| 2025-07-14 | 13F | Iams Wealth Management, Llc | 46 230 | −61,62 | 1 228 | −59,17 | ||||
| 2025-08-05 | 13F | EPG Wealth Management LLC | 0 | −100,00 | 0 | |||||
| 2025-08-12 | 13F | Cornerstone Wealth Management, LLC | 7 819 | 208 | ||||||
| 2025-07-23 | 13F | GGM Financials LLC | 16 198 | 430 | ||||||
| 2025-08-05 | 13F | C2P Capital Advisory Group, LLC d.b.a. Prosperity Capital Advisors | 25 131 | 667 | ||||||
| 2025-08-08 | 13F | Kingsview Wealth Management, LLC | 81 531 | −0,67 | 2 165 | 5,76 | ||||
| 2025-08-12 | 13F | Jacobi Capital Management LLC | 200 363 | 7,74 | 5 322 | 14,70 | ||||
| 2025-07-11 | 13F | Farther Finance Advisors, LLC | 5 251 | 232,76 | 139 | 256,41 | ||||
| 2025-07-28 | 13F | RFG Advisory, LLC | 17 969 | 48,14 | 477 | 57,95 | ||||
| 2025-07-22 | 13F | Partners Wealth Management, Llc | 18 296 | 0,00 | 457 | 0,00 | ||||
| 2025-08-18 | 13F | N.E.W. Advisory Services LLC | 2 105 | −65,41 | 56 | −63,58 | ||||
| 2025-04-29 | 13F | Resources Investment Advisors, LLC. | 0 | −100,00 | 0 | |||||
| 2025-07-07 | 13F | Schulz Wealth, LTD. | 8 628 | −36,87 | 229 | −32,84 | ||||
| 2025-07-10 | 13F | Wealth Enhancement Advisory Services, Llc | 18 853 | −45,60 | 503 | −41,78 | ||||
| 2025-04-21 | 13F | Nelson, Van Denburg & Campbell Wealth Management Group, LLC | 0 | −100,00 | 0 | |||||
| 2025-08-13 | 13F | StoneX Group Inc. | 53 431 | 236,64 | 1 419 | 258,33 | ||||
| 2025-04-15 | 13F | Integrated Advisors Network LLC | 0 | −100,00 | 0 | |||||
| 2025-08-14 | 13F | Wells Fargo & Company/mn | 58 263 | −12,79 | 1 547 | −7,14 | ||||
| 2025-08-11 | 13F | Summit Wealth Partners, LLC | 8 243 | 0,00 | 219 | 6,34 | ||||
| 2025-07-30 | 13F | Onyx Bridge Wealth Group LLC | 15 100 | 0,00 | 401 | 6,65 | ||||
| 2025-07-16 | 13F | Maridea Wealth Management LLC | 44 119 | 9,73 | 1 172 | 16,75 | ||||
| 2025-08-06 | 13F | AE Wealth Management LLC | 41 523 | −3,81 | 1 103 | 2,32 | ||||
| 2025-07-30 | 13F | Paul Damon & Associates, Inc. | 53 960 | 3,92 | 1 433 | 10,66 | ||||
| 2025-08-14 | 13F | Mariner, LLC | 324 697 | −15,97 | 8 624 | −10,55 | ||||
| 2025-05-15 | 13F/A | Orion Portfolio Solutions, LLC | 28 450 | −19,51 | 710 | −21,40 | ||||
| 2025-08-14 | 13F | Integrated Wealth Concepts LLC | 134 982 | 15,26 | 3 585 | 22,73 | ||||
| 2025-08-13 | 13F | Capital Analysts, Inc. | 33 980 | 1,14 | 1 | |||||
| 2025-08-06 | 13F | Legacy Investment Solutions, LLC | 106 530 | 57,91 | 2 829 | 62,12 | ||||
| 2025-07-09 | 13F | Tounjian Advisory Partners, Llc | 34 163 | 0,00 | 852 | 0,00 | ||||
| 2025-08-14 | 13F | Harvest Investment Services, LLC | 21 454 | −5,31 | 570 | 0,71 | ||||
| 2025-08-12 | 13F | Indie Asset Partners, LLC | 0 | −100,00 | 0 | |||||
| 2025-08-04 | 13F | L.m. Kohn & Company | 28 226 | −4,34 | 750 | 1,77 | ||||
| 2025-07-25 | 13F | Envestnet Portfolio Solutions, Inc. | 8 196 | −93,52 | 218 | −93,13 | ||||
| 2025-05-21 | 13F/A | Geneos Wealth Management Inc. | 0 | −100,00 | 0 | −100,00 | ||||
| 2025-08-12 | 13F | Jpmorgan Chase & Co | 4 | −99,98 | 0 | −100,00 | ||||
| 2025-07-22 | 13F | Simplicity Wealth,LLC | 202 770 | 73,22 | 5 386 | 84,42 | ||||
| 2025-08-12 | 13F | Gladstone Institutional Advisory LLC | 23 507 | −68,43 | 624 | −66,40 | ||||
| 2025-08-13 | 13F | Townsquare Capital Llc | 0 | −100,00 | 0 | |||||
| 2025-07-31 | 13F | Moloney Securities Asset Management, LLC | 17 985 | 3,42 | 478 | 10,16 | ||||
| 2025-08-11 | 13F | Brass Tax Wealth Management, Inc | 425 004 | 5,19 | 11 288 | 11,98 | ||||
| 2025-08-11 | 13F | Principal Securities, Inc. | 53 075 | 20,77 | 1 410 | 25,69 | ||||
| 2025-07-16 | 13F | Essex Financial Services, Inc. | 8 902 | 0,00 | 236 | 6,31 | ||||
| 2025-08-14 | 13F | Schwallier Wealth Management LLC | 0 | −100,00 | 0 | −100,00 | ||||
| 2025-07-30 | 13F | LifeWealth Investments, LLC | 36 581 | 2,24 | 972 | 8,86 | ||||
| 2025-08-19 | 13F | Advisory Services Network, LLC | 174 066 | 9,40 | 4 679 | 17,86 | ||||
| 2025-05-12 | 13F | Independent Advisor Alliance | 0 | −100,00 | 0 | |||||
| 2025-08-06 | 13F | Commonwealth Equity Services, Llc | 767 257 | −24,33 | 20 | −20,00 | ||||
| 2025-08-11 | 13F | Aptus Capital Advisors, LLC | 1 150 | 0,00 | 31 | 7,14 | ||||
| 2025-08-13 | 13F | SCS Capital Management LLC | 16 152 | 1,23 | 429 | 7,54 | ||||
| 2025-09-04 | 13F/A | Advisor Group Holdings, Inc. | 1 756 473 | 6,87 | 46 652 | 13,77 | ||||
| 2025-08-08 | 13F | Avantax Advisory Services, Inc. | 83 669 | 1,02 | 2 222 | 7,55 | ||||
| 2025-08-13 | 13F | Mayfair Advisory Group, LLC | 25 583 | 0,00 | 692 | 8,31 | ||||
| 2025-08-08 | 13F | Foundations Investment Advisors, LLC | 50 158 | −11,26 | 1 332 | −5,53 | ||||
| 2025-08-14 | 13F | Jane Street Group, Llc | 31 794 | −59,93 | 844 | −57,35 | ||||
| 2025-07-18 | 13F | Cooper Financial Group | 19 481 | −8,95 | 517 | −3,00 | ||||
| 2025-08-04 | 13F | Creekmur Asset Management LLC | 1 490 215 | 3,48 | 39 580 | 10,16 | ||||
| 2025-05-08 | 13F | Us Bancorp \de\ | 0 | −100,00 | 0 | |||||
| 2025-07-23 | 13F | Defined Financial Planning LLC | 15 587 | 415 | ||||||
| 2025-07-25 | 13F | We Are One Seven, LLC | 33 913 | 901 | ||||||
| 2025-08-04 | 13F | IFG Advisory, LLC | 88 748 | −16,37 | 2 357 | −10,96 | ||||
| 2025-07-30 | 13F | Strategic Blueprint, LLC | 26 213 | −19,36 | 696 | −14,18 | ||||
| 2025-07-15 | 13F | Santori & Peters, Inc. | 391 090 | 0,04 | 10 387 | 6,50 | ||||
| 2025-07-16 | 13F | Cambridge Advisors Inc. | 17 467 | −5,92 | 464 | 0,00 | ||||
| 2025-07-24 | 13F | Fischer Investment Strategies, Llc | 569 210 | 17,00 | 15 118 | 24,56 | ||||
| 2025-08-13 | 13F | Maia Wealth LLC | 82 743 | −33,99 | 2 198 | −28,30 | ||||
| 2025-08-14 | 13F | Benjamin Edwards Inc | 15 058 | −24,04 | 400 | −19,23 | ||||
| 2025-08-12 | 13F | Richmond Investment Services, LLC | 117 842 | 107,11 | 3 130 | 120,51 | ||||
| 2025-08-06 | 13F | Wedbush Securities Inc | 166 343 | −39,70 | 4 | −33,33 | ||||
| 2025-07-08 | 13F | Nbc Securities, Inc. | 27 898 | −1,98 | 1 | |||||
| 2025-08-04 | 13F | Atria Investments Llc | 16 280 | 432 | ||||||
| 2025-07-07 | 13F | Nova Wealth Management, Inc. | 469 | −52,24 | 12 | −50,00 | ||||
| 2025-08-14 | 13F | Old Mission Capital Llc | 22 791 | 605 | ||||||
| 2025-07-07 | 13F | Capital Asset Advisory Services LLC | 738 615 | 4,35 | 19 588 | 10,26 | ||||
| 2025-08-08 | 13F | Cetera Investment Advisers | 1 019 430 | 4,40 | 27 076 | 11,14 | ||||
| 2025-08-08 | 13F | SBI Securities Co., Ltd. | 2 | −33,33 | 0 | |||||
| 2025-08-06 | 13F | Golden State Wealth Management, LLC | 10 280 | 0,00 | 273 | 6,64 | ||||
| 2025-07-14 | 13F | Chris Bulman Inc | 9 704 | −13,81 | 258 | −8,21 | ||||
| 2025-08-06 | 13F | Wsfs Capital Management, Llc | 8 146 | 0,00 | 216 | 6,40 | ||||
| 2025-07-14 | 13F | Sowell Financial Services LLC | 21 879 | −14,29 | 581 | −8,65 | ||||
| 2025-08-06 | 13F | Walkner Condon Financial Advisors LLC | 53 124 | −25,73 | 1 411 | −20,96 | ||||
| 2025-08-19 | 13F | National Asset Management, Inc. | 0 | −100,00 | 0 | |||||
| 2025-08-11 | 13F | Perennial Investment Advisors, LLC | 112 101 | 2 977 | ||||||
| 2025-07-22 | 13F | Merit Financial Group, LLC | 12 854 | 0,00 | 341 | 6,56 | ||||
| 2025-08-15 | 13F | Morgan Stanley | 23 246 | 2 052,41 | 617 | 2 273,08 | ||||
| 2025-05-15 | 13F | Concorde Asset Management, LLC | 17 354 | 13,75 | 425 | 9,00 | ||||
| 2025-07-02 | 13F | HBW Advisory Services LLC | 10 766 | 0,00 | 286 | 6,34 | ||||
| 2025-03-21 | 13F | Prostatis Group LLC | 0 | −100,00 | 0 | |||||
| 2025-07-11 | 13F | Quad-Cities Investment Group, LLC | 14 538 | 0,00 | 386 | 6,63 | ||||
| 2025-07-21 | 13F | Ameritas Advisory Services, LLC | 12 656 | −64,82 | 336 | −62,63 | ||||
| 2025-08-20 | 13F/A | Coppell Advisory Solutions LLC | 659 729 | 32,17 | 17 437 | 40,98 | ||||
| 2025-07-21 | 13F | Triad Wealth Partners, LLC | 24 522 | 149,97 | 651 | 166,80 | ||||
| 2025-08-15 | 13F | Equitable Holdings, Inc. | 80 799 | 7,28 | 2 146 | 14,21 | ||||
| 2025-08-07 | 13F | Kestra Private Wealth Services, Llc | 721 868 | 535,98 | 19 173 | 577,22 | ||||
| 2025-07-21 | 13F | Andina Capital Management, LLC | 0 | −100,00 | 0 | |||||
| 2025-05-02 | 13F | Apollon Wealth Management, LLC | 0 | −100,00 | 0 | −100,00 | ||||
| 2025-08-05 | 13F | Claro Advisors LLC | 41 916 | 16,54 | 1 113 | 24,08 | ||||
| 2025-07-28 | 13F | Mutual Advisors, LLC | 14 995 | −13,55 | 404 | −5,61 | ||||
| 2025-08-14 | 13F | Great Valley Advisor Group, Inc. | 11 596 | −1,29 | 308 | 5,14 | ||||
| 2025-07-17 | 13F | Albion Financial Group /ut | 358 | 0,00 | 10 | 12,50 | ||||
| 2025-07-30 | 13F | IMG Wealth Management, Inc. | 275 408 | 4,12 | 7 315 | 10,83 | ||||
| 2025-08-13 | 13F | Twin Peaks Wealth Advisors, LLC | 13 188 | 45,71 | 358 | 62,27 | ||||
| 2025-08-08 | 13F | Larson Financial Group LLC | 1 220 | 0,00 | 32 | 6,67 | ||||
| 2025-07-25 | 13F | Cwm, Llc | 275 091 | 0,80 | 7 | 16,67 | ||||
| 2025-08-08 | 13F | Symphony Financial Services, Inc. | 17 475 | 12,92 | 464 | 20,21 | ||||
| 2025-08-14 | 13F | GWM Advisors LLC | 439 981 | −7,90 | 11 686 | −1,96 | ||||
| 2025-07-10 | 13F | Focus Financial Network, Inc. | 15 024 | 0,00 | 399 | 6,68 | ||||
| 2025-07-24 | 13F | Cascade Investment Group, Inc. | 9 680 | −1,56 | 257 | 4,90 | ||||
| 2025-08-05 | 13F | Strategic Financial Concepts, LLC | 18 566 | −3,61 | 493 | 2,71 | ||||
| 2025-07-30 | 13F | TFB Advisors LLC | 18 547 | −23,65 | 493 | −18,81 | ||||
| 2025-05-07 | 13F | Prosperity Consulting Group, LLC | 0 | −100,00 | 0 | |||||
| 2025-08-04 | 13F | Assetmark, Inc | 4 146 | 14,91 | 110 | 22,22 | ||||
| 2025-07-18 | 13F | Truist Financial Corp | 1 128 503 | 1,59 | 29 973 | 8,15 | ||||
| 2025-07-24 | 13F | IFP Advisors, Inc | 27 671 | 8,92 | 735 | 15,96 | ||||
| 2025-07-25 | 13F | Lion Street Advisors, LLC | 25 086 | −4,39 | 666 | 1,83 | ||||
| 2025-07-29 | 13F | Private Trust Co Na | 10 361 | 6,51 | 275 | 13,64 | ||||
| 2025-08-05 | 13F | Milestone Asset Management, Llc | 418 721 | 34,43 | 11 121 | 43,11 | ||||
| 2025-07-31 | 13F | Cambridge Investment Research Advisors, Inc. | 649 420 | −34,62 | 17 | −29,17 | ||||
| 2025-07-28 | 13F | Axxcess Wealth Management, Llc | 702 397 | 4,40 | 18 656 | 11,13 | ||||
| 2025-08-11 | 13F | Regal Investment Advisors LLC | 10 549 | 0,00 | 280 | 6,46 | ||||
| 2025-07-25 | 13F | Atria Wealth Solutions, Inc. | 33 946 | −80,97 | 902 | −79,75 | ||||
| 2025-08-01 | 13F | Wealth Watch Advisors, INC | 103 704 | 42,44 | 2 754 | 51,65 | ||||
| 2025-08-12 | 13F | Proequities, Inc. | 0 | 0 | ||||||
| 2025-05-02 | 13F | BlackRock, Inc. | 0 | −100,00 | 0 | |||||
| 2025-08-11 | 13F | Blue Bell Private Wealth Management, Llc | 235 | 0,00 | 6 | 20,00 | ||||
| 2025-07-18 | 13F | Trilogy Capital Inc. | 12 470 | 0,00 | 331 | 6,43 | ||||
| 2025-08-14 | 13F | Core Wealth Advisors, Inc. | 8 105 | 215 | ||||||
| 2025-07-16 | 13F | EdgeRock Capital LLC | 27 524 | 0,00 | 731 | 6,56 | ||||
| 2025-08-06 | 13F | Prospera Financial Services Inc | 7 926 | 211 | ||||||
| 2025-08-12 | 13F | Change Path, LLC | 277 959 | −0,72 | 7 383 | 5,68 | ||||
| 2025-08-14 | 13F | Mml Investors Services, Llc | 756 648 | −5,63 | 20 | 0,00 | ||||
| 2025-08-15 | 13F | Kestra Advisory Services, LLC | 428 889 | −0,27 | 11 391 | 6,16 | ||||
| 2025-08-05 | 13F | Integrity Financial Corp /WA | 219 828 | −12,86 | 5 839 | −7,24 | ||||
| 2025-07-24 | 13F | SLT Holdings LLC | 44 764 | −7,75 | 1 189 | −1,82 | ||||
| 2025-07-28 | 13F | Virtus Wealth Solutions LLC | 16 198 | 1,36 | 430 | 8,04 | ||||
| 2025-07-30 | 13F | Brookstone Capital Management | 750 871 | −0,41 | 19 943 | 6,02 | ||||
| 2025-08-12 | 13F | LPL Financial LLC | 8 066 365 | 2,80 | 214 243 | 9,43 | ||||
| 2025-08-14 | 13F | Ausdal Financial Partners, Inc. | 8 991 | −0,59 | 239 | 5,78 | ||||
| 2025-08-14 | 13F | CoreCap Advisors, LLC | 41 733 | −9,11 | 1 108 | −3,23 | ||||
| 2025-08-14 | 13F | Financial Strategies Group, Inc. | 41 511 | 4,89 | 1 107 | 14,83 | ||||
| 2025-08-12 | 13F | Tradition Wealth Management, LLC | 66 961 | −2,76 | 1 778 | 3,49 | ||||
| 2025-08-14 | 13F | Planwiser Financial, Llc | 16 779 | 15,46 | 452 | 24,86 | ||||
| 2025-07-17 | 13F | Janney Montgomery Scott LLC | 20 727 | 1,45 | 1 | |||||
| 2025-07-25 | 13F | Gw Henssler & Associates Ltd | 3 959 449 | −6,91 | 105 163 | −0,90 | ||||
| 2025-08-12 | 13F | Steward Partners Investment Advisory, Llc | 36 385 | 25,46 | 966 | 33,61 | ||||
| 2025-08-05 | 13F | GPS Wealth Strategies Group, LLC | 66 202 | 15,52 | 1 758 | 23,02 | ||||
| 2025-08-05 | 13F | Bank Of Montreal /can/ | 150 | 0,00 | 4 | 0,00 | ||||
| 2025-08-01 | 13F | FSA Advisors, Inc. | 29 829 | −12,08 | 792 | −5,94 | ||||
| 2025-07-25 | 13F | Apollon Financial, LLC | 107 588 | −1,29 | 2 858 | 5,08 | ||||
| 2025-08-08 | 13F | Davies Financial Advisors, Inc. | 32 645 | −0,73 | 867 | 5,73 | ||||
| 2025-08-06 | 13F | Legacy Wealth Managment, LLC/ID | 106 530 | 39,09 | 2 829 | 48,12 | ||||
| 2025-08-14 | 13F | Raymond James Financial Inc | 538 025 | 106,35 | 14 290 | 119,66 | ||||
| 2025-07-28 | 13F | Harbour Investments, Inc. | 526 162 | 6,93 | 13 975 | 13,83 | ||||
| 2025-07-21 | 13F | DHJJ Financial Advisors, Ltd. | 3 645 | −30,83 | 97 | −26,72 | ||||
| 2025-08-12 | 13F | Global Retirement Partners, LLC | 21 499 | 0,00 | 571 | 4,20 | ||||
| 2025-04-22 | 13F | Breakthru Advisory Services, Llc | 0 | −100,00 | 0 | |||||
| 2025-07-29 | 13F | Stratos Wealth Partners, LTD. | 443 723 | −2,55 | 11 785 | 3,74 | ||||
| 2025-07-22 | 13F | Echo Wealth Management, LLC | 54 585 | 10,19 | 1 450 | 17,33 | ||||
| 2025-08-04 | 13F | Creative Financial Designs Inc /adv | 1 435 | 0,00 | 38 | 8,57 | ||||
| 2025-08-14 | 13F | Synovus Financial Corp | 221 781 | 5,49 | 5 891 | 12,30 | ||||
| 2025-07-23 | 13F | Clear Creek Financial Management, LLC | 10 600 | 0,00 | 282 | 6,44 | ||||
| 2025-07-09 | 13F | Pallas Capital Advisors LLC | 22 030 | −62,40 | 585 | −59,96 | ||||
| 2025-08-12 | 13F | SRS Capital Advisors, Inc. | 45 101 | −6,16 | 1 198 | −0,17 | ||||
| 2025-07-16 | 13F | Castleview Partners, Llc | 28 452 | −0,29 | 756 | 6,19 | ||||
| 2025-08-05 | 13F | Sigma Planning Corp | 155 309 | −8,97 | 4 125 | −3,10 | ||||
| 2025-08-11 | 13F | Advisor Resource Council | 10 135 | 5,08 | 269 | 12,08 | ||||
| 2025-07-21 | 13F | Precedent Wealth Partners, Llc | 86 687 | 21,81 | 2 302 | 29,69 | ||||
| 2025-07-22 | 13F | Ergawealth Advisors, Inc. | 56 029 | −12,19 | 1 488 | −6,53 | ||||
| 2025-08-14 | 13F | IHT Wealth Management, LLC | 26 626 | 1,68 | 707 | 8,27 | ||||
| 2025-08-11 | 13F | Private Advisor Group, LLC | 426 708 | 5,96 | 11 333 | 12,80 | ||||
| 2025-08-04 | 13F | Arkadios Wealth Advisors | 52 466 | −1,52 | 1 393 | 4,82 | ||||
| 2025-05-14 | 13F | Ameriprise Financial Inc | 0 | −100,00 | 0 | −100,00 | ||||
| 2025-08-05 | 13F | Atlas Private Wealth Advisors | 207 698 | −25,37 | 5 516 | −20,56 | ||||
| 2025-04-10 | 13F | Whipplewood Advisors, LLC | 0 | −100,00 | 0 | |||||
| 2025-07-17 | 13F | Centennial Wealth Advisory LLC | 1 773 912 | −0,58 | 47 119 | 5,84 | ||||
| 2025-08-14 | 13F | Susquehanna International Group, Llp | 10 868 | −81,31 | 289 | −80,14 | ||||
| 2025-08-14 | 13F | Royal Bank Of Canada | 508 836 | −3,86 | 13 515 | 2,35 | ||||
| 2025-07-09 | 13F | Dynamic Advisor Solutions LLC | 16 761 | −16,99 | 445 | −11,53 | ||||
| 2025-07-17 | 13F | Alliance Wealth Advisors, LLC | 15 469 | 0,00 | 411 | 6,49 | ||||
| 2025-07-17 | 13F | HB Wealth Management, LLC | 8 986 | 0,00 | 239 | 6,25 | ||||
| 2025-08-08 | 13F | Good Life Advisors, LLC | 18 527 | −15,16 | 492 | −9,56 | ||||
| 2025-08-29 | 13F | Centaurus Financial, Inc. | 99 994 | −2,77 | 3 | 0,00 | ||||
| 2025-07-24 | 13F | McKinley Carter Wealth Services, Inc. | 21 637 | 0,00 | 575 | 6,49 | ||||
| 2025-07-15 | 13F | Five Pine Wealth Management | 30 655 | 2,25 | 814 | 8,82 | ||||
| 2025-07-15 | 13F | Legacy Financial Group LLC | 1 933 867 | 0,87 | 51 364 | 7,38 | ||||
| 2025-08-01 | 13F | Envestnet Asset Management Inc | 3 480 049 | 1,32 | 92 430 | 7,86 | ||||
| 2025-08-27 | 13F/A | Brinker Capital Investments, LLC | 31 340 | 10,16 | 832 | 17,35 | ||||
| 2025-07-17 | 13F | Sound Income Strategies, LLC | 633 | 8,21 | 17 | 14,29 | ||||
| 2025-08-18 | 13F | Tyler-Stone Wealth Management | 117 378 | 8,37 | 3 118 | 15,36 |