Grundläggande statistik
| Institutionella ägare | 154 total, 154 long only, 0 short only, 0 long/short - change of 1,30% MRQ |
| Genomsnittlig portföljallokering | 0.3495 % - change of −34,27% MRQ |
| Institutionella aktier (lång) | 66 144 575 (ex 13D/G) - change of 8,73MM shares 15,21% MRQ |
| Institutionellt värde (lång) | $ 1 345 490 USD ($1000) |
Institutionellt ägande och aktieägare
abrdn ETFs - abrdn Bloomberg All Commodity Strategy K-1 Free ETF (US:BCI) har 154 Institutionella ägare och aktieägare som har lämnat in 13D/G- eller 13F-formulär till Securities Exchange Commission (SEC). Dessa institut innehar totalt 66,144,575 aktier. Största aktieägare inkluderar Wells Fargo & Company/mn, Sei Investments Co, Metis Global Partners, LLC, Bank Of America Corp /de/, Morgan Stanley, Nepc Llc, Northwestern Mutual Wealth Management Co, Royal Bank Of Canada, Great Lakes Advisors, Llc, and Lockheed Martin Investment Management Co .
abrdn ETFs - abrdn Bloomberg All Commodity Strategy K-1 Free ETF (ARCA:BCI) Institutionell ägarstruktur visar institutioners och fonders nuvarande positioner i företaget, samt de senaste förändringarna i positionernas storlek. Större aktieägare kan vara enskilda investerare, fonder, hedgefonder eller institutioner. Bilaga 13D visar att investeraren äger (eller ägde) mer än 5% av företaget och avser (eller avsåg) att aktivt eftersträva en förändring av affärsstrategin. Schedule 13G indikerar en passiv investering på över 5%.
The share price as of September 10, 2025 is 21,18 / share. Previously, on September 11, 2024, the share price was 19,19 / share. This represents an increase of 10,37% over that period.

Fondsentimentets poäng
Fondsentimentet poängen(fka Ägarackumulation-poäng) visar vilka aktier som är mest köpta av fonder. Det är resultatet av en sofistikerad kvantitativ flerfaktormodell som identifierar företag med de högsta nivåerna av institutionell ackumulering. Poängsättningsmodellen använder en kombination av den totala ökningen av redovisade ägare, förändringarna i portföljallokeringarna för dessa ägare och andra mått. Siffran sträcker sig från 0 till 100, där högre siffror indikerar en högre nivå av ackumulering i förhållande till sina konkurrenter, och 50 är genomsnittet.
Uppdateringsfrekvens: Dagligen
Se Ownership Explorer, som innehåller en lista över de högst rankade företagen.
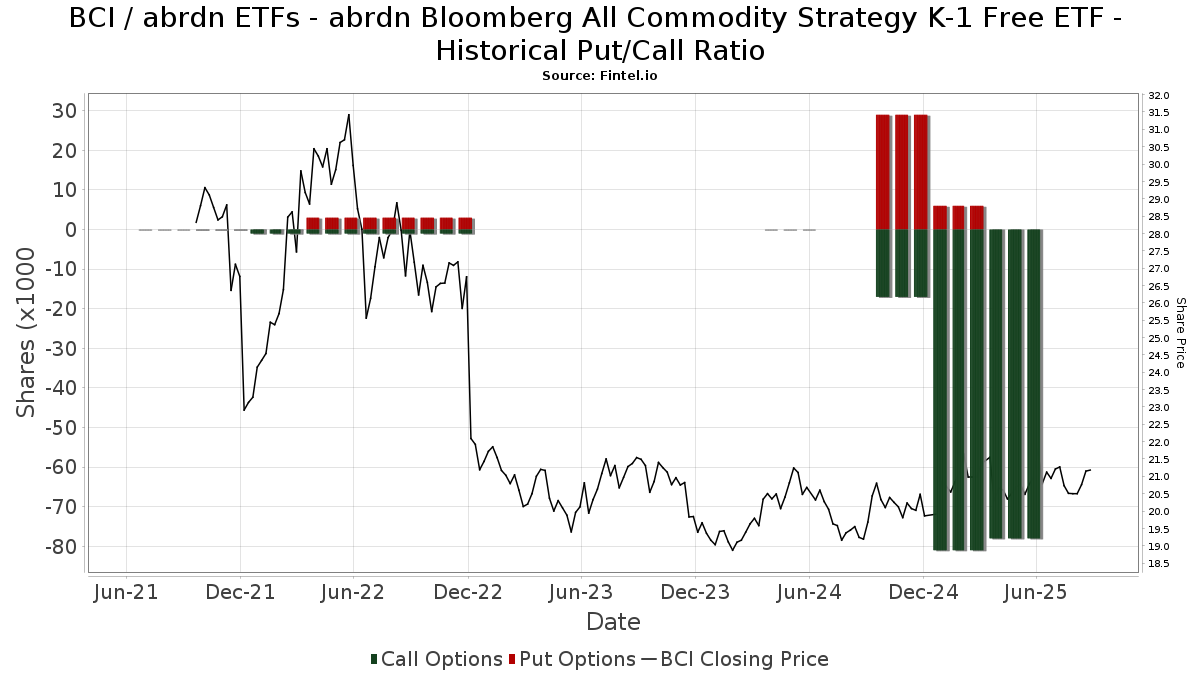
Institutionell sälj/köp-kvot
Förutom att rapportera vanliga eget kapital- och skuldemissioner måste institutioner med mer än 100MM tillgångar under förvaltning också avslöja sina innehav av sälj- och köpoptioner. Eftersom säljoptioner i allmänhet indikerar ett negativt sentiment och köpoptioner indikerar ett positivt sentiment, kan vi få en uppfattning om det övergripande institutionella sentimentet genom att plotta förhållandet mellan säljoptioner och köpoptioner. Diagrammet till höger visar det historiska förhållandet mellan sälj- och köpoptioner för detta instrument.
Genom att använda sälj/köp-kvoten som en indikator på aktieägarnas sentiment undviker man en av de största bristerna med att använda det totala institutionella ägandet, nämligen att en betydande del av de förvaltade tillgångarna investeras passivt för att följa index. Passivt förvaltade fonder köper vanligtvis inte optioner, så indikatorn för sälj/köp-kvoten ger en bättre bild av stämningen i aktivt förvaltade fonder.
13F- och NPORT-arkiveringar
Detaljer om 13F-arkiveringar är gratis. Detaljer om NP-arkiveringar kräver ett premiummedlemskap. Gröna rader indikerar nya positioner. Röda rader indikerar stängda positioner. Klicka på länk symbolen för att se hela transaktionshistoriken.
Uppgradera
för att låsa upp premiumdata och exportera till Excel ![]() .
.
| Fil Datum | Källa | Investerare | Typ | Genomsnittligt pris (beräknat) |
Aktier | Δ Aktier (%) |
Rapporterat värde (1000 USD) |
Δ Värde (%) |
Portföljallokering (%) |
|
|---|---|---|---|---|---|---|---|---|---|---|
| 2025-08-25 | NP | NDAA - Ned Davis Research 360 Dynamic Allocation ETF | 6 163 | −72,10 | 128 | −72,94 | ||||
| 2025-08-12 | 13F | Aldebaran Capital, Llc | 150 053 | −1,55 | 3 117 | −4,71 | ||||
| 2025-08-12 | 13F | Steward Partners Investment Advisory, Llc | 5 094 | 950,31 | 106 | 950,00 | ||||
| 2025-08-25 | NP | MAINSTAY VP FUNDS TRUST - MainStay VP IQ Hedge Multi-Strategy Portfolio Initial Class | 26 687 | 554 | ||||||
| 2025-07-28 | 13F | Kiker Wealth Management, LLC | 300 | 0,00 | 6 | 0,00 | ||||
| 2025-08-14 | 13F | Smartleaf Asset Management LLC | 2 509 | 52 | ||||||
| 2025-08-14 | 13F | Susquehanna International Group, Llp | 0 | −100,00 | 0 | |||||
| 2025-08-12 | 13F | Accredited Wealth Management, LLC | 22 472 | 467 | ||||||
| 2025-05-05 | 13F | Private Advisor Group, LLC | 0 | −100,00 | 0 | |||||
| 2025-08-13 | 13F | Quadrature Capital Ltd | 207 686 | 4 313 | ||||||
| 2025-08-06 | 13F | Black Swift Group, LLC | 0 | −100,00 | 0 | |||||
| 2025-06-25 | NP | QAI - IQ Hedge Multi-Strategy Tracker ETF | 88 275 | 1 796 | ||||||
| 2025-08-14 | 13F | Sunbelt Securities, Inc. | 2 493 | 0,00 | 49 | −7,55 | ||||
| 2025-08-19 | NP | NORTHWESTERN MUTUAL SERIES FUND INC - Balanced Portfolio | 258 400 | 0,00 | 5 367 | −3,23 | ||||
| 2025-08-04 | 13F | AlphaStar Capital Management, LLC | 164 769 | 3 422 | ||||||
| 2025-08-08 | 13F | Hartland & Co., LLC | 300 | 0,00 | 6 | 0,00 | ||||
| 2025-07-25 | 13F | Concurrent Investment Advisors, LLC | 11 382 | 236 | ||||||
| 2025-07-22 | 13F | MBL Wealth, LLC | 17 424 | −7,22 | 362 | −10,20 | ||||
| 2025-08-07 | 13F | Fund Evaluation Group, LLC | 20 786 | 0,00 | 432 | −3,36 | ||||
| 2025-08-14 | 13F | Ancora Advisors, LLC | 14 700 | 0,00 | 305 | −3,17 | ||||
| 2025-08-07 | 13F | Cahill Financial Advisors Inc | 24 077 | −14,95 | 500 | −17,63 | ||||
| 2025-08-18 | 13F | Hollencrest Capital Management | 28 091 | −2,96 | 583 | −6,12 | ||||
| 2025-08-11 | 13F | United Advisor Group, LLC | 16 704 | 347 | ||||||
| 2025-08-06 | 13F | Csenge Advisory Group | 38 379 | 15,32 | 779 | 13,06 | ||||
| 2025-08-08 | 13F | Creative Planning | 46 137 | −0,19 | 958 | −3,43 | ||||
| 2025-08-14 | 13F | Mml Investors Services, Llc | 30 236 | 35,11 | 1 | |||||
| 2025-08-14 | 13F | UBS Group AG | 5 644 | −34,65 | 117 | −36,76 | ||||
| 2025-08-19 | NP | NORTHWESTERN MUTUAL SERIES FUND INC - Asset Allocation Portfolio | 46 500 | 0,00 | 966 | −3,21 | ||||
| 2025-08-14 | 13F | Wells Fargo & Company/mn | 25 317 919 | 37,02 | 525 853 | 32,61 | ||||
| 2025-04-30 | 13F | Allworth Financial LP | 0 | −100,00 | 0 | |||||
| 2025-07-25 | 13F | Cwm, Llc | 2 272 | 0,00 | 0 | |||||
| 2025-05-15 | 13F/A | Orion Portfolio Solutions, LLC | 97 847 | −5,49 | 2 100 | 2,69 | ||||
| 2025-09-04 | 13F/A | Advisor Group Holdings, Inc. | 3 071 | −29,47 | 64 | −32,26 | ||||
| 2025-08-18 | 13F | Geneos Wealth Management Inc. | 86 201 | −7,94 | 1 790 | −10,90 | ||||
| 2025-07-07 | 13F | Thurston, Springer, Miller, Herd & Titak, Inc. | 4 432 | 19,98 | 92 | 16,46 | ||||
| 2025-07-16 | 13F | ORG Partners LLC | 295 | 6 | ||||||
| 2025-08-07 | 13F | Vise Technologies, Inc. | 189 276 | −1,00 | 3 931 | 4,10 | ||||
| 2025-07-24 | 13F | Ronald Blue Trust, Inc. | 255 394 | 1,79 | 5 305 | −1,49 | ||||
| 2025-07-31 | 13F | Leavell Investment Management, Inc. | 229 861 | 8,39 | 4 774 | 4,90 | ||||
| 2025-08-04 | 13F | Center for Financial Planning, Inc. | 0 | −100,00 | 0 | |||||
| 2025-08-14 | 13F | Royal Bank Of Canada | 1 461 283 | 8,43 | 30 352 | 4,94 | ||||
| 2025-05-05 | 13F | Creekmur Asset Management LLC | 0 | −100,00 | 0 | |||||
| 2025-07-11 | 13F | Farther Finance Advisors, LLC | 1 742 | 97,95 | 36 | 100,00 | ||||
| 2025-04-14 | 13F | Park Avenue Securities Llc | 0 | −100,00 | 0 | |||||
| 2025-04-21 | 13F | Envestnet Portfolio Solutions, Inc. | 0 | −100,00 | 0 | |||||
| 2025-08-26 | NP | TBFC - The Brinsmere Fund - Conservative ETF | 226 990 | 2,68 | 4 715 | −0,63 | ||||
| 2025-07-21 | 13F | Abundance Wealth Counselors | 595 964 | −0,20 | 12 | 0,00 | ||||
| 2025-08-05 | 13F | Verity Asset Management, Inc. | 0 | −100,00 | 0 | |||||
| 2025-08-08 | 13F | Cetera Investment Advisers | 81 527 | −0,83 | 1 693 | −4,02 | ||||
| 2025-08-04 | 13F | Lockheed Martin Investment Management Co | 938 100 | −5,06 | 19 484 | −8,11 | ||||
| 2025-08-13 | 13F | Victory Financial Group, Llc | 38 298 | 5,23 | 795 | 1,53 | ||||
| 2025-07-30 | 13F | Exencial Wealth Advisors, Llc | 28 548 | −18,81 | 593 | −21,49 | ||||
| 2025-08-01 | 13F | Envestnet Asset Management Inc | 349 752 | −11,45 | 7 264 | −14,30 | ||||
| 2025-08-11 | 13F | Principal Securities, Inc. | 8 832 | −9,11 | 183 | −4,19 | ||||
| 2025-07-14 | 13F | GAMMA Investing LLC | 2 090 | 0,00 | 43 | −2,27 | ||||
| 2025-08-14 | 13F | Citadel Advisors Llc | Call | 78 500 | −3,80 | 1 630 | −6,91 | |||
| 2025-07-08 | 13F | Nbc Securities, Inc. | 4 278 | 1 577,65 | 0 | |||||
| 2025-08-13 | 13F | Truvestments Capital Llc | 0 | −100,00 | 0 | |||||
| 2025-05-06 | 13F | Lifeworks Advisors, LLC | 0 | −100,00 | 0 | −100,00 | ||||
| 2025-08-14 | 13F | Atomi Financial Group, Inc. | 13 801 | −35,06 | 287 | −37,28 | ||||
| 2025-08-07 | 13F | Winthrop Capital Management, LLC | 22 654 | 0 | ||||||
| 2025-07-16 | 13F | Diversified Enterprises, LLC | 13 028 | −14,88 | 271 | −17,68 | ||||
| 2025-08-08 | 13F | Crossmark Global Holdings, Inc. | 45 662 | −4,55 | 947 | −7,52 | ||||
| 2025-08-14 | 13F | Disciplina Capital Management LLC | 394 947 | 46,20 | 8 203 | 41,50 | ||||
| 2025-08-08 | 13F | Avantax Advisory Services, Inc. | 12 704 | −34,29 | 264 | −36,47 | ||||
| 2025-08-13 | 13F | Flow Traders U.s. Llc | 0 | −100,00 | 0 | |||||
| 2025-07-29 | 13F | Werba Rubin Papier Wealth Management | 42 484 | 14,83 | 882 | 11,22 | ||||
| 2025-08-08 | 13F | Mason Street Advisors, Llc | 304 900 | 0,00 | 6 333 | −3,22 | ||||
| 2025-08-13 | 13F | Russell Investments Group, Ltd. | 0 | 0 | ||||||
| 2025-08-06 | 13F | First Horizon Advisors, Inc. | 0 | −100,00 | 0 | |||||
| 2025-07-31 | 13F | Resonant Capital Advisors, LLC | 237 666 | −0,13 | 4 936 | −3,35 | ||||
| 2025-08-01 | 13F | Rossby Financial, LCC | 0 | −100,00 | 0 | |||||
| 2025-08-14 | 13F | Raymond James Financial Inc | 321 984 | 702,15 | 6 688 | 676,66 | ||||
| 2025-05-14 | 13F | Huntington National Bank | 5 | −33,33 | ||||||
| 2025-08-14 | 13F | Evergreen Wealth Solutions, LLC | 273 489 | 3,11 | 5 680 | −0,19 | ||||
| 2025-04-23 | 13F | Continuum Advisory, LLC | 0 | −100,00 | 0 | |||||
| 2025-08-08 | 13F | Cornerstone Advisors Asset Management, Inc | 22 712 | −21,21 | 472 | −23,79 | ||||
| 2025-08-14 | 13F | Wiley Bros.-aintree Capital, Llc | 17 770 | −0,79 | 363 | −4,99 | ||||
| 2025-07-24 | 13F | Us Bancorp \de\ | 1 176 | 115,78 | 24 | 118,18 | ||||
| 2025-07-18 | 13F | Truist Financial Corp | 254 562 | −12,82 | 5 287 | −15,62 | ||||
| 2025-08-13 | 13F | Renaissance Technologies Llc | 59 300 | 1 232 | ||||||
| 2025-08-12 | 13F | Global Retirement Partners, LLC | 41 | −91,13 | 1 | −100,00 | ||||
| 2025-08-14 | 13F | CoreCap Advisors, LLC | 9 | −87,84 | 0 | −100,00 | ||||
| 2025-08-27 | 13F/A | Brinker Capital Investments, LLC | 91 922 | −6,06 | 1 909 | −9,05 | ||||
| 2025-08-13 | 13F | Mount Yale Investment Advisors, LLC | 12 525 | 260 | ||||||
| 2025-08-05 | 13F | C2P Capital Advisory Group, LLC d.b.a. Prosperity Capital Advisors | 0 | −100,00 | 0 | |||||
| 2025-07-23 | 13F | Austin Asset Management Co Inc | 29 638 | −0,10 | 616 | −3,30 | ||||
| 2025-08-13 | 13F | Financial & Tax Architects, LLC | 0 | −100,00 | 0 | |||||
| 2025-08-13 | 13F | Avestar Capital, LLC | 103 914 | 20,73 | 2 158 | 16,84 | ||||
| 2025-04-17 | 13F | Rs Crum Inc. | 156 425 | 3 357 | ||||||
| 2025-08-13 | 13F | Leuthold Group, Llc | 36 609 | 0,00 | 760 | −3,18 | ||||
| 2025-08-11 | 13F | Rothschild Investment Llc | 92 | 0,00 | 2 | 0,00 | ||||
| 2025-07-02 | 13F | Boston Standard Wealth Management, LLC | 40 047 | 29,55 | 832 | 32,48 | ||||
| 2025-07-17 | 13F | Keystone Global Partners, LLC | 0 | −100,00 | 0 | |||||
| 2025-08-14 | 13F | Fmr Llc | 267 | 1 113,64 | 6 | |||||
| 2025-08-05 | 13F | Advisors Preferred, LLC | 0 | −100,00 | 0 | |||||
| 2025-08-12 | 13F | Twin Focus Capital Partners, Llc | 0 | −100,00 | 0 | |||||
| 2025-08-13 | 13F | Cresset Asset Management, LLC | 705 422 | 6,35 | 14 652 | 2,92 | ||||
| 2025-08-14 | 13F | Stifel Financial Corp | 486 767 | −3,08 | 10 110 | −6,19 | ||||
| 2025-07-10 | 13F | Signal Advisors Wealth, LLC | 30 806 | 640 | ||||||
| 2025-08-15 | 13F | Morgan Stanley | 2 244 727 | 92,00 | 46 623 | 85,83 | ||||
| 2025-07-31 | 13F | Whipplewood Advisors, LLC | 1 114 | −90,58 | 23 | −14,81 | ||||
| 2025-08-08 | 13F | Empower Advisory Group, LLC | 20 115 | 418 | ||||||
| 2025-08-13 | 13F | Aristides Capital LLC | 30 000 | 0,00 | 623 | −3,11 | ||||
| 2025-07-16 | 13F | Perigon Wealth Management, LLC | 24 492 | −17,55 | 509 | −20,25 | ||||
| 2025-08-14 | 13F | Toroso Investments, LLC | 0 | −100,00 | 0 | |||||
| 2025-08-08 | 13F | MTM Investment Management, LLC | 4 980 | 103 | ||||||
| 2025-07-14 | 13F | AdvisorNet Financial, Inc | 4 371 | 7,77 | 91 | 3,45 | ||||
| 2025-07-31 | 13F | Cambridge Investment Research Advisors, Inc. | 33 156 | −23,53 | 1 | |||||
| 2025-07-10 | 13F | Wealth Enhancement Advisory Services, Llc | 149 107 | −8,26 | 3 143 | −9,87 | ||||
| 2025-07-30 | 13F | Whittier Trust Co | 1 080 | 22 | ||||||
| 2025-07-22 | 13F | Merit Financial Group, LLC | 54 268 | 37,80 | 1 127 | 33,37 | ||||
| 2025-08-14 | 13F | Macquarie Group Ltd | 147 001 | −11,30 | 3 053 | −14,15 | ||||
| 2025-08-19 | 13F | Cape Investment Advisory, Inc. | 581 | −22,84 | 12 | −25,00 | ||||
| 2025-07-30 | 13F | D.a. Davidson & Co. | 11 827 | −37,05 | 246 | −39,21 | ||||
| 2025-08-14 | 13F | Nepc Llc | 2 175 486 | 18,55 | 45 185 | 14,73 | ||||
| 2025-08-11 | 13F | Anfield Capital Management, LLC | 1 021 | 186,80 | 21 | 200,00 | ||||
| 2025-08-11 | 13F | Wealthspire Advisors, LLC | 21 115 | 0,00 | 439 | −3,31 | ||||
| 2025-08-06 | 13F | Walkner Condon Financial Advisors LLC | 30 713 | −16,29 | 638 | −18,93 | ||||
| 2025-08-04 | 13F | Spire Wealth Management | 0 | −100,00 | 0 | |||||
| 2025-08-14 | 13F | Sei Investments Co | 7 953 374 | −17,00 | 165 189 | −19,67 | ||||
| 2025-07-07 | 13F | Upper Left Wealth Management, LLC | 296 586 | 4,50 | 6 160 | 1,15 | ||||
| 2025-05-08 | NP | QALTX - Quantified Alternative Investment Fund Investor Class Shares | 7 900 | 170 | ||||||
| 2025-07-21 | 13F | Ameritas Advisory Services, LLC | 349 | 7 | ||||||
| 2025-05-09 | 13F | Atria Wealth Solutions, Inc. | 0 | −100,00 | 0 | |||||
| 2025-08-14 | 13F | Bank Of America Corp /de/ | 2 577 292 | 34,95 | 53 530 | 30,62 | ||||
| 2025-08-14 | 13F | Mariner, LLC | 29 191 | 606 | ||||||
| 2025-07-29 | 13F | Stratos Wealth Partners, LTD. | 0 | −100,00 | 0 | |||||
| 2025-04-29 | 13F | Td Private Client Wealth Llc | 0 | −100,00 | 0 | |||||
| 2025-08-11 | 13F | Compass Capital Corp /ma/ /adv | 0 | −100,00 | 0 | |||||
| 2025-08-19 | 13F | Advisory Services Network, LLC | 64 723 | 0,36 | 1 336 | −3,47 | ||||
| 2025-08-11 | 13F | Aspen Investment Management Inc | 33 885 | −11,03 | 1 | |||||
| 2025-07-10 | 13F | Oliver Lagore Vanvalin Investment Group | 75 | 2 | ||||||
| 2025-05-14 | 13F | Congress Wealth Management LLC / DE / | 0 | −100,00 | 0 | |||||
| 2025-08-05 | 13F | Sigma Planning Corp | 9 866 | 0,00 | 205 | −3,32 | ||||
| 2025-08-01 | 13F | New York Life Investment Management Llc | 121 072 | 2 515 | ||||||
| 2025-07-30 | 13F | Whittier Trust Co Of Nevada Inc | 2 131 | 0,00 | 44 | −2,22 | ||||
| 2025-08-19 | 13F | Wealth Group, Ltd. | 0 | −100,00 | 0 | |||||
| 2025-08-05 | 13F | Key FInancial Inc | 17 | 0,00 | 0 | |||||
| 2025-04-30 | 13F | Ramiah Investment Group | 50 804 | 38,51 | 1 090 | 53,52 | ||||
| 2025-07-24 | 13F | Callan Family Office, LLC | 13 577 | 0,00 | 282 | −3,44 | ||||
| 2025-08-06 | 13F | Commonwealth Equity Services, Llc | 12 917 | 5,91 | 0 | |||||
| 2025-05-15 | 13F | Fullerton Fund Management Co Ltd | 0 | −100,00 | 0 | |||||
| 2025-08-11 | 13F | HighTower Advisors, LLC | 43 254 | 13,81 | 898 | 10,18 | ||||
| 2025-08-14 | 13F | Vident Advisory, LLC | 22 445 | 91,17 | 466 | 85,66 | ||||
| 2025-07-30 | 13F | Cullen/frost Bankers, Inc. | 0 | −100,00 | 0 | |||||
| 2025-05-15 | 13F | Tower Research Capital LLC (TRC) | 0 | −100,00 | 0 | |||||
| 2025-08-14 | 13F | IHT Wealth Management, LLC | 11 175 | −28,01 | 232 | −30,33 | ||||
| 2025-05-28 | 13F/A | Modern Wealth Management, LLC | 12 301 | 238 | ||||||
| 2025-08-14 | 13F | Bnp Paribas Arbitrage, Sa | 4 698 | 98 | ||||||
| 2025-08-14 | 13F | Alliancebernstein L.p. | 174 950 | 3 634 | ||||||
| 2025-07-11 | 13F | Pinnacle Bancorp, Inc. | 256 | 0,00 | 5 | 0,00 | ||||
| 2025-07-24 | 13F | Comprehensive Money Management Services LLC | 57 211 | −2,78 | 1 188 | −5,86 | ||||
| 2025-08-13 | 13F | Transce3nd, LLC | 13 | 0,00 | 0 | |||||
| 2025-05-08 | 13F | Parkside Financial Bank & Trust | 0 | −100,00 | 0 | −100,00 | ||||
| 2025-07-22 | 13F | Marks Group Wealth Management, Inc | 0 | −100,00 | 0 | |||||
| 2025-08-14 | 13F | GWM Advisors LLC | 50 578 | −17,79 | 1 051 | −20,45 | ||||
| 2025-04-10 | 13F | Retirement Planning Group | 0 | −100,00 | 0 | |||||
| 2025-08-14 | 13F | Comerica Bank | 18 594 | 57,80 | 386 | 53,17 | ||||
| 2025-08-13 | 13F | Jones Financial Companies Lllp | 0 | −100,00 | 0 | |||||
| 2025-07-08 | 13F | Braun-Bostich & Associates Inc. | 0 | −100,00 | 0 | |||||
| 2025-08-08 | 13F | Principal Financial Group Inc | 285 250 | 5 925 | ||||||
| 2025-08-11 | 13F | Citigroup Inc | 9 | 0 | ||||||
| 2025-08-01 | 13F | American Financial & Tax Strategies Inc | 130 550 | −11,82 | 2 712 | −14,67 | ||||
| 2025-07-11 | 13F | Williams Financial, LLC | 0 | −100,00 | 0 | |||||
| 2025-08-06 | 13F | Penserra Capital Management LLC | 598 877 | 2,59 | 12 | 0,00 | ||||
| 2025-07-28 | 13F | Harbour Investments, Inc. | 1 210 | 0,08 | 25 | 0,00 | ||||
| 2025-08-14 | 13F | Citadel Advisors Llc | Put | 0 | −100,00 | 0 | ||||
| 2025-08-06 | 13F | Metis Global Partners, LLC | 7 925 004 | 27,74 | 164 602 | 23,63 | ||||
| 2025-08-14 | 13F | Cohen & Steers, Inc. | 35 159 | −12,70 | 1 | |||||
| 2025-08-04 | 13F | Creative Financial Designs Inc /adv | 150 | 0,00 | 3 | 0,00 | ||||
| 2025-08-04 | 13F | Assetmark, Inc | 330 | 3 566,67 | 7 | |||||
| 2025-07-07 | 13F | Versant Capital Management, Inc | 20 | 0,00 | 0 | |||||
| 2025-07-18 | 13F | SigFig Wealth Management, LLC | 191 010 | 15,87 | 3 988 | 13,59 | ||||
| 2025-04-30 | 13F | ARGI Investment Services, LLC | 0 | −100,00 | 0 | |||||
| 2025-07-24 | 13F | IFP Advisors, Inc | 0 | −100,00 | 0 | |||||
| 2025-05-08 | 13F | Banque Cantonale Vaudoise | 0 | −100,00 | 0 | |||||
| 2025-07-09 | 13F | Bruce G. Allen Investments, LLC | 30 065 | −0,43 | 624 | −3,55 | ||||
| 2025-07-10 | 13F | Stewardship Advisors, LLC | 13 438 | −18,63 | 279 | −21,19 | ||||
| 2025-07-17 | 13F | K2 Financial Inc. | 78 706 | 5,81 | 1 661 | 8,07 | ||||
| 2025-08-11 | 13F | WPG Advisers, LLC | 4 629 | −23,73 | 96 | −26,15 | ||||
| 2025-08-12 | 13F | Rock Creek Group, LP | 0 | −100,00 | 0 | |||||
| 2025-08-12 | 13F | Proequities, Inc. | 0 | 0 | ||||||
| 2025-08-12 | 13F | Jpmorgan Chase & Co | 30 | −93,42 | 1 | −100,00 | ||||
| 2025-08-11 | 13F | Brown Brothers Harriman & Co | 1 900 | 39 | ||||||
| 2025-07-15 | 13F | MCF Advisors LLC | 935 435 | 1,03 | 19 429 | −2,22 | ||||
| 2025-06-05 | 13F | Cim, Llc | 0 | −100,00 | 0 | |||||
| 2025-08-08 | 13F | Pnc Financial Services Group, Inc. | 970 | 0,00 | 20 | 0,00 | ||||
| 2025-07-07 | 13F | Bangor Savings Bank | 2 280 | 0,00 | 47 | −2,08 | ||||
| 2025-06-25 | NP | DPREX - Delaware Global Listed Real Assets Fund CLASS A | 152 691 | −10,44 | 3 107 | −11,13 | ||||
| 2025-08-26 | NP | TBFG - The Brinsmere Fund - Growth ETF | 371 887 | 2,54 | 7 724 | −0,76 | ||||
| 2025-08-13 | 13F | Northwestern Mutual Wealth Management Co | 2 018 914 | 22,64 | 41 933 | 18,70 | ||||
| 2025-08-14 | 13F | Ambassador Advisors, LLC | 22 979 | 2,80 | 477 | −0,42 | ||||
| 2025-08-11 | 13F | Aptus Capital Advisors, LLC | 11 545 | 0,00 | 240 | −3,24 | ||||
| 2025-08-19 | 13F/A | Pitcairn Co | 187 136 | 0,00 | 3 887 | −3,21 | ||||
| 2025-09-10 | NP | LFTEX - Lincoln Inflation Plus Fund Class I | 36 700 | 0,00 | 757 | 1,47 | ||||
| 2025-08-11 | 13F | Great Lakes Advisors, Llc | 1 454 571 | −6,30 | 30 211 | −9,31 | ||||
| 2025-08-12 | 13F | LPL Financial LLC | 144 921 | 11,20 | 3 010 | 7,65 | ||||
| 2025-08-15 | 13F | Captrust Financial Advisors | 43 885 | 39,43 | 911 | 34,96 | ||||
| 2025-08-22 | 13F | Carter Financial Group, INC. | 47 380 | 35,50 | 984 | −1,99 |