Grundläggande statistik
| Institutionella ägare | 139 total, 139 long only, 0 short only, 0 long/short - change of 0,72% MRQ |
| Genomsnittlig portföljallokering | 0.7385 % - change of −4,94% MRQ |
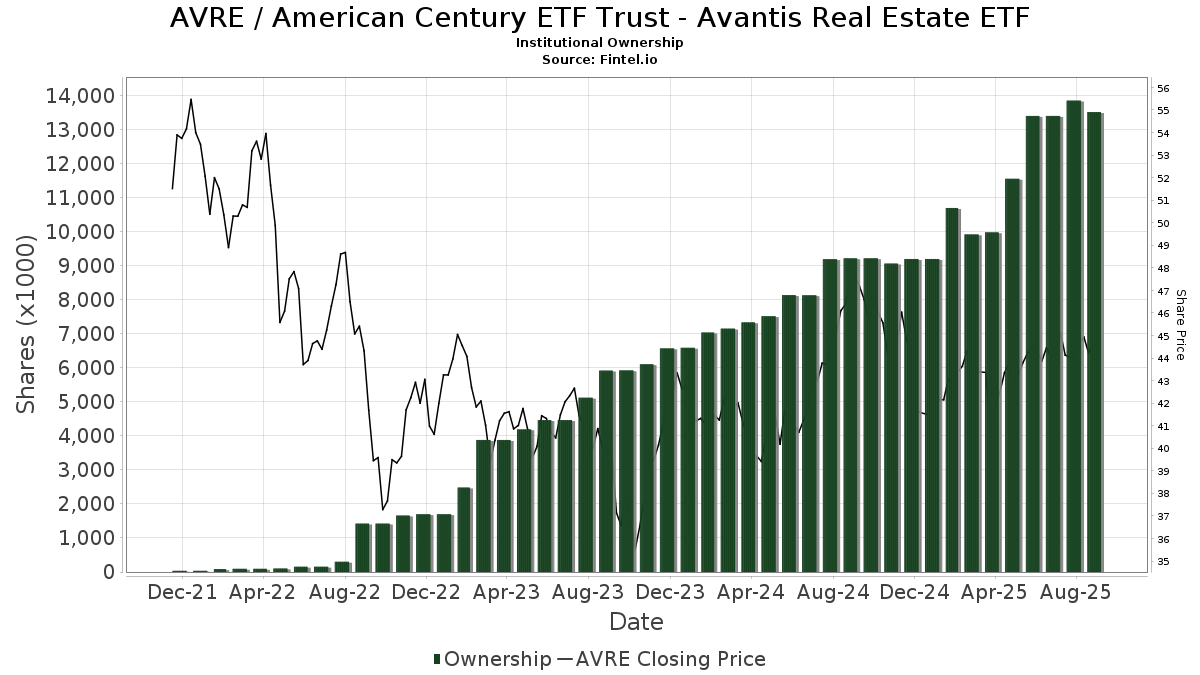
| Institutionella aktier (lång) | 13 508 726 (ex 13D/G) - change of 0,12MM shares 0,88% MRQ |
| Institutionellt värde (lång) | $ 571 073 USD ($1000) |
Institutionellt ägande och aktieägare
American Century ETF Trust - Avantis Real Estate ETF (US:AVRE) har 139 Institutionella ägare och aktieägare som har lämnat in 13D/G- eller 13F-formulär till Securities Exchange Commission (SEC). Dessa institut innehar totalt 13,508,726 aktier. Största aktieägare inkluderar Ccm Investment Group, Llc, Empowered Funds, LLC, CCMG - CCM Global Equity ETF, Hill Investment Group Partners, LLC, Quantum Financial Advisors, LLC, American Century Companies Inc, ShankerValleau Wealth Advisors, Inc., AVGE - Avantis All Equity Markets ETF, Nicolet Advisory Services, Llc, and Buckingham Strategic Partners .
American Century ETF Trust - Avantis Real Estate ETF (ARCA:AVRE) Institutionell ägarstruktur visar institutioners och fonders nuvarande positioner i företaget, samt de senaste förändringarna i positionernas storlek. Större aktieägare kan vara enskilda investerare, fonder, hedgefonder eller institutioner. Bilaga 13D visar att investeraren äger (eller ägde) mer än 5% av företaget och avser (eller avsåg) att aktivt eftersträva en förändring av affärsstrategin. Schedule 13G indikerar en passiv investering på över 5%.
The share price as of September 19, 2025 is 44,73 / share. Previously, on September 23, 2024, the share price was 47,31 / share. This represents a decline of 5,45% over that period.
Fondsentimentets poäng
Fondsentimentet poängen(fka Ägarackumulation-poäng) visar vilka aktier som är mest köpta av fonder. Det är resultatet av en sofistikerad kvantitativ flerfaktormodell som identifierar företag med de högsta nivåerna av institutionell ackumulering. Poängsättningsmodellen använder en kombination av den totala ökningen av redovisade ägare, förändringarna i portföljallokeringarna för dessa ägare och andra mått. Siffran sträcker sig från 0 till 100, där högre siffror indikerar en högre nivå av ackumulering i förhållande till sina konkurrenter, och 50 är genomsnittet.
Uppdateringsfrekvens: Dagligen
Se Ownership Explorer, som innehåller en lista över de högst rankade företagen.
AI+ Ask Fintel’s AI assistant about American Century ETF Trust - Avantis Real Estate ETF.
Thinking of good questions…
Institutionell sälj/köp-kvot
Förutom att rapportera vanliga eget kapital- och skuldemissioner måste institutioner med mer än 100MM tillgångar under förvaltning också avslöja sina innehav av sälj- och köpoptioner. Eftersom säljoptioner i allmänhet indikerar ett negativt sentiment och köpoptioner indikerar ett positivt sentiment, kan vi få en uppfattning om det övergripande institutionella sentimentet genom att plotta förhållandet mellan säljoptioner och köpoptioner. Diagrammet till höger visar det historiska förhållandet mellan sälj- och köpoptioner för detta instrument.
Genom att använda sälj/köp-kvoten som en indikator på aktieägarnas sentiment undviker man en av de största bristerna med att använda det totala institutionella ägandet, nämligen att en betydande del av de förvaltade tillgångarna investeras passivt för att följa index. Passivt förvaltade fonder köper vanligtvis inte optioner, så indikatorn för sälj/köp-kvoten ger en bättre bild av stämningen i aktivt förvaltade fonder.
13F- och NPORT-arkiveringar
Detaljer om 13F-arkiveringar är gratis. Detaljer om NP-arkiveringar kräver ett premiummedlemskap. Gröna rader indikerar nya positioner. Röda rader indikerar stängda positioner. Klicka på länk symbolen för att se hela transaktionshistoriken.
Uppgradera
för att låsa upp premiumdata och exportera till Excel ![]() .
.
| Fil Datum | Källa | Investerare | Typ | Genomsnittligt pris (beräknat) |
Aktier | Δ Aktier (%) |
Rapporterat värde (1000 USD) |
Δ Värde (%) |
Portföljallokering (%) |
|
|---|---|---|---|---|---|---|---|---|---|---|
| 2025-08-14 | 13F | Citadel Advisors Llc | 122 516 | 437,61 | 5 410 | 452,04 | ||||
| 2025-07-25 | 13F | Cwm, Llc | 195 339 | 1,77 | 9 | 0,00 | ||||
| 2025-08-06 | 13F | Valued Wealth Advisors LLC | 79 896 | 4,61 | 3 528 | 7,40 | ||||
| 2025-08-14 | 13F | Beaird Harris Wealth Management, LLC | 82 555 | −1,35 | 3 646 | 1,28 | ||||
| 2025-07-28 | 13F | Morris Financial Concepts, Inc. | 850 | 0,00 | 38 | 2,78 | ||||
| 2025-07-28 | NP | AVGE - Avantis All Equity Markets ETF | 335 323 | 9,69 | 14 835 | 10,55 | ||||
| 2025-07-23 | 13F | Quarry Hill Advisors, Llc | 116 003 | 1,63 | 5 123 | 4,34 | ||||
| 2025-07-15 | 13F | SJS Investment Consulting Inc. | 432 | −82,68 | 19 | −82,24 | ||||
| 2025-05-13 | 13F | Heck Capital Advisors, LLC | 0 | −100,00 | 0 | −100,00 | ||||
| 2025-08-05 | 13F | Avant Financial Advisors LLC | 13 363 | 5,51 | 590 | 8,46 | ||||
| 2025-08-12 | 13F | Global Retirement Partners, LLC | 16 | 1 | ||||||
| 2025-07-11 | 13F | Physician Wealth Solutions Inc. | 297 943 | −3,25 | 13 157 | −0,66 | ||||
| 2025-08-13 | 13F | Satovsky Asset Management Llc | 21 759 | −0,07 | 961 | 2,56 | ||||
| 2025-07-21 | 13F | Life Planning Partners, Inc | 29 186 | 4,10 | 1 289 | 6,89 | ||||
| 2025-08-13 | 13F | Nicolet Advisory Services, Llc | 326 364 | 7,24 | 14 239 | 16,21 | ||||
| 2025-07-16 | 13F | Signature Resources Capital Management, LLC | 57 | −98,50 | 3 | −98,77 | ||||
| 2025-08-14 | 13F | Sentinel Wealth Management, Inc. | 60 836 | 3 | ||||||
| 2025-08-05 | 13F | WorthPointe, LLC | 234 446 | −1,70 | 10 353 | 0,94 | ||||
| 2025-08-13 | 13F | Flow Traders U.s. Llc | 47 599 | 48,82 | 2 | 100,00 | ||||
| 2025-08-13 | 13F | Jones Financial Companies Lllp | 1 810 | 174,66 | 79 | 182,14 | ||||
| 2025-08-15 | 13F | Kestra Advisory Services, LLC | 6 137 | 271 | ||||||
| 2025-07-30 | NP | CCMG - CCM Global Equity ETF | 1 102 501 | −7,83 | 48 775 | −7,11 | ||||
| 2025-08-13 | 13F | Nicolet Bankshares Inc | 147 258 | 4,85 | 6 503 | 7,65 | ||||
| 2025-07-17 | 13F | Vermillion Wealth Management, Inc. | 0 | −100,00 | 0 | |||||
| 2025-08-06 | 13F | Commonwealth Equity Services, Llc | 41 341 | 5,70 | 2 | 0,00 | ||||
| 2025-08-01 | 13F | Envestnet Asset Management Inc | 179 227 | 11,19 | 7 915 | 14,17 | ||||
| 2025-08-06 | 13F | AE Wealth Management LLC | 20 450 | 92,67 | 903 | 98,03 | ||||
| 2025-08-14 | 13F | Aqr Capital Management Llc | 29 597 | 0,00 | 1 307 | 2,67 | ||||
| 2025-05-14 | 13F | Rockefeller Capital Management L.P. | 0 | −100,00 | 0 | |||||
| 2025-08-04 | 13F | Haven Private, LLC | 19 743 | −16,61 | 872 | −14,44 | ||||
| 2025-08-12 | 13F | Jpmorgan Chase & Co | 2 870 | −4,52 | 127 | −2,33 | ||||
| 2025-07-22 | 13F | Simplicity Wealth,LLC | 207 576 | 113,39 | 9 167 | 119,13 | ||||
| 2025-07-22 | 13F | DBK Financial Counsel, LLC | 53 318 | −1,30 | 2 355 | 1,33 | ||||
| 2025-08-14 | 13F | Susquehanna International Group, Llp | 18 653 | 173,18 | 824 | 180,89 | ||||
| 2025-08-12 | 13F | CIBC Private Wealth Group, LLC | 0 | −100,00 | 0 | |||||
| 2025-08-18 | NP | PACIFIC SELECT FUND - PSF DFA Balanced Allocation Portfolio Class D | 35 254 | −49,95 | 1 557 | −48,63 | ||||
| 2025-05-02 | 13F | MB Generational Wealth, LLC | 9 214 | −49,33 | 396 | −48,03 | ||||
| 2025-07-17 | 13F | Willow Creek Wealth Management Inc. | 6 890 | 2,18 | 304 | 4,83 | ||||
| 2025-07-22 | 13F | SOL Capital Management CO | 43 737 | −5,14 | 2 | 0,00 | ||||
| 2025-07-08 | 13F | Apella Capital, LLC | 27 757 | −1,10 | 1 224 | 6,99 | ||||
| 2025-07-18 | 13F | Magnolia Private Wealth, LLC | 9 892 | 84,14 | 437 | 88,74 | ||||
| 2025-07-22 | 13F | HFM Investment Advisors, LLC | 74 | 10,45 | 3 | 50,00 | ||||
| 2025-07-31 | 13F | Buckingham Strategic Partners | 322 564 | 464,44 | 14 244 | 479,73 | ||||
| 2025-07-15 | 13F | Evanson Asset Management, LLC | 5 758 | 0,72 | 254 | 3,67 | ||||
| 2025-07-08 | 13F | ShankerValleau Wealth Advisors, Inc. | 337 781 | 2,10 | 14 916 | 4,84 | ||||
| 2025-08-08 | 13F | Pacific Life Fund Advisors LLC | 35 254 | −49,95 | 1 557 | −48,63 | ||||
| 2025-04-18 | 13F | Global Trust Asset Management, LLC | 0 | −100,00 | 0 | |||||
| 2025-08-12 | 13F | Pfc Capital Group, Inc. | 500 | 0,00 | 0 | |||||
| 2025-08-12 | 13F | BWM Planning, LLC | 8 367 | −34,10 | 369 | −32,42 | ||||
| 2025-07-16 | 13F | TCI Wealth Advisors, Inc. | 22 943 | 1 013 | ||||||
| 2025-05-12 | 13F | Ccm Investment Group, Llc | 1 200 779 | 1,39 | 51 427 | 4,23 | ||||
| 2025-08-29 | 13F | Evolution Wealth Management Inc. | 97 | 4 | ||||||
| 2025-04-24 | 13F | Aspect Partners, LLC | 0 | −100,00 | 0 | |||||
| 2025-07-31 | 13F | Curio Wealth, Llc | 5 326 | 48 318,18 | 235 | 11,37 | ||||
| 2025-08-08 | 13F | Tortoise Investment Management, LLC | 3 925 | 0,00 | 173 | 2,98 | ||||
| 2025-08-14 | 13F | Ariadne Wealth Management, LP | 8 332 | 0,01 | 369 | 1,10 | ||||
| 2025-08-08 | 13F | Good Life Advisors, LLC | 8 419 | 3,36 | 372 | 6,00 | ||||
| 2025-08-18 | 13F | N.E.W. Advisory Services LLC | 23 | −20,69 | 1 | 0,00 | ||||
| 2025-08-05 | 13F | Cherry Tree Wealth Management, LLC | 517 | −17,28 | 23 | −15,38 | ||||
| 2025-07-25 | 13F | Sequoia Financial Advisors, LLC | 124 584 | −0,12 | 5 502 | 2,55 | ||||
| 2025-08-11 | 13F | Synergy Investment Management, LLC | 0 | −100,00 | 0 | |||||
| 2025-08-13 | 13F | Northwestern Mutual Wealth Management Co | 12 560 | 248,31 | 555 | 257,42 | ||||
| 2025-08-14 | 13F | UBS Group AG | 1 039 | 0,00 | 46 | 2,27 | ||||
| 2025-08-01 | 13F | Equita Financial Network, Inc. | 169 789 | −6,68 | 7 498 | −4,19 | ||||
| 2025-07-15 | 13F | Armis Advisers, LLC | 5 913 | −6,48 | 261 | −3,69 | ||||
| 2025-07-18 | 13F | Fmb Wealth Management | 5 800 | 10,12 | 256 | 13,27 | ||||
| 2025-07-28 | 13F | Harbour Investments, Inc. | 0 | −100,00 | 0 | |||||
| 2025-08-25 | 13F | BLVD Private Wealth, LLC | 39 054 | 1 725 | ||||||
| 2025-07-03 | 13F | Collective Family Office Llc | 101 653 | −7,78 | 4 489 | −5,34 | ||||
| 2025-07-16 | 13F | Leading Edge Financial Planning LLC | 126 027 | 21,04 | 5 565 | 24,27 | ||||
| 2025-07-21 | 13F | Creative Capital Management Investments LLC | 565 | 0,00 | 25 | 0,00 | ||||
| 2025-07-28 | NP | AVMA - Avantis Moderate Allocation ETF | 12 290 | −6,69 | 544 | −6,06 | ||||
| 2025-08-14 | 13F | Jane Street Group, Llc | 31 958 | −30,15 | 1 411 | −28,27 | ||||
| 2025-07-29 | 13F | Chicago Partners Investment Group LLC | 94 015 | −0,10 | 4 242 | 2,94 | ||||
| 2025-07-30 | 13F | Jackson Thornton Asset Management, Llc | 5 985 | 0,00 | 263 | 3,54 | ||||
| 2025-08-12 | 13F | LPL Financial LLC | 179 963 | 18,08 | 7 947 | 21,24 | ||||
| 2025-08-12 | 13F | Park Square Financial Group, LLC | 3 474 | 389,30 | 153 | 410,00 | ||||
| 2025-07-30 | 13F | Clune & Associates, Ltd. | 4 985 | 5,55 | 220 | 8,37 | ||||
| 2025-08-11 | 13F | Avantax Planning Partners, Inc. | 5 538 | 245 | ||||||
| 2025-07-17 | 13F | Poinciana Advisors Group, Llc | 14 313 | −4,25 | 632 | −1,56 | ||||
| 2025-08-14 | 13F | Cardiff Park Advisors, Llc | 51 481 | −11,41 | 2 273 | −9,04 | ||||
| 2025-07-03 | 13F | Lam Group, Inc. | 89 120 | −15,30 | 3 936 | −13,04 | ||||
| 2025-08-12 | 13F | Burk Holdings LLC | 62 323 | −2,01 | 2 752 | 0,62 | ||||
| 2025-09-04 | 13F/A | Advisor Group Holdings, Inc. | 25 668 | −12,25 | 1 133 | −9,94 | ||||
| 2025-08-08 | 13F | Creative Planning | 27 273 | 0,18 | 1 204 | 2,91 | ||||
| 2025-08-07 | 13F | Nwam Llc | 4 903 | −6,13 | 217 | −3,57 | ||||
| 2025-07-29 | 13F | Werba Rubin Papier Wealth Management | 22 553 | −3,84 | 996 | −1,29 | ||||
| 2025-07-14 | 13F | Park Avenue Securities Llc | 88 126 | 13,37 | 4 | 0,00 | ||||
| 2025-08-01 | 13F | Red Lighthouse Investment Management, Llc | 61 996 | −21,40 | 2 738 | −17,91 | ||||
| 2025-08-14 | 13F | Aprio Wealth Management, LLC | 60 957 | −13,35 | 2 692 | −11,04 | ||||
| 2025-07-10 | 13F | Waypoint Wealth Partners Inc. | 34 746 | −1,04 | 1 534 | 1,59 | ||||
| 2025-07-24 | 13F | IFP Advisors, Inc | 1 | −99,98 | 0 | −100,00 | ||||
| 2025-08-12 | 13F | Proequities, Inc. | 0 | 0 | ||||||
| 2025-07-21 | 13F/A | Abacus Planning Group, Inc. | 5 631 | 0,27 | 249 | 2,90 | ||||
| 2025-08-14 | 13F | Mml Investors Services, Llc | 61 291 | 13,37 | 3 | 0,00 | ||||
| 2025-07-11 | 13F | Quantum Financial Advisors, LLC | 362 799 | −0,86 | 16 021 | 1,80 | ||||
| 2025-08-11 | 13F | Empowered Funds, LLC | 1 124 974 | −6,34 | 49 679 | −3,84 | ||||
| 2025-08-08 | 13F | Austin Wealth Management, LLC | 121 431 | 63,97 | 5 286 | 67,35 | ||||
| 2025-08-14 | 13F | Colony Group, LLC | 307 010 | 0,99 | 13 558 | 3,69 | ||||
| 2025-07-24 | 13F | Ronald Blue Trust, Inc. | 1 291 | 0,00 | 57 | 3,64 | ||||
| 2025-07-11 | 13F | Farther Finance Advisors, LLC | 237 | 10 | ||||||
| 2025-07-24 | 13F | Morton Brown Family Wealth, LLC | 9 769 | 3,95 | 431 | 6,68 | ||||
| 2025-07-17 | 13F | LexAurum Advisors, LLC | 199 629 | 46,96 | 8 816 | 50,89 | ||||
| 2025-07-28 | 13F | Axxcess Wealth Management, Llc | 20 090 | 9,95 | 887 | 12,99 | ||||
| 2025-08-06 | 13F | Entrewealth, Llc | 23 305 | 58,26 | 1 029 | 62,56 | ||||
| 2025-08-13 | 13F | Parkworth Wealth Management, Inc. | 20 386 | 0,85 | 900 | 3,57 | ||||
| 2025-07-18 | 13F | Dogwood Wealth Management LLC | 141 | −17,54 | 6 | −14,29 | ||||
| 2025-07-30 | 13F | Strategic Blueprint, LLC | 133 403 | 8,33 | 5 891 | 11,23 | ||||
| 2025-08-08 | 13F | Capstone Financial Advisors, Inc. | 305 545 | 9,03 | 13 493 | 11,94 | ||||
| 2025-08-07 | 13F | Resources Investment Advisors, LLC. | 98 661 | −15,78 | 4 357 | −13,54 | ||||
| 2025-07-23 | 13F | HTG Investment Advisors, Inc. | 66 304 | 8,18 | 2 928 | 11,08 | ||||
| 2025-07-24 | 13F | Endeavor Private Wealth, Inc. | 11 501 | 17,92 | 508 | 21,00 | ||||
| 2025-07-29 | 13F | Flagstone Financial Management | 24 437 | 7,36 | 1 079 | 10,33 | ||||
| 2025-07-22 | 13F | Wealthcare Advisory Partners LLC | 72 436 | −15,79 | 3 199 | −13,54 | ||||
| 2025-08-14 | 13F | Mercer Global Advisors Inc /adv | 40 066 | −65,27 | 1 769 | −64,34 | ||||
| 2025-07-14 | 13F | Parkshore Wealth Management, Inc. | 58 689 | −16,28 | 2 592 | −14,06 | ||||
| 2025-07-25 | 13F | Hazlett, Burt & Watson, Inc. | 16 | 0,00 | 0 | |||||
| 2025-08-14 | 13F | Wells Fargo & Company/mn | 216 | 0,00 | 10 | 0,00 | ||||
| 2025-07-11 | 13F | Sprinkle Financial Consultants LLC | 32 849 | −7,72 | 1 451 | −5,29 | ||||
| 2025-05-13 | 13F | EverSource Wealth Advisors, LLC | 0 | −100,00 | 0 | |||||
| 2025-07-21 | 13F | Keb Asset Management, Llc | 10 790 | 66,64 | 476 | 71,22 | ||||
| 2025-07-16 | 13F | Prairiewood Capital, LLC | 234 465 | 3,75 | 10 354 | 6,51 | ||||
| 2025-07-24 | 13F | WMG Financial Advisors, LLC | 94 357 | −3,00 | 4 167 | −0,41 | ||||
| 2025-08-14 | 13F | Mariner, LLC | 12 730 | 8,92 | 562 | 11,95 | ||||
| 2025-08-14 | 13F | CoreCap Advisors, LLC | 16 062 | 21,55 | 709 | 24,82 | ||||
| 2025-08-15 | 13F | CI Private Wealth, LLC | 169 888 | −25,64 | 7 502 | −23,65 | ||||
| 2025-07-10 | 13F | Cypress Point Wealth Management, LLC | 7 368 | 1,15 | 325 | 3,83 | ||||
| 2025-08-11 | 13F | Aptus Capital Advisors, LLC | 185 | 1,09 | 8 | 14,29 | ||||
| 2025-07-23 | 13F | Allegiance Financial Group Advisory Services LLC | 249 747 | 8,54 | 11 029 | 11,44 | ||||
| 2025-07-29 | NP | EBI - Longview Advantage ETF | 0 | −100,00 | 0 | −100,00 | ||||
| 2025-07-15 | 13F | Level Financial Advisors, Inc. | 157 087 | −0,41 | 6 937 | 2,24 | ||||
| 2025-08-12 | 13F | American Century Companies Inc | 347 779 | 7,24 | 15 358 | 10,11 | ||||
| 2025-07-30 | 13F | Forum Financial Management, LP | 40 874 | 15,61 | 1 805 | 18,68 | ||||
| 2025-08-07 | 13F | PCG Wealth Advisors, LLC | 0 | −100,00 | 0 | |||||
| 2025-08-15 | 13F | North Ridge Wealth Advisors, Inc. | 103 133 | 0,29 | 4 554 | 2,99 | ||||
| 2025-08-14 | 13F | Financial Engines Advisors L.L.C. | 16 116 | 22,77 | 712 | 26,02 | ||||
| 2025-07-08 | 13F | Henrickson Nauta Wealth Advisors, Inc. | 14 672 | 0,00 | 648 | 9,66 | ||||
| 2025-07-15 | 13F | Vestment Financial LLC | 128 539 | 7,75 | 5 698 | 10,45 | ||||
| 2025-08-04 | 13F | Arcadia Wealth Management, Inc. | 52 427 | 3,26 | 2 315 | 6,05 | ||||
| 2025-07-17 | 13F | SC&H Financial Advisors, Inc. | 26 838 | 5,13 | 1 185 | 8,02 | ||||
| 2025-08-11 | 13F | Diversified Portfolios, Inc. | 20 178 | 178,78 | 891 | 186,50 | ||||
| 2025-08-12 | 13F | Hill Investment Group Partners, LLC | 736 986 | −4,21 | 32 545 | −1,65 | ||||
| 2025-07-23 | 13F | REAP Financial Group, LLC | 155 | 0,00 | 7 | 0,00 | ||||
| 2025-08-13 | 13F | GeoWealth Management, LLC | 23 363 | −2,53 | 1 032 | 0,10 | ||||
| 2025-07-14 | 13F | BetterWealth, LLC | 314 040 | 2,47 | 13 868 | 5,22 | ||||
| 2025-07-09 | 13F | Seaside Wealth Management, Inc. | 229 823 | 3,81 | 10 149 | 6,59 | ||||
| 2025-08-08 | 13F | Larson Financial Group LLC | 49 | −99,57 | 2 | −99,59 | ||||
| 2025-07-30 | 13F | Bayshore Asset Management, Llc | 23 556 | 95,00 | 1 040 | 100,39 | ||||
| 2025-08-13 | 13F | B&D White Capital Company, LLC | 10 681 | 472 | ||||||
| 2025-08-07 | 13F | Allworth Financial LP | 0 | −100,00 | 0 | |||||
| 2025-08-14 | 13F | Old Mission Capital Llc | 0 | −100,00 | 0 | |||||
| 2025-08-15 | 13F | Morgan Stanley | 138 | −0,72 | 6 | 20,00 | ||||
| 2025-08-06 | 13F | Garrison Point Advisors, Llc | 7 574 | 0,73 | 334 | 3,41 |