Grundläggande statistik
| Institutionella ägare | 151 total, 151 long only, 0 short only, 0 long/short - change of 1,32% MRQ |
| Genomsnittlig portföljallokering | 0.1590 % - change of 27,31% MRQ |
| Institutionella aktier (lång) | 4 638 404 (ex 13D/G) - change of 0,15MM shares 3,35% MRQ |
| Institutionellt värde (lång) | $ 175 059 USD ($1000) |
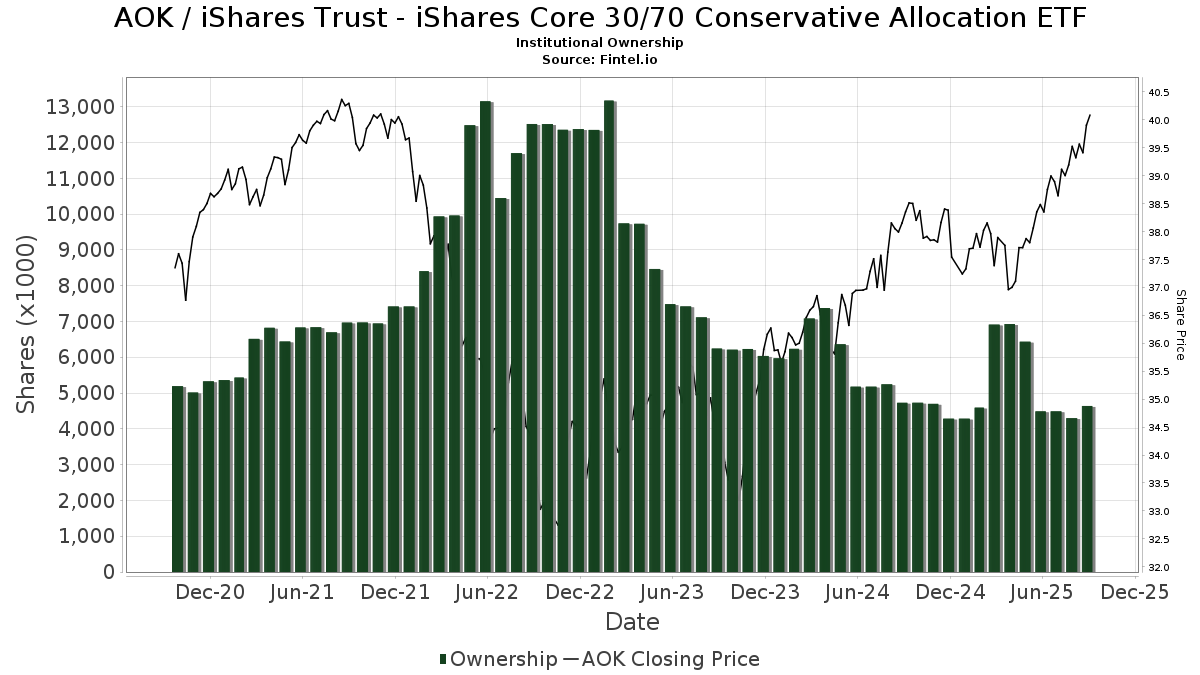
Institutionellt ägande och aktieägare
iShares Trust - iShares Core 30/70 Conservative Allocation ETF (US:AOK) har 151 Institutionella ägare och aktieägare som har lämnat in 13D/G- eller 13F-formulär till Securities Exchange Commission (SEC). Dessa institut innehar totalt 4,638,404 aktier. Största aktieägare inkluderar LPL Financial LLC, BlackRock, Inc., Curran Financial Partners, LLC, Elevation Capital Advisory, LLC, Win Advisors, Inc, Morgan Stanley, Lido Advisors, LLC, Envestnet Asset Management Inc, Visionary Wealth Advisors, and Weaver Consulting Group .
iShares Trust - iShares Core 30/70 Conservative Allocation ETF (ARCA:AOK) Institutionell ägarstruktur visar institutioners och fonders nuvarande positioner i företaget, samt de senaste förändringarna i positionernas storlek. Större aktieägare kan vara enskilda investerare, fonder, hedgefonder eller institutioner. Bilaga 13D visar att investeraren äger (eller ägde) mer än 5% av företaget och avser (eller avsåg) att aktivt eftersträva en förändring av affärsstrategin. Schedule 13G indikerar en passiv investering på över 5%.
The share price as of September 17, 2025 is 40,08 / share. Previously, on September 18, 2024, the share price was 38,35 / share. This represents an increase of 4,51% over that period.
Fondsentimentets poäng
Fondsentimentet poängen(fka Ägarackumulation-poäng) visar vilka aktier som är mest köpta av fonder. Det är resultatet av en sofistikerad kvantitativ flerfaktormodell som identifierar företag med de högsta nivåerna av institutionell ackumulering. Poängsättningsmodellen använder en kombination av den totala ökningen av redovisade ägare, förändringarna i portföljallokeringarna för dessa ägare och andra mått. Siffran sträcker sig från 0 till 100, där högre siffror indikerar en högre nivå av ackumulering i förhållande till sina konkurrenter, och 50 är genomsnittet.
Uppdateringsfrekvens: Dagligen
Se Ownership Explorer, som innehåller en lista över de högst rankade företagen.
Institutionell sälj/köp-kvot
Förutom att rapportera vanliga eget kapital- och skuldemissioner måste institutioner med mer än 100MM tillgångar under förvaltning också avslöja sina innehav av sälj- och köpoptioner. Eftersom säljoptioner i allmänhet indikerar ett negativt sentiment och köpoptioner indikerar ett positivt sentiment, kan vi få en uppfattning om det övergripande institutionella sentimentet genom att plotta förhållandet mellan säljoptioner och köpoptioner. Diagrammet till höger visar det historiska förhållandet mellan sälj- och köpoptioner för detta instrument.
Genom att använda sälj/köp-kvoten som en indikator på aktieägarnas sentiment undviker man en av de största bristerna med att använda det totala institutionella ägandet, nämligen att en betydande del av de förvaltade tillgångarna investeras passivt för att följa index. Passivt förvaltade fonder köper vanligtvis inte optioner, så indikatorn för sälj/köp-kvoten ger en bättre bild av stämningen i aktivt förvaltade fonder.
13F- och NPORT-arkiveringar
Detaljer om 13F-arkiveringar är gratis. Detaljer om NP-arkiveringar kräver ett premiummedlemskap. Gröna rader indikerar nya positioner. Röda rader indikerar stängda positioner. Klicka på länk symbolen för att se hela transaktionshistoriken.
Uppgradera
för att låsa upp premiumdata och exportera till Excel ![]() .
.
| Fil Datum | Källa | Investerare | Typ | Genomsnittligt pris (beräknat) |
Aktier | Δ Aktier (%) |
Rapporterat värde (1000 USD) |
Δ Värde (%) |
Portföljallokering (%) |
|
|---|---|---|---|---|---|---|---|---|---|---|
| 2025-08-14 | 13F | Valley Financial Group, Inc. | 12 442 | −2,64 | 486 | 1,25 | ||||
| 2025-07-22 | 13F | BridgePort Financial Solutions, LLC | 6 988 | 0,00 | 273 | 4,20 | ||||
| 2025-07-29 | 13F | Elevation Capital Advisory, LLC | 237 005 | 9 260 | ||||||
| 2025-07-31 | 13F | Buckingham Strategic Partners | 8 217 | 321 | ||||||
| 2025-07-31 | 13F | Prentice Wealth Management LLC | 0 | −100,00 | 0 | |||||
| 2025-08-06 | 13F | Golden State Wealth Management, LLC | 2 643 | 103 | ||||||
| 2025-08-12 | 13F | Steward Partners Investment Advisory, Llc | 908 | 33,14 | 35 | 40,00 | ||||
| 2025-08-12 | 13F | Coston, McIsaac & Partners | 449 | 0,67 | 0 | |||||
| 2025-08-12 | 13F | Gladstone Institutional Advisory LLC | 49 058 | −1,64 | 1 917 | 2,13 | ||||
| 2025-08-14 | 13F | Raymond James Financial Inc | 78 259 | 46,25 | 3 058 | 51,86 | ||||
| 2025-08-01 | 13F | Redmond Asset Management, LLC | 7 960 | −1,24 | 311 | 2,31 | ||||
| 2025-07-25 | 13F | Investment Advisory Group, LLC | 141 643 | −2,02 | 5 534 | 1,71 | ||||
| 2025-07-07 | 13F | RDA Financial Network | 20 066 | −2,31 | 784 | 1,42 | ||||
| 2025-08-14 | 13F | Mariner, LLC | 33 320 | 0,02 | 1 302 | 3,83 | ||||
| 2025-08-11 | 13F | Delta Asset Management Llc/tn | 561 | −6,50 | 22 | −4,55 | ||||
| 2025-08-13 | 13F | Twin Peaks Wealth Advisors, LLC | 0 | 0 | ||||||
| 2025-08-07 | 13F/A | Joseph Group Capital Management | 0 | −100,00 | 0 | |||||
| 2025-07-29 | 13F | Chicago Partners Investment Group LLC | 7 325 | 0,66 | 286 | 4,38 | ||||
| 2025-04-21 | 13F | Janney Capital Management LLC | 0 | −100,00 | 0 | |||||
| 2025-08-13 | 13F | Northwestern Mutual Wealth Management Co | 650 | 54,39 | 25 | 66,67 | ||||
| 2025-07-24 | 13F | JNBA Financial Advisors | 0 | −100,00 | 0 | |||||
| 2025-08-11 | 13F | Tidemark, LLC | 551 | 0,00 | 22 | 5,00 | ||||
| 2025-08-11 | 13F | Rothschild Investment Llc | 0 | −100,00 | 0 | |||||
| 2025-05-08 | 13F | BRYN MAWR TRUST Co | 0 | −100,00 | 0 | |||||
| 2025-08-06 | 13F | Prospera Financial Services Inc | 13 115 | −13,27 | 512 | −10,02 | ||||
| 2025-08-14 | 13F | Susquehanna International Group, Llp | 23 513 | 219,77 | 919 | 232,61 | ||||
| 2025-07-23 | 13F | WestEnd Advisors, LLC | 476 | 19 | ||||||
| 2025-07-31 | 13F | Cambridge Investment Research Advisors, Inc. | 82 169 | −7,76 | 3 | 0,00 | ||||
| 2025-08-08 | 13F | Pnc Financial Services Group, Inc. | 2 344 | 0,69 | 92 | 4,60 | ||||
| 2025-08-14 | 13F | Glen Eagle Advisors, LLC | 1 873 | −0,90 | 73 | 2,82 | ||||
| 2025-05-05 | 13F | WNY Asset Management, LLC | 0 | −100,00 | 0 | |||||
| 2025-08-12 | 13F | Weaver Consulting Group | 142 849 | −2,54 | 5 581 | 1,20 | ||||
| 2025-08-12 | 13F | Waterloo Capital, L.P. | 10 664 | 17,78 | 417 | 22,35 | ||||
| 2025-08-07 | 13F | Verus Capital Partners, Llc | 7 195 | −6,78 | 281 | −3,10 | ||||
| 2025-07-22 | 13F | Bay Harbor Wealth Management, LLC | 3 163 | −0,22 | 124 | 3,36 | ||||
| 2025-07-15 | 13F | Well Done, LLC | 6 748 | 0,00 | 264 | 4,78 | ||||
| 2025-08-06 | 13F | Moors & Cabot, Inc. | 10 697 | 418 | ||||||
| 2025-07-15 | 13F | Retireful, LLC | 0 | −100,00 | 0 | |||||
| 2025-08-12 | 13F | MAI Capital Management | 1 826 | 0,66 | 71 | 4,41 | ||||
| 2025-08-14 | 13F | Mml Investors Services, Llc | 18 401 | 123,53 | 1 | |||||
| 2025-08-14 | 13F | Goldman Sachs Group Inc | 17 660 | −44,74 | 690 | −42,68 | ||||
| 2025-08-07 | 13F | Runnymede Capital Advisors, Inc. | 0 | −100,00 | 0 | −100,00 | ||||
| 2025-07-07 | 13F | Horizons Wealth Management | 152 | 0,00 | 6 | 0,00 | ||||
| 2025-08-04 | 13F | Spire Wealth Management | 7 112 | 0,00 | 278 | 3,75 | ||||
| 2025-08-01 | 13F | Envestnet Asset Management Inc | 156 933 | 254,07 | 6 131 | 267,79 | ||||
| 2025-05-13 | 13F | United Capital Financial Advisers, Llc | 0 | −100,00 | 0 | |||||
| 2025-07-14 | 13F | AdvisorNet Financial, Inc | 846 | −13,76 | 33 | −8,33 | ||||
| 2025-05-12 | 13F | Aveo Capital Partners, LLC | 0 | −100,00 | 0 | |||||
| 2025-07-11 | 13F | SILVER OAK SECURITIES, Inc | 11 779 | 21,56 | 460 | 26,37 | ||||
| 2025-08-14 | 13F | Citadel Advisors Llc | 6 642 | 260 | ||||||
| 2025-05-13 | 13F | Forefront Analytics, LLC | 0 | −100,00 | 0 | |||||
| 2025-08-14 | 13F | Comerica Bank | 2 001 | 25,53 | 78 | 32,20 | ||||
| 2025-04-29 | 13F | Mills Wealth Advisors LLC | 0 | −100,00 | 0 | |||||
| 2025-08-08 | 13F | Cetera Investment Advisers | 71 090 | −4,00 | 2 777 | −0,32 | ||||
| 2025-08-13 | 13F | Nicolet Advisory Services, Llc | 7 164 | 0,51 | 279 | 7,72 | ||||
| 2025-07-22 | 13F | HFM Investment Advisors, LLC | 574 | 1,59 | 22 | 4,76 | ||||
| 2025-08-14 | 13F | Federation des caisses Desjardins du Quebec | 10 989 | 0,00 | 429 | 3,87 | ||||
| 2025-08-11 | 13F | TD Waterhouse Canada Inc. | 1 574 | −2,66 | 61 | 0,00 | ||||
| 2025-08-14 | 13F | Wells Fargo & Company/mn | 129 621 | 1,88 | 5 064 | 5,79 | ||||
| 2025-08-12 | 13F | LPL Financial LLC | 450 750 | −4,23 | 17 611 | −0,56 | ||||
| 2025-07-10 | 13F | Wealth Enhancement Advisory Services, Llc | 5 694 | −53,13 | 222 | −51,64 | ||||
| 2025-07-10 | 13F | Kmg Fiduciary Partners, Llc | 31 315 | 9,08 | 1 223 | 13,24 | ||||
| 2025-08-12 | 13F | J.w. Cole Advisors, Inc. | 40 994 | 1,34 | 1 602 | 5,19 | ||||
| 2025-05-15 | 13F | Eight 31 Financial Llc | 0 | −100,00 | 0 | |||||
| 2025-07-11 | 13F | Farther Finance Advisors, LLC | 997 | 0,81 | 39 | 2,70 | ||||
| 2025-07-22 | 13F | Unique Wealth, Llc | 12 337 | 482 | ||||||
| 2025-07-21 | 13F | Curran Financial Partners, LLC | 252 063 | −38,07 | 9 848 | −35,70 | ||||
| 2025-08-14 | 13F | Win Advisors, Inc | 219 617 | 8 580 | ||||||
| 2025-08-08 | 13F | Hartland & Co., LLC | 15 | 0,00 | 1 | |||||
| 2025-08-05 | 13F | Bank Of Montreal /can/ | 8 463 | 0,00 | 331 | 3,77 | ||||
| 2025-08-08 | 13F | IMA Wealth, Inc. | 7 212 | 4,20 | 267 | 8,13 | ||||
| 2025-08-12 | 13F | Archer Investment Corp | 617 | 11,57 | 24 | 20,00 | ||||
| 2025-08-14 | 13F | First Commonwealth Financial Corp /pa/ | 7 000 | 0,00 | 273 | 3,80 | ||||
| 2025-08-14 | 13F | Sentinus, LLC | 49 517 | 34,85 | 1 935 | 40,04 | ||||
| 2025-08-11 | 13F | FSA Wealth Management LLC | 288 | 0,00 | 11 | 10,00 | ||||
| 2025-08-14 | 13F | Ausdal Financial Partners, Inc. | 14 632 | 0,32 | 572 | 4,20 | ||||
| 2025-08-13 | 13F/A | StoneX Group Inc. | 0 | −100,00 | 0 | −100,00 | ||||
| 2025-05-15 | 13F | Centaurus Financial, Inc. | 0 | −100,00 | 0 | |||||
| 2025-08-18 | 13F | N.E.W. Advisory Services LLC | 797 | −49,94 | 31 | −47,46 | ||||
| 2025-08-07 | 13F | Wealth Forward, LLC | 17 252 | −1,64 | 674 | 2,12 | ||||
| 2025-07-22 | 13F | Mascoma Wealth Management LLC | 183 | 0,00 | 7 | 16,67 | ||||
| 2025-05-12 | 13F | Kohmann Bosshard Financial Services, LLC | 0 | −100,00 | 0 | |||||
| 2025-08-14 | 13F | Stifel Financial Corp | 24 997 | 1,17 | 977 | 5,06 | ||||
| 2025-09-04 | 13F/A | Advisor Group Holdings, Inc. | 39 605 | 0,82 | 1 548 | 4,67 | ||||
| 2025-07-21 | 13F | Ameritas Advisory Services, LLC | 1 097 | −99,34 | 43 | −99,33 | ||||
| 2025-07-25 | 13F | Cwm, Llc | 9 621 | −1,03 | 0 | |||||
| 2025-08-12 | 13F | Jpmorgan Chase & Co | 0 | −100,00 | 0 | −100,00 | ||||
| 2025-07-28 | 13F | Harbour Investments, Inc. | 30 343 | 8,98 | 1 185 | 13,18 | ||||
| 2025-08-05 | 13F | Integrity Financial Corp /WA | 5 438 | −10,15 | 212 | −6,61 | ||||
| 2025-07-29 | 13F | Aspiriant, Llc | 8 060 | 315 | ||||||
| 2025-07-18 | 13F | Trilogy Capital Inc. | 5 833 | −95,12 | 228 | −94,96 | ||||
| 2025-08-11 | 13F | Aptus Capital Advisors, LLC | 601 | 0,00 | 23 | 4,55 | ||||
| 2025-08-14 | 13F | Ameriprise Financial Inc | 44 751 | −31,78 | 1 748 | −29,17 | ||||
| 2025-05-01 | 13F | Diversify Wealth Management, Llc | 0 | −100,00 | 0 | |||||
| 2025-07-25 | 13F | Atria Wealth Solutions, Inc. | 18 555 | −37,06 | 725 | −34,72 | ||||
| 2025-05-15 | 13F/A | Orion Portfolio Solutions, LLC | 6 887 | 0,79 | 259 | 1,97 | ||||
| 2025-08-12 | 13F | Proequities, Inc. | 0 | 0 | ||||||
| 2025-04-23 | 13F | VisionPoint Advisory Group, LLC | 0 | −100,00 | 0 | |||||
| 2025-07-16 | 13F | Dakota Wealth Management | 0 | −100,00 | 0 | |||||
| 2025-08-15 | 13F | CI Private Wealth, LLC | 35 956 | 0,25 | 1 405 | 4,08 | ||||
| 2025-08-13 | 13F | Lido Advisors, LLC | 166 139 | −8,75 | 6 491 | −5,25 | ||||
| 2025-07-15 | 13F | Legacy Financial Group LLC | 8 582 | 0,88 | 335 | 4,69 | ||||
| 2025-07-17 | 13F | Sound Income Strategies, LLC | 912 | 36 | ||||||
| 2025-07-08 | 13F | Nbc Securities, Inc. | 575 | 0,00 | 0 | |||||
| 2025-08-13 | 13F | Mount Yale Investment Advisors, LLC | 332 | 13 | ||||||
| 2025-08-14 | 13F | Fmr Llc | 705 | 29,60 | 28 | 35,00 | ||||
| 2025-08-07 | 13F | Lakeridge Wealth Management LLC | 0 | −100,00 | 0 | |||||
| 2025-04-29 | 13F | Truist Financial Corp | 0 | −100,00 | 0 | |||||
| 2025-08-14 | 13F | Harwood Advisory Group, LLC | 7 699 | −22,11 | 301 | −18,48 | ||||
| 2025-08-08 | 13F | Thrive Capital Management, LLC | 34 017 | 1 329 | ||||||
| 2025-08-05 | 13F | EPG Wealth Management LLC | 0 | −100,00 | 0 | |||||
| 2025-08-08 | 13F | Foundations Investment Advisors, LLC | 79 438 | 4,68 | 3 104 | 8,69 | ||||
| 2025-08-08 | 13F | Avantax Advisory Services, Inc. | 8 169 | 44,58 | 319 | 50,47 | ||||
| 2025-08-13 | 13F | Plan Group Financial, LLC | 10 313 | 0,40 | 403 | 4,15 | ||||
| 2025-08-11 | 13F | Cornerstone Planning Group LLC | 1 175 | 3,98 | 46 | 9,76 | ||||
| 2025-08-14 | 13F | Brinker Capital Investments, LLC | 0 | −100,00 | 0 | |||||
| 2025-04-17 | 13F | Janney Montgomery Scott LLC | 0 | −100,00 | 0 | |||||
| 2025-08-14 | 13F | Bank Of America Corp /de/ | 123 074 | 15,41 | 4 809 | 19,81 | ||||
| 2025-08-04 | 13F | Creative Financial Designs Inc /adv | 9 084 | 5,52 | 355 | 9,60 | ||||
| 2025-07-16 | 13F | Congress Asset Management Co /ma | 50 155 | −68,49 | 1 960 | −67,29 | ||||
| 2025-08-07 | 13F | CENTRAL TRUST Co | 839 | −80,09 | 33 | −79,75 | ||||
| 2025-08-14 | 13F | Price T Rowe Associates Inc /md/ | 0 | −100,00 | 0 | |||||
| 2025-08-06 | 13F | Modera Wealth Management, LLC | 16 537 | 0,00 | 646 | 3,86 | ||||
| 2025-08-18 | 13F | Geneos Wealth Management Inc. | 904 | 0,00 | 35 | 2,94 | ||||
| 2025-08-15 | 13F | Equitable Holdings, Inc. | 15 669 | −17,02 | 612 | −13,80 | ||||
| 2025-04-23 | 13F | Mascagni Wealth Management, Inc. | 0 | −100,00 | 0 | −100,00 | ||||
| 2025-07-31 | 13F | Insight Wealth Partners, LLC | 9 401 | 0,00 | 367 | 3,97 | ||||
| 2025-07-24 | 13F | IFP Advisors, Inc | 5 418 | 0,37 | 212 | 3,94 | ||||
| 2025-07-25 | 13F | Transcendent Capital Group LLC | 5 877 | 230 | ||||||
| 2025-07-29 | 13F | Private Trust Co Na | 300 | 12 | ||||||
| 2025-07-15 | 13F | RTD Financial Advisors, Inc. | 9 099 | 1,14 | 355 | 5,03 | ||||
| 2025-08-11 | 13F | Private Advisor Group, LLC | 37 798 | 137,96 | 1 477 | 147,24 | ||||
| 2025-08-14 | 13F | Royal Bank Of Canada | 30 390 | 65,96 | 1 188 | 72,42 | ||||
| 2025-08-12 | 13F | SRS Capital Advisors, Inc. | 1 619 | −7,01 | 63 | −3,08 | ||||
| 2025-08-15 | 13F | Kestra Advisory Services, LLC | 8 427 | 3,10 | 329 | 7,17 | ||||
| 2025-08-14 | 13F | Warren Averett Asset Management, LLC | 22 306 | 4,54 | 871 | 8,60 | ||||
| 2025-08-11 | 13F | Principal Securities, Inc. | 3 541 | 138 | ||||||
| 2025-05-14 | 13F | Jane Street Group, Llc | 0 | −100,00 | 0 | |||||
| 2025-07-01 | 13F | Harbor Investment Advisory, Llc | 347 | 0,00 | 14 | 0,00 | ||||
| 2025-08-01 | 13F | Koss-Olinger Consulting, LLC | 0 | −100,00 | 0 | |||||
| 2025-08-06 | 13F | AE Wealth Management LLC | 13 004 | −4,63 | 508 | −0,97 | ||||
| 2025-07-30 | 13F | Onyx Bridge Wealth Group LLC | 32 058 | 3,63 | 1 252 | 7,56 | ||||
| 2025-07-22 | 13F | Valpey Financial Services, LLC | 9 641 | 377 | ||||||
| 2025-08-11 | 13F | Pineridge Advisors LLC | 58 | 1,75 | 2 | 0,00 | ||||
| 2025-08-14 | 13F | Visionary Wealth Advisors | 154 771 | 183,38 | 6 047 | 194,21 | ||||
| 2025-05-14 | 13F | Van Hulzen Asset Management, LLC | 0 | −100,00 | 0 | −100,00 | ||||
| 2025-07-30 | 13F | Brookstone Capital Management | 27 393 | −3,20 | 1 070 | 0,56 | ||||
| 2025-08-08 | 13F | Capital Investment Advisory Services, LLC | 13 | 0,00 | 1 | |||||
| 2025-08-13 | 13F | Legacy Capital Wealth Partners, LLC | 55 324 | −4,74 | 2 162 | −1,10 | ||||
| 2025-04-21 | 13F | Nelson, Van Denburg & Campbell Wealth Management Group, LLC | 0 | −100,00 | 0 | |||||
| 2025-07-25 | 13F | Sovereign Financial Group, Inc. | 14 358 | 30,49 | 561 | 35,27 | ||||
| 2025-08-04 | 13F | Hantz Financial Services, Inc. | 0 | −100,00 | 0 | |||||
| 2025-05-06 | 13F | Venturi Wealth Management, LLC | 0 | −100,00 | 0 | |||||
| 2025-07-17 | 13F | Tempus Wealth Planning, LLC | 7 229 | −5,45 | 282 | −1,74 | ||||
| 2025-08-11 | 13F | Bellwether Advisors, LLC | 646 | 5,73 | 25 | 13,64 | ||||
| 2025-08-15 | 13F | Morgan Stanley | 195 538 | 10,08 | 7 640 | 14,29 | ||||
| 2025-05-13 | 13F | EverSource Wealth Advisors, LLC | 0 | −100,00 | 0 | |||||
| 2025-08-12 | 13F | Global Retirement Partners, LLC | 662 | 0,00 | 26 | 4,17 | ||||
| 2025-05-20 | 13F | Belpointe Asset Management LLC | 0 | −100,00 | 0 | |||||
| 2025-07-28 | 13F | Rik Saylor Financial, Inc. | 30 396 | −1,56 | 1 188 | 2,24 | ||||
| 2025-08-14 | 13F | Camarda Financial Advisors, LLC | 18 126 | 8,02 | 708 | 12,20 | ||||
| 2025-08-18 | 13F/A | National Bank Of Canada /fi/ | 31 103 | −0,13 | 1 214 | 3,67 | ||||
| 2025-07-24 | 13F | Costello Asset Management, INC | 2 635 | 0,00 | 103 | 3,03 | ||||
| 2025-08-13 | 13F | Millington Financial Advisors, LLC | 10 472 | 3,64 | 410 | 10,84 | ||||
| 2025-07-21 | 13F | Consilium Wealth Advisory, LLC | 36 781 | −24,24 | 1 437 | −21,30 | ||||
| 2025-08-12 | 13F | Archvest Wealth Advisors, Inc. | 103 050 | −0,28 | 4 026 | 3,55 | ||||
| 2025-07-31 | 13F | Briaud Financial Planning, Inc | 2 | 0 | ||||||
| 2025-08-11 | 13F | One Capital Management, LLC | 21 920 | −11,55 | 856 | −8,15 | ||||
| 2025-08-12 | 13F | BlueStem Wealth Partners, LLC | 36 393 | −2,87 | 1 422 | 0,85 | ||||
| 2025-08-06 | 13F | Nvwm, Llc | 176 | 7 | ||||||
| 2025-08-14 | 13F | Qube Research & Technologies Ltd | 159 | −18,04 | 6 | −14,29 | ||||
| 2025-07-22 | 13F | USAdvisors Wealth Management, LLC | 6 577 | 0,52 | 0 | |||||
| 2025-07-16 | 13F/A | CX Institutional | 508 | 7,86 | 0 | |||||
| 2025-08-04 | 13F | Assetmark, Inc | 17 556 | −4,19 | 686 | −0,58 | ||||
| 2025-08-13 | 13F | Jones Financial Companies Lllp | 1 723 | 108,60 | 67 | 116,13 | ||||
| 2025-07-30 | 13F | Financial Perspectives, Inc | 0 | −100,00 | 0 | |||||
| 2025-07-23 | 13F | 1 North Wealth Services Llc | 1 830 | 0,00 | 71 | 4,41 | ||||
| 2025-08-07 | 13F | Allworth Financial LP | 3 587 | 2,19 | 140 | 6,87 | ||||
| 2025-08-11 | 13F | TRUE Private Wealth Advisors | 11 380 | 0,00 | 445 | 3,74 | ||||
| 2025-08-14 | 13F | CoreCap Advisors, LLC | 824 | 0,00 | 32 | 3,23 | ||||
| 2025-04-25 | 13F | Albion Financial Group /ut | 0 | −100,00 | 0 | |||||
| 2025-08-13 | 13F | Continuum Advisory, LLC | 0 | −100,00 | 0 | |||||
| 2025-05-15 | 13F | Atalanta Sosnoff Capital, Llc | 0 | −100,00 | 0 | −100,00 | ||||
| 2025-08-14 | 13F | GWM Advisors LLC | 2 045 | 13,93 | 80 | 17,91 | ||||
| 2025-08-12 | 13F | BlackRock, Inc. | 317 471 | −2,78 | 12 404 | 0,94 | ||||
| 2025-08-14 | 13F | Sunbelt Securities, Inc. | 315 | −51,24 | 12 | −54,17 | ||||
| 2025-08-05 | 13F | Prosperity Consulting Group, LLC | 13 583 | 1,27 | 531 | 5,16 | ||||
| 2025-08-13 | 13F | GeoWealth Management, LLC | 7 912 | −70,17 | 309 | −69,04 | ||||
| 2025-07-17 | 13F | Moss Adams Wealth Advisors LLC | 6 189 | 0,49 | 242 | 4,33 | ||||
| 2025-07-15 | 13F | Td Private Client Wealth Llc | 743 | 29 | ||||||
| 2025-07-31 | 13F | United Community Bank | 1 425 | 0,00 | 56 | 3,77 | ||||
| 2025-08-06 | 13F | Commonwealth Equity Services, Llc | 37 044 | 7,89 | 1 | 0,00 | ||||
| 2025-07-15 | 13F | Fortitude Family Office, LLC | 0 | 0 | ||||||
| 2025-04-22 | 13F | Flagship Harbor Advisors, Llc | 0 | −100,00 | 0 | |||||
| 2025-08-14 | 13F | UBS Group AG | 28 241 | −2,66 | 1 103 | 1,10 | ||||
| 2025-08-15 | 13F | Tower Research Capital LLC (TRC) | 0 | −100,00 | 0 |